A Market Timing Report based on the 04-26-2019 Close, published Sunday, April 28th, 2019…
I deliver focused comments on market timing once a week. These are supplemented with daily “Tweets/StockTwits” (see links below) and comments in the “markettiming” room on StockTwits.
1. SP500 Index Market Timing (S&P 500 Index®; SPY, SPX):
Friday’s GDP report was good news for Trump and the country in that Y/Y Real GDP rose to 3.2% from 3.0% the past two quarters, and SAAR GDP (headline number that attempts to project the entire year from one quarter’s seasonally adjusted results – it doesn’t work well btw) was also 3.2% well above the Atlanta and NY Federal Reserves estimates of 2.7% and 1.4%. Maybe they should have their “NOWcasting” licenses revoked. There were some nuances involving trade and inventories that call the full strength of the report into question, but the results still don’t reek of economic recession.
Econoday pointed out…
“A clearer look on underlying domestic demand comes from final sales to domestic purchases, a reading that excludes both net exports and inventories and where the growth rate was only 1.4 percent.”
The consumer is not as strong as s/he should be with the labor market as strong as it is. Inventory build-up adds to GDP, but also may mean sales are slowing. This means there is underlying weakness not revealed by the headline or even the Y/Y number.
Here is the SAAR GDP Headline data:

Seasonally Adjusted Annualized Rate of Real GDP. Stronger than expected.
So the economy is doing OK, but not firing on all cylinders. How about the markets?
The SP500 Index is now testing the prior all time high of 2940.91 (intraday high), closing on Friday, April 26th, at 2939.88. As said here, the market was bound to complete the re-topping process if it was able to climb above all three lower highs of Oct., Nov., and Dec. 2018…and it did. That is why I bought that breakout, and why I will likely buy the next breakout to new all time highs if it happens. Sometimes, the market does not “let you in.” The next 15% correction could come from 20% higher for all we know. Adding slowly mitigates the risk, when there is no major discount in the market as there was in December.
The SP500 Index is now in the 2017 upward channel, just above the up trend line, another healthy sign. Still, a new high is needed and there is no point in buying at this point for most investors. I’ll wait to add on the breakout move.
Let’s check in with the earnings trend again…
Earnings Risk: what is shown are the projections in the FactSet 3-15-19 report followed by the reports from 4-12-19 through 4-26-19 (details HERE)…
The earnings numbers for the SP500 Index improved slightly for Q1, but are slightly worse for Q2 and Q4. Revenue estimates ticked up a bit for Q1 and Q4, while they are a bit weaker for Q2. This new look is with 46% of companies reporting. A total of 164 companies of the SP500 Index will report this coming week vs. 150 last week.
For Q1 2019, analysts are projecting earnings growth of -3.6% -> -4.3% -> -3.9% -> -2.3% and revenue growth of 4.9% -> 4.8% -> 5.0% -> 5.1%.
For Q2 2019, analysts are projecting earnings growth of 0.1% -> -0.4% -> -0.5% -> -0.6% and revenue growth of 4.6% -> 4.2% -> 4.4% -> 4.3%.
For Q3 2019, analysts are projecting earnings growth of 1.8% -> 1.4% -> 1.3% -> 1.3% and revenue growth of 4.4% -> 4.1% -> 4.4% -> 4.4%.
For Q4 2019, analysts are projecting earnings growth of 8.1% -> 8.3% -> 8.2% -> 8.1% and revenue growth of 4.8% -> 4.7% -> 4.7% -> 4.8%.
For CY 2019, analysts are projecting earnings growth of 3.8% -> 3.4% -> 3.4% -> 3.6% and revenue growth of 4.9% -> 4.6% -> 4.7% -> 4.7%.
Are the Bulls serious? As I asked four weeks ago…
What would satisfy me that the Bulls were serious about this advance?
Let’s check that list once again…
1. New high. Re-topping is obviously Bullish but not making it to a new high in a short period of time would be Bearish.
2. VIX below the “Bull Nirvana Number.” 12.73 close on Thursday, but above my Bull target #8, so only a partial check. It must fall below 12.17 again (see VIX targets at base of report).
3. AD % Line: 16,434 vs. 16,384 last week and still in consolidation vs. the prior high of 16451. Partial check. Needs a new market timing breakout as does the SP500 Index.
4. Volume: No check because volume FELL on Friday when the SPX closed UP 0.47%. Volume has been declining most recently since 3-29-2019. Some good news? Volume was up this week for the first week following the last “Fed FOMC Meeting” week.
Here’s a Brief Review of the Other Market Risks at Hand:
Mexico Border Closing Risk: President Trump folded under Republican pressure. The Republican Congress has handed its family jewels over to Trump largely, but not where it comes to usurping their legislative powers.
China Deal Risk: Trump et. al. are very quiet lately, as trying to pump the market every week with more “It’s going well!” talk was starting to backfire. There is going to be a “big, beautiful deal.” From 4-18-19: “We had better have a decent deal, and the talk is the results will be respectable.”
Mueller Report Risk: Congress will use the report as a way to get to Trump’s tax returns as well as pursue their direct and legitimate oversight mandate passed on to them by Special Counsel Robert Mueller. Anyone with a brain cell can see that Mueller passed the issue of obstruction on to Congress as the legitimate place for Trump to defend himself if need be. He said he could not come to a conclusion Trump committed criminal acts of obstruction, as DOJ rules say he cannot indict a sitting President. That meant if he said “Trump committed the crime of obstruction of justice,” Trump could not then defend himself against that charge, as he would not be indicted by the accusing Mueller. Note also, the public often fails to understand the difference between the law and the truth. Trump and his people were negligent in not reporting Russian contacts to the FBI, but it did not rise to the level of a crime per Mueller.
In regard to the obstruction of justice issue, Mueller basically refused to “act like a judge,” given the constraints of DOJ rules. Trump would not have ended up in court without an indictment. He would have simply had Mueller saying he was guilty. Therefore, it is Congress’ job rather than Mueller’s to determine whether the evidence rises to the level of obstruction of justice or not. No, Trump has not been exonerated as many pundits have falsely said along with Trump. There’s been no “total exoneration.” That is certain.
What is not certain is Trump’s eventual conviction by Republicans in the Senate. A simple majority in the House could impeach Trump, but they know defeat in the Senate will make Trump out to be the victim of a “coup by the Democrats” and strengthen his support. They know a failure to convict would be a trap for them.
It will go on for many months. Yet Trump’s risk of impeachment has declined dramatically, regardless of how badly he’s behaved by supporting the killer Communist Putin’s interference in our election (he publicly said the Russians should hack Clinton’s emails; what kind of a leader does that?), and by obstructing the investigation, which he obviously did, whether it can be proven as a criminal offense in a Senate trial or not. It is claimed that his staff whom he now publicly hates and has fired (like his wise White House counsel, Don McGhan), saved his presidency, despite Trump’s attempts to destroy himself by ordering Don McGhan to fire the Special Counsel Robert Mueller through the AG.
2020 Election Risk: Read my comments on this HERE. If the economy is strong at the time of the election, it will be hard for any Democrat to beat Trump, especially if they lean toward greater socialism. The risk went up though with Biden now in the race as of Friday. That would mean at least going back to Obama tax rates. How many investors would sell stocks ahead of that change? More than a few. There will also be revenge for the high tax states now suffering under the Trump/GOP Tax Law due to the $10K limit on state and local tax deductions. Those changes will be rolled back by a Democrat President.
One big catch: the Democrats must take over the Senate again, or everything they promise in the campaign will die in the Senate. That is why GOP donors were focusing so much on control of the Senate. They maintain control over changes from Trump/GOP tax policy, until 10 years after the tax law was passed, when it it phased out for individuals but not for businesses. Another reason Republican donors will not let the Senate slip from their hands without a big fight is because they know what that means – a loss of power over the courts through Presidential appointment power.
Deficit Threat: From last week: “Both parties intend to spend us into the ground and destroy the U.S. dollar, which is why I consider gold a long term hedge worth keeping. The only thing that’s saved us is the US Dollar being the #1 reserve currency, which China intends to take from us. If we lose that, our interest rates would skyrocket and cause a crash in the stock market. It’s not a near term threat for the simple reason that the China, Japan, and Europe are simultaneously weakening their own currencies.”
Fed Rate Hike Risk: From 4-18-19: “You know my stand on this. The Federal Reserve is neutral, not dovish.” Rates may have rolled over for the near term (see rate chart below), which takes the pressure off the Federal Reserve. The GDP Price Index reported Friday (includes investment and consumer spending vs. only consumer spending for CPI) was low too.
Now take a look at the SP500 chart. The orange lines are the 2017 up channel.
SP500 Large Cap Index (click chart to enlarge; SPX, SPY):
The Jan. 2018 high was 2872.87 to be clear…

Testing the prior top!
Now let’s check in on two “Canary Signals” we’ve been following:
“Intel-igent Market Timing Signal” (Intel; INTC): Negative. Fell 8.99% on Friday and breached the weekly up trend line. The media acted as though they just heard what the CEO had warned several quarters back of in terms of H1 weakness in 2019.
Bank of America (BAC) Market Timing Signal: Positive. but… BAC closed back above the high of 30.14. Last week I said rates looked a bit stretched, and they fell, and yet BAC did not fall. The trouble is lower rates mean economic weakness at a certain level (here) and that does not help banks just as lower rates themselves hurts their earnings. If rates continue to move lower this coming week, BAC will likely fall. And the market could pull back as well.
Now let’s go on to review investor sentiment…
Keep up-to-date during the week at Twitter and StockTwits (links below) where a combined 33,951 investors are following the markets with me…
Follow Me on Twitter® Follow Me on StockTwits®.
Join the Conversation in the StockTwits “MarketTiming” Room
Survey Says!
Sentiment of individual investors (AAII.com) showed a Bull minus Bear percentage spread of +13.35% vs. +15.73% last week.
All still true this week as last: “The neutrals are [WELL OVER] 40%, which is highly correlated with an UP market 6 months later. The odds per AAII research are above 80%. The sentiment spread slipped this week, so the odds this is a top are low. That does not preclude a pullback (a dip to a correction; see “New Rules“) in a Bull market.” Sentiment says “The Bull market is not over.”
| Bulls | Neutrals | Bears |
| 33.52% | 46.31% | 20.17% |
| Thurs. 12 am CT close to poll | ||
2. U.S. Small Caps Market Timing (IWM): Small caps were leaning down last week as rates were rising and this week they have moved back up to the prior lower high as rates fell – but on less volume! I have only specific stock exposure to small caps, not through index funds, the exception a software ETF that invests a bit across all capitalizations (hint: I mentioned the buy on my social media feed).
Russell 2000 U.S. Small Cap Index (click chart to enlarge; IWM, RUT):
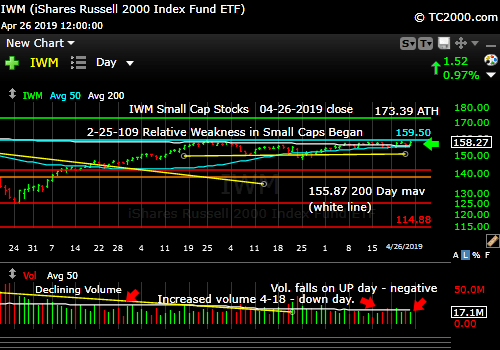
Still lagging large caps.
3. Gold Market Timing (GLD): Gold rallied when it had to. Now it must rise above that upper wedge line (yellow). The reversal number is shown on the chart.
The failure of gold of late is due to confidence in the U.S. stock market and economy, to not fall into recession, which would keep the Federal Reserve vigilant on rates, vs. the current neutral stance. If gold were completely tied to “real interest rates,” it would be UP not down as here is what happened since the 1.-20-2019 close to 4-26-2019… Realize that if real interest rates had been rising, gold would have fallen substantially.
| 1/2/2019 | 4/26/2019 | Change | |
| GLD | 121.33 | 121.37 | 0.03% |
| Real 10 Year Yield | 0.96 | 0.54 | -43.75% |
| UUP | 25.64 | 26.31 | 2.61% |
The Gold ETF (click chart to enlarge the chart; GLD):

Gold up with up volume. Positive.
4. Interest Rate Market Timing – The 10 Year Yield fell again this week. I’ve been keeping track of a couple of key levels. The close Thursday was 2.505%, below both numbers mentioned on 4-01-2019:
“Note: The key levels for the Rate Bulls to cross to the upside are 2.554% and the 1-31-19 low of 2.626%.”
There is no rate shock in sight with a falling GDP Deflator Year/Year (See the chart at the bottom HERE). The lift in rates we saw the prior few weeks was a counter trend move as it appears now.
Check out the “Market Signal Summary” below – after you review the following chart…
U.S. 10 Year Treasury Note Yield (click chart to enlarge; TNX, IEF, TYX, TLT, TBF):

Rates back to falling!
Now let’s review three key market timing signals together….
Do not use these signals as a trading plan. They are rough guidelines. I currently share my own moves on social media (links above).
MY MARKET SIGNAL AND TREND SUMMARY for a Further U.S. Stock Market Rally with Real GDP Growth (“Real” means above inflation):
Stock Signal YELLOW for a further U.S. stock market rally with a Bullish SP500 Index trend. The signal here is based on small caps, as they often lead the market down.
The V*IX (which relates to SPX volatility; * added to symbol to throw off the webcrawlers!) closed at 12.73 vs. 12.10 last week. These are the other targets: 13.31, 14.04-14.08, 15.04, middle “fulcrum” point = [15.94-15.95 to 16.09], 17.06, 17.27, and 17.89. The bonus target is [12.-17-12.37]. The Bulls now have 7 of 8 targets. Bears 1.
The ‘Bull Nirvana Target’ is our V*IX # of 2018: 13.31.” (That # is target #7 for the Bulls.)
Gold Signal YELLOW for a further U.S. stock market rally with a NEUTRAL Gold Trend. What gold does mostly as I’ve written HERE is follow real interest rates, but I’ve explained more on that above.
STILL HOLDS 4-26-19: G*LD has to rise above 123.19 on an immediate basis (* added to throw off the “crawlers,” as I don’t like being part of “consensus.”) Once it breaks the nearest low, the trend turns Bearish.
From before: “Remember GLD is being used as an indicator for the ECONOMY here.” If gold continues to rise, it means the market believes real rates will fall, which means the global economy is slowing. That would hurt U.S. stocks.
Rate Signal YELLOW for a further stock market rally with a Bearish 10 Year Yield Trend. Rates usually RISE slowly in a strong recovery and the stock market rally continues, as I’ve repeated multiple times on social media as well as here. Empirically though, rates that are “lower” (than 3.11%) and NOT rising rapidly have allowed the market to climb back to the prior all time high (ATH). Rates fell rapidly in Dec. and stocks fell, but they fell as rapidly in March, and the market dipped a bit, but eventually only went sideways – they did not crash. Rates have been climbing since the end of March, as the market rallied further. Again, slowly rising rates is fine in a strengthening economy.
I said weeks ago, “Watch the oil price too. Higher oil tends to mean higher rates.” WTI closed at 63.30 vs. 64.07 last week. Last week I said, “Oil is still in an uptrend, so either rates will keep rising now and the oil rally will continue, OR rates will resume their fall and oil will reverse.” This chart shows the close was below the prior consolidation range for the first time in the entire rally: CHART. The last consolidation was around 64.00 and the close was at 63.30. Negative for oil and Rate Bulls.
I’ll keep this here as a reminder: this is not currently an issue… “Watch the rate at which TNX climbs if the current trend reverses. If it shoots up very fast, stocks will correct.” In the Sept. 28th issue: “A rapid push higher in rates would mean trouble for stocks, as occurred in early 2018. That’s what I called ‘Rate Shock.'” The period of rising rates in early October I called #RateShockII.
Thank you for reading. Would you please leave your comments below where it says “Leave a Reply”… or ask a question or report a typo…
Pay it forward by sending the link to MarketTiming.Blog (that link will immediately connect them to this webpage) to a relative or friend. Thanks for doing that.
Be sure to visit the website for more general investing knowledge at:
Standard Disclaimer: It’s your money and your decision as to how to invest it.
I thank Worden Brothers for the charting system I use to post these charts. If you want to know more about the charting system I use every day, go HERE. It makes it much easier to follow along with me if you can see the charts and manipulate them on your own computer. It’s a great investment to have an excellent charting system. Check it out with a free trial at the link above. I am an affiliate of Worden Brothers, though oddly I’ve never been paid a cent by them. If you HAVE subscribed to their service, please send me a message. 😉
Note: I’ve updated my criteria for the equity signal for a further U.S. stock market rally to the following: GREEN = Bullish, YELLOW = Neutral, RED = Bearish. In other words, the colors tell you whether the signal supports the stock rally or not, while the Bullish, Neutral, and Bearish designations are about the trend.
A BEARISH trend signal does not mean we should not buy. A BULLISH trend signal does not mean you cannot sell some exposure. It depends on what is going on in the economy and how oversold/overbought the market is at a given point whether the Bearish signal is to be sold or bought, sold on the next bounce, etc. and whether a Bullish signal is to be bought or if profits should be taken. A NEUTRAL trend signal does not mean the end of the Bull or Bear. It means to wait and look for possible subsequent entry points within the existing trend, Bull or Bear, but preserve capital if the entry fails. Our strong intention is to buy low and sell high. By the way, I will keep showing the prior orange “Trigger lines” in the IWM and GLD charts for now as reference points only; they have historical value for us from the post-2016 election period.
Copyright © 2019 By Wall Street Sun and Storm Report, LLC All rights reserved.
