A Market Timing Report based on the 05-03-2019 Close, published Saturday, May 4th, 2019…
I deliver focused comments on market timing once a week. These are supplemented with daily “Tweets/StockTwits” (see links below) and comments in the “markettiming” room on StockTwits.
1. SP500 Index Market Timing (S&P 500 Index®; SPY, SPX):
Friday’s Employment Situation report on Jobs was good news for Trump and the country. The ADP Employment report gave it away ahead of time by being overly strong vs. consensus, but on Friday, the U.S. Labor Dept. numbers confirmed it, moving the SP500 Index back above a key market timing high, the prior ATH (All Time High).
New highs are POSITIVE, not negative as most investors believe who trail the market with a 3% average annualized return vs. the market’s typical return of 8-10%. Don’t be a 3%-er! When many investors see a new high, they say “I missed it.” Sometimes that is the case, but only if you see a breakdown back below the breakout. Yes, you must be willing to change your mind if things change, or you’ll risk being caught holding the bag. But if you continue to believe that higher stock prices mean you should not invest, you need to read and study the markets.
The hyper-Bulls, and there are many today, will tell you the market will always go higher, and they never sell any exposure no matter how high their stocks go, at least until it’s “late to be selling.” The hyper-Bears have mud on their face for clinging to their Bearish stance after December. You notice that most of them don’t recognize the market for what it is, but rather for what they assume it SHOULD BE? As one of my mentors once taught, “Don’t SHOULD on yourself.” You cannot change the past, but you can admit to it and learn from it, and then move on from it to higher highs in your net worth and overall happiness in life.
We know the market is a more frothy now as it was in early 2018, because we are back to the point in the market where cloud companies like Veeva Systems trades at a Price: Sales ratio of 24.2 per Yahoo Finance, while most would say a Price: Sales ratio over 10 is already “expensive.” The chart of that company is tempting for sure, as after the 2018 drawdown into December of about 29%, it’s been a fairly steady climb. The price corrected only 8% into March and then again by about 9% in April. Meanwhile, it’s up about 80% from the December 2018 low. Spectacular, right? Yes, until they “miss” on their revenues and/or earnings and are pummeled by over 20% in two days as Xilinx (XLNX) was last week (and even it has bounced). I bought some XLNX on the first day of that downturn by the way. It is selling for 9.85 X Sales per Yahoo Finance.
Ten times sales is “rich” per most standards of valuation. Many stocks reach higher values than “rich,” as VEEV has, because there are a limited number of companies that are growing sales by 14.3% as XLNX is or by 20.70% as VEEV is. By comparison, Facebook sells for 9.47 X Sales. Not cheap any longer, but not as extended as VEEV. Facebook’s (FB) projected revenue growth this year? A huge 24.3%. Does VEEV deserve a higher valuation. Is its addressable market that much bigger? Is its moat that much bigger? That’s what you need to look at. Can you make money in stocks for the “wrong reasons”? Of course.
If you have not been comparing your investments, I’d start now. Get rid of the ones that carry high risk with less revenue and earnings growth than other great growth companies, and add the latter to your portfolio. As one person, you can only sanely follow 10-15 companies unless you are manic depressive, in which case you are feeding your illness! If you depend on recommendations from others to invest, you had better be doing your own homework. Many recommenders fall asleep on their positions and/or fall in love with them. Eventually, they are awakened by the market! Better to “stay awakened.”
You need to take 100% responsibility for what you own. If you don’t have time for each conference call the company holds, you do not deserve to own the company. Sorry, but it’s the truth. If you don’t have the time, you are an amateur and would be better off in index funds, because you will likely be beaten by the machines unless we are in a trending Bull market with no ups and downs like 2017. Then came 2018! 2019 smells like 2017 or early 2018, which was followed by a sharp jerk down in the markets.
Don’t depend on ANYONE to tell you what to do. Listen and read, sure, but then decide for yourself, and again, take 100% responsibility for what you decide! Do not blame Trump, the Fed, Fed Chair Powell, Pelosi, drug price controls, tsunamis, nuclear threats, or elections for your results! Blaming others for your screw-ups is the way NOT to grow. They are YOUR RESULTS alone.
What about the predicted revenue growth rate for the SP500 Index? Per FactSet it’s 4.7%. When growth is slowing around the world and earnings are falling (still -0.8% for Q1 2019 per FactSet after 78% of U.S. companies have reported), investors chase the best growth they find, wherever they can find it. Highly valued companies can be bid still higher when such a chase is “on.”
I would risk manage my profits in companies like VEEV, XLNX, and even FB, as no one can tell you when the market will turn over, and they cannot say whether the market will first rise another 30% before falling 25% or whether the current 2nd breakout for the SP500 Index will fail, and the market will correct significantly (you can read what I consider a “max correction” in a Bull HERE – scroll to “New Rules” and keep that page bookmarked for reference).
The SP500 Index is now testing once again ABOVE the prior Sept. 2018 ATH of 2940.91 (intraday high), closing on Friday, May 3, at 2945.64. I predicted this retopping after the breakout above the Oct. 2018 high and invested accordingly. I bought that breakout and bought on dips prior to that. I told you I would, and I did.
My exposure is lower than I would have advised for reasons that are specific to my financial picture. I am deploying a cash infusion. I would be OK with an exposure of 85-90% to the U.S. market and select foreign markets in terms of TOTAL equity exposure worldwide (e.g. see social media links above on what I’ve been buying in China and Hong Kong) VERSUS my usual maximum exposure to equities. I like the idea of having some excess cash now to buy the dips. That 85-90% range of exposure means if you are usually at 60% stocks in a Bull market as your max. exposure, you would now be at 54% exposure to stocks worldwide if you choose to be at the 90% high end of the range vs. your usual “100% exposure” level of 60%. And that’s only if you agree with me. If not, just be sure to risk manage your under/over-exposure! Remember, I give you my “% of max. exposure” because I want you to consider adjusting to YOUR situation and preferences, not mine.
There is risk in being under-invested and in being over-invested. Also, try to buy the dips in growth stocks, rather than chasing them. I chased a stock on Friday, but it had specific news that explained its change in trend, which is why I bought it. It was up another 11% or so after already being up roughly 12% earlier in the day. I kept my position size small as you may have guessed. If you don’t size your positions carefully, you don’t know what you are doing. If you ignore position sizing, immediately run to the racetrack and put all your money on “Molly for Place.” Same thing. 😉 Read about it if you don’t know what I’m talking about. Many of you do.
Let’s check in with the earnings trend again…
Earnings Risk: what is shown are the projections in the FactSet 3-15-19 report followed by the reports from 4-12-19 through 5-03-19 (details HERE)…
The earnings numbers for the SP500 Index improved slightly for Q1, but are slightly worse for the coming three quarters. Revenue estimates ticked up a bit for Q1, but were unchanged for the rest of the year. This new look is with 78% of companies reporting. A total of 59 companies of the SP500 Index will report this coming week vs. 164 last week.
For Q1 2019, analysts are projecting (mostly reported!) earnings growth of -3.6% -> -4.3% -> -3.9% -> -2.3% -> -0.8%
and revenue growth of 4.9% -> 4.8% -> 5.0% -> 5.1% -> 5.2%.
For Q2 2019, analysts are projecting earnings growth of 0.1% -> -0.4% -> -0.5% -> -0.6% -> -1.3%
and revenue growth of 4.6% -> 4.2% -> 4.4% -> 4.3% -> 4.3%.
For Q3 2019, analysts are projecting earnings growth of 1.8% -> 1.4% -> 1.3% -> 1.3% -> 0.8%
and revenue growth of 4.4% -> 4.1% -> 4.4% -> 4.4% -> 4.4%.
For Q4 2019, analysts are projecting earnings growth of 8.1% -> 8.3% -> 8.2% -> 8.1% -> 7.5%
and revenue growth of 4.8% -> 4.7% -> 4.7% -> 4.8% -> 4.8%.
For CY 2019, analysts are projecting earnings growth of 3.8% -> 3.4% -> 3.4% -> 3.6% -> 3.4%
and revenue growth of 4.9% -> 4.6% -> 4.7% -> 4.7% -> 4.7%.
Are the Bulls serious? As I asked five weeks ago…
What would satisfy me that the Bulls were serious about this advance?
Let’s check that list once again. I’ve added a 5th this week…
1. New high. Back to a new high. Check, but need to keep this going for more than a day or two!
2. VIX below the “Bull Nirvana Number” AND my bonus number? Yes, 12.87 close on Friday, but above my Bull target #8, so only a partial check. (see VIX targets at base of report).
3. AD % Line: 16,463 vs. 16,434 last week vs. the prior high of 16451 on 4-17. But that’s only one day above that high as the market dipped for two days this past week. Partial check.
4. Volume: No check because volume FELL on Friday when the SPX closed UP 0.96%. Volume has been declining most recently since 3-29-2019. Good news? Volume was UP for the week for the past two weeks, and the market was up for both weeks. The last negative week was before Easter weekend and volume declined, which is positive too.
5. The Matrix Signal: The U.S. Index Matrix is more supportive this week (e.g. small caps; see section 2 below).
Here’s a Brief Review of the Other Market Risks at Hand:
Mexico Border Closing Risk: President Trump folded under Republican pressure. It’s not going to happen unless things get appreciably worse. To be fair, things have gotten worse due to the migration from Central America, but I’m sure we can deal with it without flipping out and alarming grandma into thinking she’ll be beaten up by a refugee next week. Immigration is going to be needed if our country is going to pay its debts and keep Medicare and Social Security working and the U.S. dollar strong. Our unemployment rate is low, and many of the people left don’t have the skills to fill the available jobs of which there are millions.
China Deal Risk: Trump et. al. are very quiet lately, as trying to pump the market every week with more “It’s going well!” talk was starting to backfire. There is going to be a “big, beautiful deal,” and if not, the markets may react mildly negatively. They’ll like the fact that big tariffs are off the table in either case.
Mueller Report Risk: I covered this in full last week HERE. My conclusion was Trump’s risk of impeachment has declined dramatically, regardless of how badly he’s behaved, which Mueller documented he had. Even die hard Trump fans can understand Trump and company screwed up by not reporting the Russian contacts, instead of meeting with them. And they can understand that telling Russia to hack us in a public speech is “not cool!” We deserve better behavior from our leaders. But being foolish and unethical is not apparently impeachable. 😉
2020 Election Risk: Read my comments on this HERE. If the economy is strong at the time of the election, it will be hard for any Democrat to beat Trump, especially if they lean toward greater socialism. The risk went up though with Biden now in the race. This week Trump trails Biden by 7.3% as reported HERE, but it’s very early! Remember coming from behind worked well for Trump in 2016 vs. Hillary’s coast to the finish, so the Dems have much work to do if they want the win. And they’ll have to campaign up to the last minute this round to beat Trump. I pointed out last week why the Senate races are so important. That still holds!
Deficit Threat: Moderate, but more an issue when rates are rising, not when stable to falling. This is an ongoing threat to our current system, and fiscal liberal Trump (it’s a fiscal liberal who spends more than he has!) is guilty of adding to this ticking clock. As said, “Both parties intend to spend us into the ground and destroy the U.S. dollar, which is why I consider gold a long term hedge worth keeping. The only thing that’s saved us is the US Dollar being the #1 reserve currency, which China intends to take from us. If we lose that, our interest rates would skyrocket and cause a crash in the stock market. It’s not a near term threat for the simple reason that the China, Japan, and Europe are simultaneously weakening their own currencies.”
Fed Rate Hike Risk: Low. The Fed kept rates constant this Weds. at their meeting, and as I’ve been saying, Powell expressed he was not likely to either cut rates (as some had expected) or raise them immediately. He is neutral, NOT dovish. The market did not like that, but then liked the jobs report that was stronger than expected, making a big downturn less likely. Also, Fed. Gov. Bullard who is a voting member this year said he thinks the Fed rate is about 0.4% too high. It should be at 2% vs. 2.4% currently (range set at 2.25-2.50%). From 4-18-19: “You know my stand on this. The Federal Reserve is neutral, not dovish.” Not cut, no hike, just neutral!
So what’s my “SP500 Index Market Timing DownsideTarget”? My loyal readers know I don’t like the concept of targets, because every market is an impeachment away, a tsunami away, or a World Trade Center away from a severe correction or worse (again refer to my “New Rules”; they make more intuitive sense than the “Old Rules.”). Furthermore, the Bull is still running.
So in that context, what do targets mean? I think valuing the market and having less exposure when things get hyper-bullish makes sense, but not too much less, because that’s when you are making your money! If you have too much excess cash you are blunting your returns. Too little and you have no ability to respond to an abrupt crash. That is why I’m keeping some excess cash right now, vs. in 2017 when I was above 100% of my usual maximum exposure to stocks worldwide.
That said, what’s my guess at a target? A return to the Dec. low would be unlikely in my view, as it was overdone. If we get a sizable correction, I’d expect a Fibonacci retracement maximum of 50-61.8% back toward the Dec. low as the worst case scenario for the intermediate term (up to the election).
Possible SP500 Index Target: (Corrected 5-13-2019) That would be S*PX (using 5-01 intraday high) 2581 (61.8% pullback of the rally from Dec. low) to 2653 (50% pullback), which would encompass the Oct. 2018 low, which is a “natural target” on the charts. (Raw numbers: 5-01-19 SP500 Index Intraday ATH = 2954.13. Dec. 24th low 2351.10. Points in Rally = 603.03. Oct. low = 2603.54.)
Now take a look at the SP500 chart. The orange lines are the 2017 up channel.
SP500 Large Cap Index (click chart to enlarge; SPX, SPY):
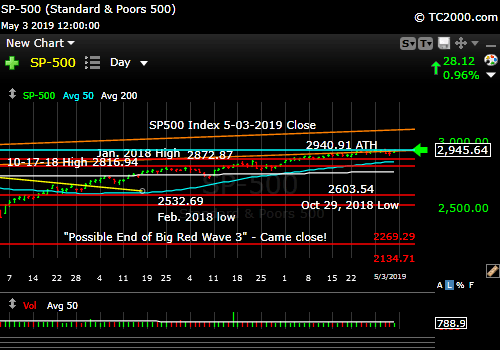
Back above the Sept. 2018 ATH.
Now let’s check in on two “Canary Signals” we’ve been following:
“Intel-igent Market Timing Signal” (Intel; INTC): Negative. Fell 8.99% on Friday 4-26-19 after they reported earnings and breached the weekly up trend line. The test of 50.60 was successful however. Only a bounce above trend would erase this damage.
Bank of America (BAC) Market Timing Signal: Positive. but… Although BAC closed back above the high of 30.14, and is now at 30.71, the upside for rates in the short to intermediate term is not great, so financials’ prospects are also not great. XLF is keeping up with the market, while Tech has been beating it. Which do you want to own?
Now let’s go on to review investor sentiment…
Keep up-to-date during the week at Twitter and StockTwits (links below) where a combined 33,951 investors are following the markets with me…
Follow Me on Twitter® Follow Me on StockTwits®.
Join the Conversation in the StockTwits “MarketTiming” Room
Survey Says!
Sentiment of individual investors (AAII.com) showed a Bull minus Bear percentage spread of +17.72 vs. 13.35% last week. Sentiment is NOT maxed out, so the statement I made last week applies (link to upper right).
| Bulls | Neutrals | Bears |
| 39.02% | 39.63% | 21.3% |
| Thurs. 12 am CT close to poll | ||
2. U.S. Small Caps Market Timing (IWM): Small caps are making a move now. Actually, the breakout this week was significant and the outperformance vs. large caps is also, so the move is tradable, but perhaps not investable. Why? The risk is higher than for large caps. I still see inflation as ticking up over the longer term and small caps don’t care for that backdrop. Use stops and pick the individual winners vs. investing in the index if you can. Otherwise, stand clear for now unless you are going to risk manage a trade based on this breakout.
Russell 2000 U.S. Small Cap Index (click chart to enlarge; IWM, RUT):
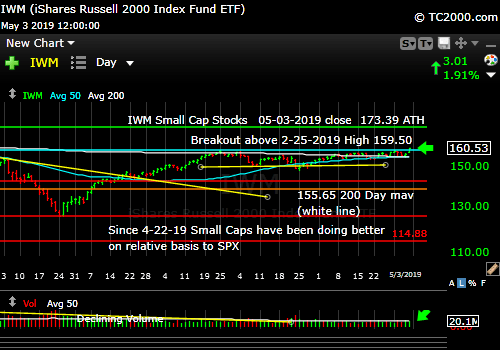
New breakout and outperformance recently.
3. Gold Market Timing (GLD): Gold fell on Powell’s remarks, while rates rose, and then GLD rose on Friday as rates fell. Still true: “Now it must rise above that upper wedge line (yellow). The reversal number is shown on the chart.” Of course, the US dollar rallied then fell with rates. The dance between gold, rates and the dollar was all as expected. The gyrations up and down, not so expected. 😉
The Gold ETF (click chart to enlarge the chart; GLD):
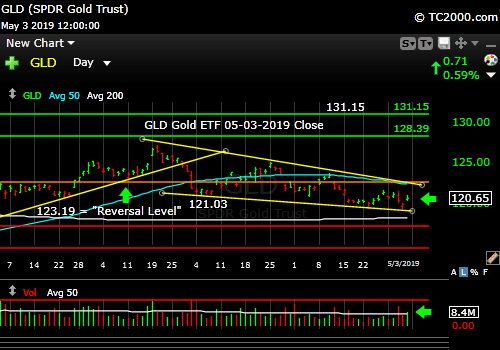
Still struggling to reverse the recent decline.
4. Interest Rate Market Timing – The 10 Year Yield rose minimally this week from 2.505% to 2.531% from Fri. to Fri. The test above 2.554% failed. The downtrend is still intact until the lower number quoted below is breached to the upside.
Prior: “Note: The key levels for the Rate Bulls to cross to the upside are 2.554% and the 1-31-19 low of 2.626%.”
Check out the “Market Signal Summary” below – after you review the following chart…
U.S. 10 Year Treasury Note Yield (click chart to enlarge; TNX, IEF, TYX, TLT, TBF):
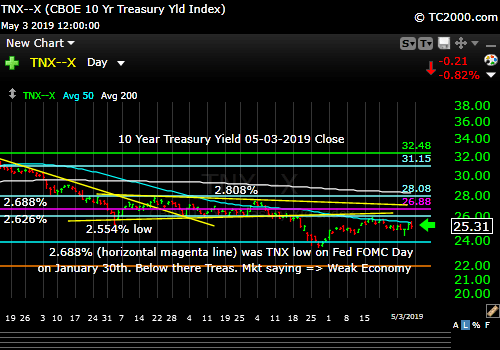
10 Year Yield still in downtrend until key levels are breached by the Rate Bulls.
Now let’s review three key market timing signals together….
Do not use these signals as a trading plan. They are rough guidelines. I currently share my own moves on social media (links above).
MY MARKET SIGNAL AND TREND SUMMARY for a Further U.S. Stock Market Rally with Real GDP Growth (“Real” means above inflation):
Stock Signal GREEN for a further U.S. stock market rally with a Bullish SP500 Index trend. The signal here is based on small caps, as they often lead the market down. Small caps have confirmed the current re-breakout of large caps.
The V*IX (which relates to SPX volatility; * added to symbol to throw off the webcrawlers!) closed at 12.87 vs. 12.73 last week. These are the other targets: 13.31, 14.04-14.08, 15.04, the “fulcrum” point = [15.94-15.95 to 16.09], 17.06, 17.27, and 17.89. The bonus target #8 is [12.-17-12.37]. The Bulls now have 7 of 8 targets. Bears 1.
The ‘Bull Nirvana Target’ is our V*IX # of 2018: 13.31.” (That is target #7 for the Bulls.)
Gold Signal YELLOW for a further U.S. stock market rally with a NEUTRAL Gold Trend. What gold does mostly as I’ve written HERE is follow real interest rates. A decline below 117.40 or a cut below the downward wedge lower line would turn the signal to GREEN for stocks.
STILL HOLDS 4-26-19: G*LD has to rise above 123.19 on an immediate basis (* added to throw off the “crawlers,” as I don’t like being part of “consensus.”)
From before: “Remember GLD is being used as an indicator for the ECONOMY here.” If gold continues to rise, it means the market believes real rates will fall, which in the current context means the global economy is slowing. That would hurt U.S. stocks.
Rate Signal YELLOW for a further stock market rally with a Bearish 10 Year Yield Trend. Rates usually RISE slowly in a strong recovery and the stock market rally continues, as I’ve repeated multiple times on social media as well as here. Empirically though, rates that are “lower” (than 3.11%) and are NOT rising rapidly have allowed the market to climb back above the prior all time high (ATH).
I said weeks ago, “Watch the oil price too. Higher oil tends to mean higher rates.” WTI closed at 61.94 vs. 63.30 last week. Last week I said the setup was “Negative for oil and Rate Bulls.” Oil did drop. It has broken trend but may retop as it did previously after the first break.
I’ll keep this here as a reminder: this is not currently an issue… “Watch the rate at which TNX climbs if the current trend reverses. If it shoots up very fast, stocks will correct.” In the Sept. 28th issue: “A rapid push higher in rates would mean trouble for stocks, as occurred in early 2018. That’s what I called ‘Rate Shock.'” The period of rising rates in early October I called #RateShockII.
Thank you for reading. Would you please leave your comments below where it says “Leave a Reply”… or ask a question or report a typo…
Pay it forward by sending the link to MarketTiming.Blog (that link will immediately connect them to this webpage) to a relative or friend. Thanks for doing that.
Be sure to visit the website for more general investing knowledge at:
Standard Disclaimer: It’s your money and your decision as to how to invest it.
I thank Worden Brothers for the charting system I use to post these charts. If you want to know more about the charting system I use every day, go HERE. It makes it much easier to follow along with me if you can see the charts and manipulate them on your own computer. It’s a great investment to have an excellent charting system. Check it out with a free trial at the link above. I am an affiliate of Worden Brothers, though oddly I’ve never been paid a cent by them. If you HAVE subscribed to their service, please send me a message. 😉
Note: I’ve updated my criteria for the equity signal for a further U.S. stock market rally to the following: GREEN = Bullish, YELLOW = Neutral, RED = Bearish. In other words, the colors tell you whether the signal supports the stock rally or not, while the Bullish, Neutral, and Bearish designations are about the trend.
A BEARISH trend signal does not mean we should not buy. A BULLISH trend signal does not mean you cannot sell some exposure. It depends on what is going on in the economy and how oversold/overbought the market is at a given point whether the Bearish signal is to be sold or bought, sold on the next bounce, etc. and whether a Bullish signal is to be bought or if profits should be taken. A NEUTRAL trend signal does not mean the end of the Bull or Bear. It means to wait and look for possible subsequent entry points within the existing trend, Bull or Bear, but preserve capital if the entry fails. Our strong intention is to buy low and sell high. By the way, I will keep showing the prior orange “Trigger lines” in the IWM and GLD charts for now as reference points only; they have historical value for us from the post-2016 election period.
Copyright © 2019 By Wall Street Sun and Storm Report, LLC All rights reserved.

I don’t know if Trump will be hard to beat! He obstructed justice and if he’s not impeached the Congress will be severely damaged for failure to perform oversight of the Executive Branch! I agree the Senate will not impeach him however! My concerns are not knowing what this administration is or will do regarding China trade or other policies home and overseas! This market is a “short” in the immediate since at these levels.
China will only be an issue if Trump doesn’t compromise on anything with the Chinese and ends up imposing 25% tariffs. That would tank the market. Any other conclusion would eventually be ignored by the market. Short term a lousy deal for the U.S. could cause a blip down, but I doubt it would drive a sustained correction. The market did not want the negotiations in the first place. Not that there are not issues that need to be addressed and for that I give Trump credit. No other admin. has done anything meaningful in that regard. Again, I’m an independent focused on what is positive for the markets and what is negative. A strong pro-US China deal could be a real positive for U.S. GDP. Trade at any moment is a zero sum game. If a deal allows us to export more to China and other countries suffer losses, we win, whether that is “fair” or not. Our GDP grows, as revenues rise with earnings. PE’s fall and stocks rise.
I would not consider the market a “short” or a “passive short” today as I’ve define that latter term, as it was able to recover back above the Sept. 2018 ATH after falling back below it. That shows resilience. Sentiment also does not suggest this is a top ready to fail as I’ve discussed. However, I am concerned about the valuations of companies that won’t be able to keep growing at the currently assumed levels, so I feel investors should become pickier on individual stocks than they have before in this Bull market. Certain sectors are getting too pricey as I remarked in this week’s blog. Those stocks can go even higher, but eventually they’ll find gravity. Those who hold them should manage the risk involved in these 20% or more drops in a day that we’ve seen. Who likes putting thousands of dollars into a stock and see it drop by 20% in a day? That happens due to miss-pricing by the market.
The number one threat revealed by the behavior in the market in Dec. is the Fed being FORCED to raise rates, because of inflation as wages rise with oil prices. Wages are rising due to competition for limited numbers of skilled workers. There are plenty of jobs available to people who simply do not have the skills. The only way to hire those workers is to poach them from other companies at higher salaries. The irony of Trump et. al. being against immigration is clear in this context. He needs immigration more than ever to increase productivity (esp. workers with needed skills), and a skills based job training program would also be of benefit.
Returning to the Fed threat: If the Fed is forced to raise rates more quickly than the market likes (what I’d then call Rate Shock III), the stock market will finally have a more significant correction. We need to follow interest rates carefully! Since 3-27-19, XLF has been outperforming, which is actually a potential negative in the current context, again, depending on how rapidly rates rise. That outperformance says to me the market believes rates will continue rising. If rates rise slowly, it could be a positive. Typically financials need to do well in a solid Bull market. By watching financials and rates, we’ll likely know how the market will do in the near and intermediate term. If rates shoot up too fast, we’ll due a December deja vu, and many investors will be caught off-sides.
By the way, I wrote this without looking up what China was doing, but the script has not changed if you read what I’ve written on “China Risk” on the blog. 25% tariffs are a “blow-up scenario.” The market will correct substantially if Trump does not fix this mess quickly. You may want to tweet your opinion to @realDonaldTrump, @POTUS, and @WhiteHouse on Twitter! 😉 IMO this is not how you wind up “successful trade talks.”