A Market Timing Report based on the 06-07-2019 Close, published Saturday, June 8, 2019…
I deliver focused comments on market timing once a week. These are supplemented with daily “Tweets/StockTwits” (see links below) and comments in the “markettiming” room on StockTwits.
1. SP500 Index Market Timing (S&P 500 Index®; SPY, SPX):
I posted on StockTwits and Twitter Friday evening that President Trump signed a deal with Mexico to not impose punitive tariffs in exchange for their sending 6000 National Guard troops to their southern border, but these efforts may be delayed until 2021 in terms of full deployment as noted HERE. In addition:
“The agreement did not include a demand from the U.S. that Mexico agree to a “safe third country” designation, requiring the country to permanently accept most asylum seekers from Central America.”
Trump plans to ship the asylum seekers back out of the U.S. to Mexico to await decisions on their claims, which they had already been doing.
“The U.S. promises that those asylum applicants will be “rapidly returned” to Mexico as they await the result of their claims. Mexico agrees to accept them and offer jobs, health care and education.”
The results of this “agreement” are iffy, given the built-in delay, but perhaps we can assign a partial victory to Trump. I’m sure we’ll no longer hear about the problems at the border, since that’s now “been solved.” I wrote that last line on Friday night, and this morning I saw via a Fox news quote (I search on multiple sites, fake and otherwise ;)) that Chuck Schumer said THIS. Otherwise, if Trump keeps yapping about the Mexicans, the problem has not been solved, right?
Although Mexican responsibility is good, the more important point is the way Trump went about it should be unconstitutional if it isn’t, as using tariffs as threats to accomplish legislative goals is not the way a President should act…and the GOP leadership was starting to get riled up about that very fact including Texas Senator Ted Cruz. Having the Congress impose tariffs on Mexico to secure the borders is the way Democracy is supposed to work. Remember that Trump used the EMERGENCY Powers Act to invoke tariffs in the first place, but much of the solution won’t be fully deployed until 2021! Some “emergency.”
Importantly, the markets were spared damage that did not have to be inflicted in the first place. Trump proved he can drive the markets down and then up at will through his antics. But what’s the net result? Do these “solved Tariff problems” created by Trump mean the stock market should move higher? Investors thought so from Tuesday through Friday apparently.
The market turned around from the prolonged May decline this week. It had a very good week after dropping over 7% in just a few weeks. The second up day this week on Wednesday shifted the immediate trend from down to up as shown HERE for XLK, the SP500 Tech Sector ETF and for SPY HERE. The rally then continued Thursday and Friday.
Some of the perma-Bulls out there (remember, I’m an independent both in political and market terms!) will tell you, you were stupid to raise any cash and should hold stocks for the long term and never sell anything. Why is it that Jack Bogle who founded Vanguard warned before his death that stock market returns for the next decade would likely be half of normal or worse? Read on if you are thinking “Mexico being out of the way solves everything, so I’m back to 100% invested!”
Go to all cash? No way. I share my investment allocation to stocks regularly on social media and posted it last week. I believe investors who can afford to lose money on paper for a while should always be at least 30% invested in stocks long term That is a “raw percentage” of investable net worth (means minus your house, but not investment properties), not the percentage of usual max. exposure I share with you – I do that so you will think for yourself!
Even “old people” should have at least 30% in stocks, unless their money could run out if they take on that risk. At any time point, you must assume it will take up to 10 years to “get your money back” from a paper loss. What you NEVER want to do is SELL LOW. This is how most investors underperform the markets. You only sell low if you MUST protect your capital from further loss or “Susan won’t be able to go to college” for example.
Why 30%? Because 1. stocks make more over the long term than bonds do and 2. A 50% loss on your stocks at 30% exposure means you only lose 15% of your capital, which is not hard to come back from. If you lose 50% of your capital, you have to have a 100% return to get back to even as investors did in 2009. That is a tough climb!
You say you can get out and back in in time if you are wrong about your exit? Some of you can (less than 5% of you at best), but you are major exceptions. Most investors who leave the market sit there like deer frozen in the headlights of a car that never hits them and fail to re-invest in the market, when it turns out they sold the exact low in the market!
I promised on my stream this week, I’d share “What to do now” so you can protect yourself against a further downturn in the markets, despite the bounce. What have I done to face off the risks listed on this blog including earnings risks for Q2?
1. I lowered my stock exposure. You can take some off each time the market moves up or use stop losses to protect profits on the way down. Your choice.
2. Added REITS like AMT at the December 26th low, and re-entered Realty Income (O) more recently.
3. Bought long term munis (which have risen about 5% in just a couple months of averaging into them as rates have crashed). Rates down, bonds up (for the newbies)!
4. Increased my gold exposure by adding gold stocks (GDX, by buying outright and being assigned shares on a put sale, and did an option play on FNV recently). Buy the dips and be willing to trade your non-insurance gold positions or don’t buy any to begin with! Gold stocks are not things to ride up and down like a pony at a fair.
5. Invested cash by laddering out month by month to about 1 year in Treasuries, which is easy to do on Schwab or Fidelity among other brokers. Do it yourself, using the Treasury Yield Curve page as a guide or you’ll pay commissions. That way I can move money back into stocks to increase my exposure on a larger pullback, because Treasuries are very liquid. You may have to give up a little bit of return if you need to sell, which is why I have a chunk of cash in money markets paying 2.20%, down from 2.31% just a couple of weeks ago as rates fall. Because rates will likely fall further, it will pay to lock in some Treasuries going out a number of months, because those yields are most likely headed back below 2% for money markets.
So what’s the technical challenge for the Bulls? The Bulls now face what is know in Fibonacci terms as a Double 2 Wave UP, which can either be violated to the UPSIDE or can turn downward into a big, red 3rd wave down. (The pattern is wave one down, two waves up, and then the 3rd down wave starts…) The top of Wave 2 for X*LK is 76.54 with a high of 76.64 and a close of 76.19 and an S*PY Wave 2 top of 289.21 with a high of 288.85 and a close of 287.65. Some of the selling into the close could have been related to the perceived risk of the Mexico deal falling through, so we cannot count the Bulls out.
But IF that 3rd down wave starts, watch out, because it is the largest wave of the standard 5 wave pattern. Beyond Mexico there are many other issues facing this market, not the least of which are the upcoming Q2 earnings! After clocking in a negative Q1 for earnings, the SP500 Index is set to repeat “negative earnings growth” for Q2 as well, unless companies surprise enough to the upside to turn the numbers positive again. You’ll also note from the sequences noted below that 2020, which compares against the current slow 2019 will look better to the market.
Let’s check in with the earnings trend again…
Earnings Risk: what is shown are the projections in the FactSet 3-15-19 report followed by the reports from 4-12-19 through 6-07-19 (details HERE)…
We now have new estimates this week for Q2 2019 through Q2 of 2020. There was no update to Q1 earnings this week.
Here is the data updated for the last data point from this week:
For Q1 2019 (not updated this week), earnings growth of -3.6% -> -4.3% -> -3.9% -> -2.3% -> -0.8% -> -0.5% -> -0.5% -> -0.4% -> -0.4% .
and revenue growth of 4.9% -> 4.8% -> 5.0% -> 5.1% -> 5.2% -> 5.3% -> 5.3% -> 5.3% -> 5.3%.
For Q2 2019, analysts are projecting earnings growth of 0.1% -> -0.4% -> -0.5% -> -0.6% -> -1.3% -> -1.7% -> -1.9% -> -2.1% -> -2.1% -> -2.3%.
and revenue growth of 4.6% -> 4.2% -> 4.4% -> 4.3% -> 4.3% -> 4.3% ->4.2% -> 4.1% -> 4.1% -> 4.0%.
For Q3 2019, analysts are projecting earnings growth of 1.8% -> 1.4% -> 1.3% -> 1.3% -> 0.8% -> 0.6% ->0.5% -> 0.3% -> 0.3% -> 0.2%.
and revenue growth of 4.4% -> 4.1% -> 4.4% -> 4.4% -> 4.4% -> 4.3% -> 4.3% -> 4.2% -> 4.2% -> 4.1%.
For Q4 2019, analysts are projecting earnings growth of 8.1% -> 8.3% -> 8.2% -> 8.1% -> 7.5% -> 7.4% ->7.3% -> 7.2% -> 7.2% -> 7.0%.
and revenue growth of 4.8% -> 4.7% -> 4.7% -> 4.8% -> 4.8% -> 4.6% -> 4.7% -> 4.6% -> 4.6% -> 4.5%.
For CY 2019, analysts are projecting earnings growth of 3.8% -> 3.4% -> 3.4% -> 3.6% -> 3.4% -> 3.3% -> 3.2% -> 3.2% -> 3.2% -> 3.1%.
and revenue growth of 4.9% -> 4.6% -> 4.7% -> 4.7% -> 4.7% -> 4.7% -> 4.7% -> 4.7% -> 4.6% -> 4.5%.
For Q1 2020, analysts are projecting earnings growth of 10.5%
and revenue growth of 6.2%.
For Q2 2020, analysts are projecting earnings growth of 12.9%
and revenue growth of 6.8%.
The question you and the market may have is “Will the stock market favorably discount the re-acceleration of earnings and revenue growth in 2020 or only do so after a further correction?” The answer likely depends on how close the current estimates are to the truth and if the likely coming rate cuts by the Federal Reserve (I’ll get to that in a bit) actually help goose the economy into 2020. The honest answer by anyone given the risks stated on this blog today would be “I don’t know for sure.” If you are the eternal blind optimist, go for it! If not, find middle ground as I describe below.
But above all do NOT believe anyone can guarantee the market will be at a new daily high before it hits a new daily low. THEY DON’T KNOW! I believe the best approach is to assess the degree of risk to returns and adjust market exposure, and sector exposure to some extent, accordingly.
Factset pointed out that the earnings shortfall in Q2 for companies doing over 50% of their business abroad would be around -9.3% vs. -2.3% for all SPX companies and +1.4% for companies doing most of their business inside the US as noted HERE. Be sure to look up your companies’ earnings projections now to be ready for the next earnings season. Trim your losers on the bounce, or decide you will ride out an ugly period, your choice!
Not only are earnings due to slow more, employment did not look so great this past Friday. The low ADP report at 27K jobs was weak, but is not always a reliable predictor of the Bureau of Labor Statistics (BLS) Friday number, which was 75K, well below the 180K expected. Here is what the longer term trend looked like per the BLS on my stream HERE. The Fed will watch this for a developing trend, but it is not what will cause the Federal Reserve to cut rates this summer, as I said in that message.
Are the Bulls serious? As I asked eight weeks ago…
What would satisfy me that the Bulls were serious about this advance?
Let’s check that list once again… 3/5 Positive
1. New high. Net Positive. No new high, but the trend on an immediate basis is UP vs. down last week.
2. VIX below the “Bull Nirvana Number” AND my bonus number? No and that’s a Negative. The VIX Game Score as I call it is Bulls 3/Bears 5 (Game numbers are at the base of this report).
3. AD % Line: Positive. Now at 16,341, still above the 9-21-2018 high of 16,175 as well as the Feb. 25th high of 16,258. I said last week: “The most charitable view of that is that a bounce is due. Since a Treasury yield bounce is also due, stocks could stage a minor counter-trend rally.” In fact we got the stock market bounce and the 10 Year Yield did not bounce, but stayed above the Monday low into the Friday close.
4. Volume: Negative. Although volume was not horrific, it did decline to a lower level than the prior negative day on the 1st day of the rally (Tues.) and then declined into Friday as the market rose. That’s not what we like to see. With each larger leap in price at least, volume should participate and confirm the move.
5. The “U.S. Index Matrix Signal” as I call it: Positive. IJH and IWM were both trending up with the large caps.
Here’s a Brief Review of the Other Market Risks at Hand:
China Deal Risk: Essentially Unchanged. Trump will talk to Xi this month at the G20, June 28-29th. Xi said Trump was his friend while making deals with Putin this week. We’ve heard about his friends like North Korea’s Kim before, who went on to kill one of his negotiators and send others to hard labor camps for not delivering in negotiations with Trump. The Mexico deal is a sign that Trump will be somewhat flexible and not insist on getting everything he wants. He’ll have to make a deal prior to 25% tariffs or the 2020 Election Campaign period or else. The market sees the overall risk as lower, but it may not pan out that way. Trump likes to be unpredictable!
U.S. Iran War Risk: No heated rhetoric at the moment. Risk is low only because President “Bone Spurs” Trump hates wars. He does not even like going to them when he’s legally obligated to do so, as during the Vietnam War! My Dad went to Europe as a private not knowing his fate during World War II. But he went! Trump dishonored ALL veterans with his fake excuse from a dishonest doctor. You can see the lie right across Trump’s face in the interviews asking him direct questions about his bone spur problem, not remembering which foot the painful spur was on! 100% #FakeNews!
Mexico Tariff Risk: Gone, because Trump gave them up to get some concessions as noted above.
Mueller Report/Impeachment Risk: Moderate to High risk now. Mueller will testify one way or another. He will only recite what is in his report, but that will potentially move the public. If it’s not public, the Democrats won’t be happy. Speaker Pelosi said privately she would prefer Trump be jailed vs. impeached, which some took as meaning she would prefer to turf the whole thing to the courts after he loses in 2020. Others took it to mean she wanted a case the Senate could agree with including Republicans that would lead to a conviction. In the end, she won’t be able to withstand calls for impeachment IMO.
Key Conclusion: Without new evidence beyond the Mueller report, I do not believe the Democrats will be successful in convicting Trump in the Senate. He will of course then claim “I’m vindicated of all fake charges. I’ve been so maligned!” And he knows how to sell that and win the 2020 election, particularly if the economy is strong. If the economy is getting worse in a tangible way to the voting public by election day, there is no way he’ll win a second term.
2020 Election Risk: The tax cuts for corporations and for the wealthy but not the middle class would be at risk if any Democrat is elected. June Democrat debates are on their way with Joe Biden still the track favorite, although he’s had trouble adjusting his abortion views to the demands of the left, while still being a devout Catholic (former VP Candidate Kane also flipped as a Catholic in 2016). Let the flip-flopping begin! Biden is slipping a bit vs. the other Democrats in recent Polls. If anyone but Biden is nominated, Trump will win the election, unless the economy is awful just prior to the election. It will simply be a rerun of Nixon vs. McGovern in 1972. The leading alternatives to Biden are all to far left to stand a chance in a general election. If the Democrats as dumb now as they were then, they’ll stand on principle and allow Trump to rule for eight full years.
Deficit Threat: Moderate, but more an issue when rates are rising, not when falling. The fool Laffer who created what I call “tinkle down economics” under Reagan (a scam as Laffer and Reagan created the first multi-trillion dollar deficits and claimed that does not matter) says debt servicing is low vs. GDP. Just wait until rates rise, when the U.S. dollar is no longer the top reserve currency. That’s the prize China wants most of all – the currency crown. This is an ongoing threat to our current system, and fiscal liberal Trump and Congress seem to care less about it by their actions. Stock buybacks based on debt will be long gone by the time China’s yuan is the top currency (if nothing is done!).
Fed Rate Cut Risk: This week Powell says he’ll make sure the expansion continues. That a boy! Now you’re talkin’! That’s what the market wanted to hear. Still, how fast the Fed acts is important as I went over HERE. Now 85.2% believe the Fed will cut 25 or 50 basis points from the Fed Funds rate per CME.
Here’s the “Rate Cut Reaction Map”
1. No rate cut in June -> Market slips a bit more.
2. No rate cut in July -> Market fall accelerates
3. No rate cut in Sept -> Market crashes (so Fed won’t allow that).
4. Rate cut of 25 bp or more in June -> Rally back to prior highs or higher
5. Rate cut of 25 bp in July -> market stabilizes and may rally
6. Rate cut of 50 bp or > in July -> market rallies significantly.
7. Rate cut of 50 bp in Sept. after NO earlier cut -> market rallies from much lower level than today.
The next Fed “statement day” is just 8 market days, which now routinely comes with the TV dog and pony show by Powell.
This is the Federal Reserve FOMC meeting schedule for the rest of 2019:
June* 18-19 July 30-31 September* 17-18 October 29-30 December* 10-11. The * means the meeting comes with an economic projection update.
Now take a look at the SP500 chart. The orange lines are the 2017 up channel.
SP500 Large Cap Index (click chart to enlarge; SPX, SPY):
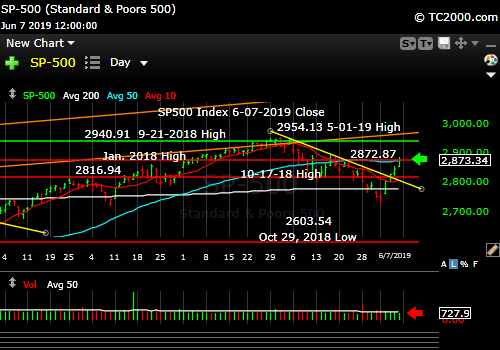
Bouncing into slowing Q2 earnings.
Now let’s check in on two “Canary Signals” we’ve been following:
“Intel-igent Market Timing Signal” (Intel; INTC): Neutral now but below the consolidation high of 45.95. It needs to rise above that number to make progress to the upside.
Bank of America (BAC) Market Timing Signal: Negative. Was down 1.26% today with the market up 1%. The only plus is that it held the March low. If things deteriorate in the economy further, rates will move still lower and drag the banks down with them.
Now let’s go on to review investor sentiment…
Keep up-to-date during the week at Twitter and StockTwits (links below) where a combined 34,011 investors are following the markets with me…
Follow Me on Twitter® Follow Me on StockTwits®.
Join the Conversation in the StockTwits “MarketTiming” Room
Survey Says!
Sentiment of individual investors (AAII.com) showed a Bull minus Bear percentage spread of -20.1% vs. -15.29 last week. This was low enough to allow for a bounce, but it’s not a major sentiment low. Nevertheless, this bounce could continue for a while as Q2 earnings reports don’t hit the fan until mid July. The Fed has to keep the rate cut ball high in the air before then.
| Bulls | Neutrals | Bears |
| 22.53% | 34.89% | 42.58% |
| Thurs. 12 am CT close to poll | ||
2. U.S. Small Caps Market Timing (IWM): In an uptrend and somewhat favored now with multinational earnings at risk, BUT they are still higher beta stocks, and have badly lagged the SP500 Index, so be careful to take profits on time if you buy them. There is still earnings risk. I prefer sticking to high quality large caps that are going to meet their earnings goals.
Russell 2000 U.S. Small Cap Index (click chart to enlarge; IWM, RUT):
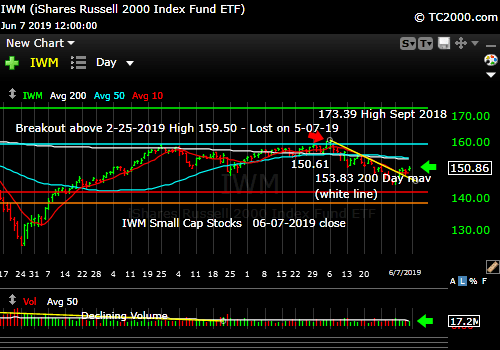
Small caps bounce, but from a big drawdown.
3. Gold Market Timing (GLD): Our gold trade is working nicely though approaching the Feb. high. As long as rates continue to fall, gold will continue to rise as the US dollar falls. That is the way the dance works. Buy pullbacks.
Now if the economy starts to re-accelerate into 2020, gold may decline, so other than your long term “gold insurance,” this trade should be seen as temporary. Preserve profits at some level on all gold trades!
The Gold ETF (click chart to enlarge the chart; GLD):
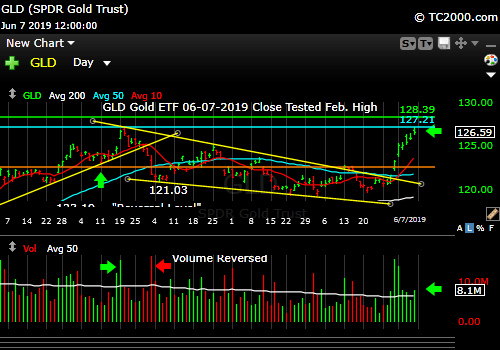
Rally is on, but GLD just tested Feb. high. Rates are stretched LOW, so gold could pull in a bit before a higher high is reached.
4. Interest Rate Market Timing – Last week I said, “The 10 Year Yield is now stretched to the downside and due for a bounce.” There was no bounce as there were still too many worries. The Mexico tariff resolution could perpetuate the market bounce we are seeing in equities, so bonds could suffer from that.
As you have seen of late, rapidly FALLING rates are disliked by the market as well. You could say we’ve had “Negative Rate Shock I” in the month of May. That shock is what has the Fed’s attention! The yield curve at both the 3 and 6 month levels vs. 10 year level has gone kaput.
Remember if the Federal Reserve lowers rates, they don’t just lower them once. If only one cut were needed, they might not even act. They will lower rates multiple times if they do so.
Long rates should continue to fall as they lower the Fed Funds rate until the market worries about the inflation that can create. The long bond trade will work until inflation re-accelerates. Then the Fed will follow the bond market back up by tightening (if they can), and Treasuries will start to generate losses. Buy longer term Treasuries on the bounces – until it stops working when inflation comes back (that will take a while!).
Check out the “Market Signal Summary” below – after you review the following chart…
U.S. 10 Year Treasury Note Yield (click chart to enlarge; TNX, IEF, TYX, TLT, TBF):

Market timing the US 10 Year Treasury Yield (TNX, TYX, TLT, IEF). Stretched to the downside now.
Now let’s review three key market timing signals together….
Do not use these signals as a trading plan. They are rough guidelines. I currently share my own moves on social media (links above).
MY MARKET SIGNAL AND TREND SUMMARY for a Further U.S. Stock Market Rally with Real GDP Growth (“Real” means above inflation):
Stock Signal RED for a further U.S. stock market rally with a Bullish SP500 Index trend. The stock signal is based on small caps, as they often lead the market down. I’m not calling the IWM Trend Bullish at this level, despite the short term uptrend/bounce. It’s tradable, yes, but as a signal, it’s not there yet. Those are different things.
Caveat: If this is the end of Wave 2 up as discussed above, the SP500 Index will not be looking Bullish next week. Watch the market’s decision on Monday (and in the futures Sunday). If the Wave 2 top is taken out, the market can retop or MORE.
The V*IX (which relates to SPX volatility; * added to symbol to throw off the webcrawlers!) closed at 16.30 vs. 18.71 last week. These are the other targets: 13.31, 14.04-14.08, 15.04, the “fulcrum” range = [15.94-15.95 to 16.09], 17.06, 17.27, and 17.89. The bonus target #8 is [12.-17-12.37]. The Bulls have 3 of 8 targets.
The ‘Bull Nirvana Target’ is our V*IX # of 2018: 13.31.” (That is target #7 for the Bulls.)
Gold Signal RED for a further U.S. stock market rally with a BULLISH Gold Trend. What gold does mostly as I’ve written HERE is follow real interest rates.
From before: “Remember GLD is being used as an indicator for the ECONOMY here.” If gold continues to rise, it means the market believes real rates will fall, which in the current context means the global economy is slowing. That would hurt U.S. stocks.
Rate Signal RED for a further stock market rally with a Bearish 10 Year Yield Trend. For Reference: “Rates usually RISE slowly in a strong recovery and the stock market rally continues, as I’ve repeated multiple times on social media as well as here. Empirically though, rates that are “lower” (than 3.11%) and are NOT rising rapidly have allowed the market to climb back above the prior all time high (ATH).” We are below that high at the moment, but the trend is UP.
I said weeks ago, “Watch the oil price too. Higher oil tends to mean higher rates.” WTI has been weak but is stabilizing a bit. It closed at 53.99 vs. 53.50 last week.
I’ll keep this here as a reminder: this is not currently an issue… “Watch the rate at which TNX climbs if the current trend reverses. If it shoots up very fast, stocks will correct.” In the Sept. 28th issue: “A rapid push higher in rates would mean trouble for stocks, as occurred in early 2018. That’s what I called ‘Rate Shock.'” The period of rising rates in early October I called #RateShockII. The risk of late has been “Negative Rate Shock I” as discussed above.
Thank you for reading. Would you please leave your comments below where it says “Leave a Reply”… or ask a question or report a typo…
Pay it forward by sending the link to MarketTiming.Blog (that link will immediately connect them to this webpage) to a relative or friend. Thanks for doing that.
Be sure to visit the website for more general investing knowledge at:
Standard Disclaimer: It’s your money and your decision as to how to invest it.
I thank Worden Brothers for the charting system I use to post these charts. If you want to know more about the charting system I use every day, contact me. It makes it much easier to follow along with me if you can see the charts and manipulate them on your own computer. It’s a great investment to have an excellent charting system.
Note: I’ve updated my criteria for the equity signal for a further U.S. stock market rally to the following: GREEN = Bullish, YELLOW = Neutral, RED = Bearish. In other words, the colors tell you whether the signal supports the stock rally or not, while the Bullish, Neutral, and Bearish designations are about the trend.
A BEARISH trend signal does not mean we should not buy. A BULLISH trend signal does not mean you cannot sell some exposure. It depends on what is going on in the economy and how oversold/overbought the market is at a given point whether the Bearish signal is to be sold or bought, sold on the next bounce, etc. and whether a Bullish signal is to be bought or if profits should be taken. A NEUTRAL trend signal does not mean the end of the Bull or Bear. It means to wait and look for possible subsequent entry points within the existing trend, Bull or Bear, but preserve capital if the entry fails. Our strong intention is to buy low and sell high. By the way, I will keep showing the prior orange “Trigger lines” in the IWM and GLD charts for now as reference points only; they have historical value for us from the post-2016 election period.
Copyright © 2019 By Wall Street Sun and Storm Report, LLC All rights reserved.
