A Market Timing Report based on the 06-14-2019 Close, published Saturday, June 15, 2019…
I deliver focused comments on market timing once a week. These are supplemented with daily “Tweets/StockTwits” (see links below) and comments in the “markettiming” room on StockTwits.
NOTE: The summer appears to be distracting investors enough to warrant a speedier read unless otherwise warranted. I’ve mainly curtailed the “risk section” to make it more succinct.
I provide quite a bit of intraweek commentary, and if you miss it, you will miss out on quite a bit of context, so please click on the social media links below and have a read… Thank you as always for being loyal readers and interacting on social media with your questions and comments!
1. SP500 Index Market Timing (S&P 500 Index®; SPY, SPX):
Where is the market as of the end of the week?
- The SP500 Index failed to scale the Wave 2 high this week (F.Y.I 5-16 high = top of Wave 2 UP wave), despite a couple of tries. That means the next wave could be the Big Red Wave 3 down (see last week’s issue; link to upper right). Close of SPX was 2886.98, below that Wave 2 Up top. The SPY’s closed just barely above target, but it’s within the margin of error so to speak, and I’ll go with SPX on this call. No, 0.05 points over for the SPY with the SPX below target is a “no go” to me. Not good enough.
- I will be adding exposure to the market if it can make it through the top of Wave 2. (see my VIX comments at the bottom of this report)
- Emerging markets (EM) appear to be rolling over in some cases. Examples are INDA and EWZ.
- The Greater China indexes (H Shares: FXI, A Shares: CAF/KBA, and Hong Kong (a “developed market”): EWH) have slipped back a notch after starting to post gains, but it appears to be in a weak holding pattern, waiting to see if the Trade War can be resolved. If this drags on and on, they will likely break to lower lows. There is no China agreement in sight, although Trump said they’ll arrive at one. It just won’t happen at the G20 at the end of June, because Xi probably won’t show up we are told by Trump, and that’s all OK of course. 😉 Not really!
- Interest Rates (10 Year Yield is what we follow most of all along with the shape of the yield curve) have stabilized at an impressive low that says the U.S. economy is definitely going to slow down.
- The Fed decision comes out on Weds. What’s in the market? Three cuts of 0.25% are in the market to occur with over a 50% probability in July, Sept, and December. No other meetings reach that 50% threshold all the way out to April 2020. Unless the stock market is down 15% or the Treasury market dives to another extreme, the Federal Reserve will probably move slowly. I laid out the consequences of not cutting rates in June through Sept or the opportunity in the market if they do cut rates last week, so please review that if you have not.
- About 30% of participants are off-sides going into the Fed meeting expecting a June cut. The Fed does not likely have enough to support a cut in June, so rates should pop a bit on Weds. and allow a buying opportunity for BOTH bonds/Treasuries AND gold (GLD/GDX) to develop on Weds. or within a few days. That would be nice!
Let’s check in with the earnings trend again…
Earnings Risk: what is shown are the projections in the FactSet 3-15-19 report followed by the reports from 4-12-19 through 6-14-19 (details HERE)…
We now have new U.S. earnings and revenue estimates this week for Q2 2019 through Q2 of 2020. Q2 earnings are reported starting in mid-July.
Here is the data updated for the last data point from this week:
For Q2 2019, analysts are projecting earnings growth of 0.1% -> -0.4% -> -0.5% -> -0.6% -> -1.3% -> -1.7% -> -1.9% -> -2.1% -> -2.1% -> -2.3% -> -2.5%.
and revenue growth of 4.6% -> 4.2% -> 4.4% -> 4.3% -> 4.3% -> 4.3% ->4.2% -> 4.1% -> 4.1% -> 4.0% -> 3.9%.
For Q3 2019, analysts are projecting earnings growth of 1.8% -> 1.4% -> 1.3% -> 1.3% -> 0.8% -> 0.6% ->0.5% -> 0.3% -> 0.3% -> 0.2% -> 0.0%.
and revenue growth of 4.4% -> 4.1% -> 4.4% -> 4.4% -> 4.4% -> 4.3% -> 4.3% -> 4.2% -> 4.2% -> 4.1% -> 4.0%.
For Q4 2019, analysts are projecting earnings growth of 8.1% -> 8.3% -> 8.2% -> 8.1% -> 7.5% -> 7.4% ->7.3% -> 7.2% -> 7.2% -> 7.0% -> 6.8%.
and revenue growth of 4.8% -> 4.7% -> 4.7% -> 4.8% -> 4.8% -> 4.6% -> 4.7% -> 4.6% -> 4.6% -> 4.5% -> 4.5%.
For CY 2019, analysts are projecting earnings growth of 3.8% -> 3.4% -> 3.4% -> 3.6% -> 3.4% -> 3.3% -> 3.2% -> 3.2% -> 3.2% -> 3.1% -> 3.0%.
and revenue growth of 4.9% -> 4.6% -> 4.7% -> 4.7% -> 4.7% -> 4.7% -> 4.7% -> 4.7% -> 4.6% -> 4.5% -> 4.5%.
For Q1 2020, analysts are projecting earnings growth of 10.5% -> 10.7%
and revenue growth of 6.2% -> 6.1%.
For Q2 2020, analysts are projecting earnings growth of 12.9% -> 13.3%
and revenue growth of 6.8% -> 6.8%.
Are the Bulls serious? As I asked nine weeks ago…
What would satisfy me that the Bulls were serious about this advance?
Let’s check that list once again… 1/5 Positive
1. New high. Negative. No new high, and failed to scale the top of Wave 2 UP. If not overcome soon, it will usher in quite a bit of downside.
2. VIX below the “Bull Nirvana Number” AND my bonus number? Positive. Not great exactly, but Bulls have a slight edge, having overtaken the “fulcrum,” so I’ll score this as a positive. The VIX Game Score as I call it is Bulls 4/Bears 4 (Game numbers are at the base of this report). That means the Bulls are below the key “fulcrum target” range, so they have an edge without the price technical view to match it yet.
3. AD % Line: Negative. Now at 16,371, above the close of 16,341 last week, and still above the 9-21-2018 high of 16,175 as well as the Feb. 25th high of 16,258, so you could argue this one, but I’m scoring it negative, because of the failure to make a new high above the 5-16 high. It confirms the inability to scale the Wave 2 high for the SPX.
4. Volume: Negative. The Bulls did not had the volume at any point in the recent 5 day rally. It was a 5 day rally with poor volume and then 4 days sideways this week.
5. The “U.S. Index Matrix Signal” as I call it: Negative. IJH and IWM fell significantly more than SPY on Friday. They usually lead to the downside.
Here’s a Brief Review of the Other Market Risks at Hand (with terse comments only where there is new information):
China Deal Risk: Meeting scheduled in three weeks, but little seems to be happening in terms of preparation per reports. See above.
U.S. Iran War Risk Higher after Japanese and Norwegian tanker attack supposedly by Iranian forces. Fortunately Trump cannot afford another big war and hates the waste of war of national resources for infrastructure and the like, as well as the killing and maiming of soldiers. There could be a message sent by air to the Iranians however (a few missiles) as early as next week.
Mueller Report/Impeachment Risk Speaker Pelosi won’t move forward until the Dem ducks are in a row. It’s a slow motion process. Trump’s people are slow-walking every request. Not only that, they are trying to turn the whole thing around to say the investigation was a conspiracy. This is hogwash. Goebbels would have been very proud of Trump and his people. Nixon was an angel in comparison to Trump. To be clear, I do not care about ANY President of our country or any party more than I care about the U.S. Constitution, the rule of law, a free press, and the truth.
2020 Election Risk Probably the biggest risk to the markets and most Americans are oblivious to this. Many just want Trump gone, but if that happens, the markets will suffer as all Dem candidates say they’ll roll back the tax cuts on all but the middle class. That means higher corporate tax rates again and lower earnings, and lower E’s mean lower P’s. The market will likely pull back at least 10-15% going into the election if the outcome is even “unclear.”
Deficit/Debt Threat This is a building threat but won’t manifest until our interest rates climb and then it will put huge pressure on the U.S. economy and suppress earnings through higher borrowing costs.
Fed Rate Cut Risk: See above and last week’s roadmap.
Now take a look at the SP500 chart. The orange lines are the 2017 up channel.
SP500 Large Cap Index (click chart to enlarge; SPX, SPY):

Time to push up and through that Wave 2 top or else!
Now let’s check in on two “Canary Signals” we’ve been following:
“Intel-igent Market Timing Signal” (Intel; INTC): Neutral signal due to mixed technical picture. Some progress, but could as easily roll over. On the positive side, while it looks like a lower high is forming (negative), INTC managed to close above the prior consolidation high of 45.95, which was “anointed” upon being tested. It needs to stay above that number to make progress to the upside.
Bank of America (BAC) Market Timing Signal: Negative. Off the prior low, but turned down from the 200 day mav, which is negative. It will rise more, however, if the Fed does not cut rates this coming Wednesday. BAC is at the top of the downward channel that started back in early 2018! Stay away!
Now let’s go on to review investor sentiment…
Keep up-to-date during the week at Twitter and StockTwits (links below) where a combined 34,011 investors are following the markets with me…
Follow Me on Twitter® Follow Me on StockTwits®.
Join the Conversation in the StockTwits “MarketTiming” Room
Survey Says!
Sentiment of individual investors (AAII.com) showed a Bull minus Bear percentage spread of -7.36% vs. -20.1%. We are at an important lower high for the SP500 Index and sentiment should be more Bullish. At this point though, I don’t think sentiment helps too much other than to say we are not at EITHER extreme to the Bull or Bear side. It means we could move either way from here. The Bulls will have to increase their buying to take us above the Wave 2 top.
| Bulls | Neutrals | Bears |
| 26.74% | 38.96% | 34.20% |
| Thurs. 12 am CT close to poll | ||
2. U.S. Small Caps Market Timing (IWM): Look at where the small caps started rolling over on Friday. They are below the 200 day mav. Weak! Stay away. If they can push above the 5-16-19 high, that would be another thing.
A failure here would auger bad things for the overall market. Small caps are 12.5% below their all time high, which means they are already in a full correction. (See my “New Rules” HERE for useful ranges in thinking about market dips, corrections, and Bear markets.)
In a healthy economy, small caps outperform tremendously, but when the economy slows, that “beta” works directly against you – the losses are far bigger.
Russell 2000 U.S. Small Cap Index (click chart to enlarge; IWM, RUT):

Rolling over from lower high, below the 200 day moving average. Weak!
3. Gold Market Timing (GLD): Gold is pulling back from a prior high reached both in February and on June 7th. This failure is due to a fear IMO (In My Opinion) that the Federal Reserve will NOT lower rates as about 30% feel they will. That means rates could RISE to some degree driving down gold and causing the US Dollar to strengthen. I’ll be waiting to buy the dip in gold/gold stocks if we are so lucky.
The Gold ETF (click chart to enlarge the chart; GLD):
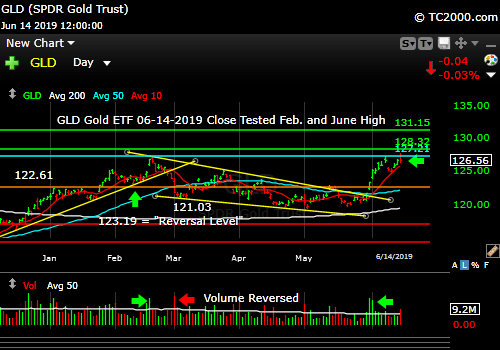
If the Fed does not cut rates next Weds. gold will fall a bit. Buy the dip IMO!
4. Interest Rate Market Timing – The 10 Year Yield lies in wait of the next Federal Reserve meeting where the Fed will likely NOT cut rates. If it is extremely dovish vs. what has been said previously, rates could continue their dive however. Just follow rates and you’ll know what to do in regard to both bonds/Treasuries and gold/gold stocks. (read the last few issues and my key gold trading post HERE if you haven’t).
Check out the “Market Signal Summary” below – after you review the following chart…
U.S. 10 Year Treasury Note Yield (click chart to enlarge; TNX, IEF, TYX, TLT, TBF):

June 19th will decide a bounce vs. no bounce in rates.
Now let’s review three key market timing signals together….
Do not use these signals as a trading plan. They are rough guidelines. I currently share my own moves on social media (links above).
MY MARKET SIGNAL AND TREND SUMMARY for a Further U.S. Stock Market Rally with Real GDP Growth (“Real” means above inflation):
Stock Signal RED for a further U.S. stock market rally with a Bullish SP500 Index trend. The stock signal is based on small caps, as they often lead the market down.
Caveat: If this is the end of Wave 2 up as discussed above, the SP500 Index will not be looking Bullish next week. If the Wave 2 top is taken out, the market can retop or MORE.
The V*IX (which relates to SPX volatility; * added to symbol to throw off the webcrawlers!) closed at 15.28 vs. 16.30 last week. These are the other targets: 13.31, 14.04-14.08, 15.04, the “fulcrum” range = [15.94-15.95 to 16.09], 17.06, 17.27, and 17.89. The bonus target #8 is [12.-17-12.37]. The Bulls have 4 of 8 targets. I consider the “fulcrum” the key decision point that turns the market from Bearish to Bullish, when the VIX falls below that entire fulcrum range. With the VIX below that target, but the SPX below the Wave 2 top, I’d say it’s a crap-shoot as to which way the market turns, but the economic picture would suggest it will fall. The weak earnings won’t come out until mid-July, so the Bulls could attempt a further rally before then. That’s the upside risk.
The ‘Bull Nirvana Target’ is our V*IX # of 2018: 13.31.” (That is target #7 for the Bulls.)
Gold Signal RED for a further U.S. stock market rally with a BULLISH Gold Trend. What gold does mostly as I’ve written HERE is follow real interest rates.
From before: “Remember GLD is being used as an indicator for the ECONOMY here.” If gold continues to rise, it means the market believes real rates will fall, which in the current context means the global economy is slowing. That would hurt U.S. stocks.
Rate Signal RED for a further stock market rally with a Bearish 10 Year Yield Trend. For Reference: “Rates usually RISE slowly in a strong recovery and the stock market rally continues, as I’ve repeated multiple times on social media as well as here. Empirically though, rates that are “lower” (than 3.11%) and are NOT rising rapidly have allowed the market to climb back above the prior all time high (ATH).”
I said weeks ago, “Watch the oil price too. Higher oil tends to mean higher rates.” WTI has been weak but is stabilizing a bit at a lower level. It closed at 52.51 vs. 53.99 last week. Oil looks like it could revisit the January low at this point. The Middle East could interfere with that outlook should the Iran situation ignite.
I’ll keep this here as a reminder: this is not currently an issue… “Watch the rate at which TNX climbs if the current trend reverses. If it shoots up very fast, stocks will correct.” In the Sept. 28th issue: “A rapid push higher in rates would mean trouble for stocks, as occurred in early 2018. That’s what I called ‘Rate Shock.'” The period of rising rates in early October I called #RateShockII. The risk lately has been the “Negative Rate Shock I” we’ve seen as discussed above.
Thank you for reading. Would you please leave your comments below where it says “Leave a Reply”… or ask a question or report a typo…
Pay it forward by sending the link to MarketTiming.Blog (that link will immediately connect them to this webpage) to a relative or friend. Thanks for doing that.
Be sure to visit the website for more general investing knowledge at:
Standard Disclaimer: It’s your money and your decision as to how to invest it.
I thank Worden Brothers for the charting system I use to post these charts. If you want to know more about the charting system I use every day, contact me. It makes it much easier to follow along with me if you can see the charts and manipulate them on your own computer. It’s a great investment to have an excellent charting system.
Note: I’ve updated my criteria for the equity signal for a further U.S. stock market rally to the following: GREEN = Bullish, YELLOW = Neutral, RED = Bearish. In other words, the colors tell you whether the signal supports the stock rally or not, while the Bullish, Neutral, and Bearish designations are about the trend.
A BEARISH trend signal does not mean we should not buy. A BULLISH trend signal does not mean you cannot sell some exposure. It depends on what is going on in the economy and how oversold/overbought the market is at a given point whether the Bearish signal is to be sold or bought, sold on the next bounce, etc. and whether a Bullish signal is to be bought or if profits should be taken. A NEUTRAL trend signal does not mean the end of the Bull or Bear. It means to wait and look for possible subsequent entry points within the existing trend, Bull or Bear, but preserve capital if the entry fails. Our strong intention is to buy low and sell high. By the way, I will keep showing the prior orange “Trigger lines” in the IWM and GLD charts for now as reference points only; they have historical value for us from the post-2016 election period.
Copyright © 2019 By Wall Street Sun and Storm Report, LLC All rights reserved.
