A Market Timing Report based on the 07-12-2019 Close, published Saturday, July 13th, 2019…
I deliver focused comments on market timing once a week. These are supplemented with daily “Tweets/StockTwits” (see links below) and comments in the “markettiming” room on StockTwits.
I provide quite a bit of intraweek commentary, and if you don’t see it, you will miss out on quite a bit of context, so please click on the social media links below and have a read… Thank you as always for being loyal readers and interacting on social media with your questions and comments!
1. SP500 Index Market Timing (S&P 500 Index®; SPY, SPX):
Earnings start to flood in this week, starting with Citibank on Monday the 15th, and on the 16th with JPM, WFC, GS, etc. In the meantime, large caps just rose to brand new all time highs (ATHs).
WARNING: Twitter is running its system in an autocratic and impersonal way, most likely AI driven, that can lead to sudden shutdowns based on false AI signals. The President is right in my view about potential bias in their algorithms – and that’s coming from a diehard political independent who listens for solutions rather than “sides.” Currently, any social media platform may lock your account and then not tell you when they will reinstate access. I have already contacted my Florida legislators to encourage them to legislate a solution to this problem. They have not properly self-regulated. Please join the StockTwits list as well as the Twitter list (links below) to be sure to get my messages on an ongoing basis. Systems fail at times and these random suspensions require a backup system for sure.
Keep up-to-date during the week at Twitter and StockTwits (links below) where a combined 34,055 investors are following the markets with me…
Follow Me on Twitter® Follow Me on StockTwits®.
Join the Conversation in the StockTwits “MarketTiming” Room
Are the Bulls serious?
What would satisfy me that the Bulls are serious about this advance?
Let’s check the list once again… The Score this week? Bull 2.5/Bears 2.5. Neutral Score at new highs! Last week it was Bulls 3/Bears 2. That makes me suspicious of this breakout, but time will tell. For each checklist item below, I give you the points scored as Bullish or Bearish.
1. New high. Bulls 1 point. Based on large caps only however. More below!
2. VIX below the “Bull Nirvana Number” AND my bonus number? Bulls 0.5 point. Why? Because the VIX Game Score based on my 8 point system (see base of this report for the numbers) is Bulls 7/Bears 1, the same as last week with a VIX close on Friday of 12.39, just above point #8 for the Bulls.
3. AD % Line (proprietary stat; see base of report about this): Bulls 1 point. New closing high. The close was 16, 577 vs, 16,571 last Friday. The 6-20-19 high at a peak in SPX was 16,517. The ATH was achieved on Weds. at 16,599.
4. Volume: Bears 1 point. Tuesday was the first close over the prior high of June 21st after a retracement test of that initial breakout level. Volume for the next three days above the breakout was weak. The Bears win this point.
5. The “U.S. Index Matrix Signal” as I call it: Bears 1 point. The small caps are back BELOW the 6-20 high, so this is a clear Bear point. The midcaps are doing a bit better, but still below the 4-24-19 S&P Midcap high of 1984.73.
Let’s check in on the context around the price action of the market by looking at the current RISKS…
Earnings Risk: what is shown are the projections in the FactSet 3-15-19 report followed by the reports from 4-12-19 through 7-12-19 (details HERE)…
There is a catch of course with earnings estimates, as I was considering privately last week. The predicted earnings are only slightly negative at -3% now. Companies often try to undershoot earnings in order to “positively surprise,” so FactSet now expects, based on the past 5 year average, a surprise increase in SPX earnings of 3.7%, the earnings growth corrected for the surprise would be a POSITIVE 0.7% per their math, meaning earnings could be marginally positive for Q2 once reported. The data refers to Year over Year growth/decline.
For Q2 2019, analysts are projecting earnings growth of 0.1% -> -0.4% -> -0.5% -> -0.6% -> -1.3% -> -1.7% -> -1.9% -> -2.1% -> -2.1% -> -2.3% -> -2.5% -> -2.6% -> -2.6% -> -2.6% -> -3.0%.
and revenue growth of 4.6% -> 4.2% -> 4.4% -> 4.3% -> 4.3% -> 4.3% ->4.2% -> 4.1% -> 4.1% -> 4.0% -> 3.9% -> 3.9% -> 3.8% -> 3.8% -> 3.7%.
For Q3 2019, analysts are projecting earnings growth of 1.8% -> 1.4% -> 1.3% -> 1.3% -> 0.8% -> 0.6% ->0.5% -> 0.3% -> 0.3% -> 0.2% -> 0.0% -> -0.3% -> -0.5% -0.5% -> -0.8%
and revenue growth of 4.4% -> 4.1% -> 4.4% -> 4.4% -> 4.4% -> 4.3% -> 4.3% -> 4.2% -> 4.2% -> 4.1% -> 4.0% -> 4.0% -> 3.8% -> 3.8% -> 3.3%.
For Q4 2019, analysts are projecting earnings growth of 8.1% -> 8.3% -> 8.2% -> 8.1% -> 7.5% -> 7.4% ->7.3% -> 7.2% -> 7.2% -> 7.0% -> 6.8% -> 6.7% -> 6.3% -> 6.3% -> 6.0%,
and revenue growth of 4.8% -> 4.7% -> 4.7% -> 4.8% -> 4.8% -> 4.6% -> 4.7% -> 4.6% -> 4.6% -> 4.5% -> 4.5% -> 4.5% -> 4.3% -> 4.3% -> 4.2%.
For CY 2019, analysts are projecting earnings growth of 3.8% -> 3.4% -> 3.4% -> 3.6% -> 3.4% -> 3.3% -> 3.2% -> 3.2% -> 3.2% -> 3.1% -> 3.0% -> 2.8% -> 2.7% -> 2.6% -> 2.4%.
and revenue growth of 4.9% -> 4.6% -> 4.7% -> 4.7% -> 4.7% -> 4.7% -> 4.7% -> 4.7% -> 4.6% -> 4.5% -> 4.5% -> 4.5% -> 4.4% -> 4.3%.
For Q1 2020, analysts are projecting earnings growth of 10.5% -> 10.7% -> 10.3 -> 9.9% -> 9.8%.
and revenue growth of 6.2% -> 6.1% -> 6.0% -> 5.8% -> 5.8%.
For Q2 2020, analysts are projecting earnings growth of 12.9% -> 13.3% -> 13.3% -> 12.9% -> 13.2% -> 13.5%.
and revenue growth of 6.8% -> 6.8% -> 6.8% -> 6.6% -> 6.6% -> 6.6%.
Here’s a Brief Review of the Other Market Risks at Hand:
China Deal Risk: No important change. Negotiation is happening we are told. Meanwhile our markets head higher despite it all.
U.S. Iran War Risk: No important change. Trump supporters believe he is going to achieve peace with the terrorist leaders of Iran. That would be nice. An Iranian vessel was seized by the UK for violating the ban on oil shipments to Syria. They are talking about this incident without further actions from Iran. Maybe President Trump has them reconsidering their next hostile move.
Mueller Report/Impeachment Risk: No important change but “Mueller Time” [WAS] THIS WEEK on Wednesday, July 17th [and is NOW delayed 1 week to July 24th (as of 7-15-19). Mark your calendar for market risk on that day. Just by repeating certain conclusions, he could influence public opinion against Trump. That’s what the Democrats hope.
2020 Election Risk: No important change. Probably the biggest risk to the markets and most Americans are oblivious to this from the markets’ point of view. I’ll stand by this: “The market will likely pull back at least 10-15% going into the election if the outcome is even unclear, meaning President Trump is NOT ahead by a wide margin (a likelihood, but not a certainty, depending on whether the Dems go for a “McGovern” candidate, as in Nixon-McGovern in 1972, a Democrat disaster.”
Deficit/Debt Threat: No important change. Chair Powell discussed the debt as an issue that will tap out our system in the future. It could be crippling to be paying more on our debt than we do on defense! This has been building in the background, dollar by dollar – by BOTH irresponsible political parties. This is a threat but won’t manifest until our interest rates climb and then it will put huge pressure on the U.S. economy and suppress corporate earnings through higher borrowing costs. Per the NY Times: “Within a decade, more than $900 billion in interest payments will be due annually, easily outpacing spending on myriad other programs.” The 2018 defense budget was $800 B. Medicare? $582 B. Think about that!
Fed Rate Cut Risk: No important change. We are back to a 0.25% cut for July. Without the 0.25% cut, the Fed’s credibility would likely be hurt, so they’ll do it unless GDP is overly strong vs. their long term view of the economy. GDP will be reported on July 26th prior to the Federal Reserve FOMC meeting. Mark that date on your calendar too!
From last week: “In my view, many investors are in LalaLand when it comes to rate cuts. CME Group says 22.5% vs. 28.1% last week prior to Powell’s testimony this week believe the Federal Reserve will cut 0.50% in July. The rest expect a cut of 0.25%.
As said last week, “No cut [in July] would cause the market to dive. A cut of just 0.25% could disappoint the market as well, although the majority would be fine as they expect that cut.” The majority are still looking for July, Sept. and Dec. cuts per CME. Only the minority expect other cuts thru April 2020.
As I said three weeks ago, the Fed members actually don’t believe three cuts are going to be needed, as summarized HERE.
Now take a look at the SP500 chart. See how it’s rising in the up channel from 2017? The orange lines are the 2017 up channel. There’s plenty of room to the upside, if the Bulls want to bid up large caps further!
SP500 Large Cap Index CLOSE (click chart to enlarge; SPX, SPY):

New highs unconfirmed by small caps.
Now let’s check in on two “Canary Signals” we’ve been following:
“Intel-igent Market Timing Signal” (Intel; INTC): Positive. Striking, because a breakout occurred even without a China resolution. Volume was not great but that’s true for the entire market breakout. Earnings are coming on July 25th (estimated date, so says Prof. Google).
Bank of America (BAC) Market Timing Signal: Neutral. No change from last week. “This could be a head and shoulders formation (with subsequent failure to make a new high) unless rates keep climbing.”
Now let’s go on to review investor sentiment…
Survey Says!
Sentiment of individual investors (AAII.com) showed a Bull minus Bear percentage spread of just +6.1 vs. -0.81% the prior week. That’s still not very Bullish at all.
I said last week: “At the same time, we have not likely seen the ultimate top of this Bull market, at least for the large caps, because sentiment is just not positive enough.” That was right…AGAIN…the market kept moving up.
| Bulls | Neutrals | Bears |
| 33.61% | 38.89% | 27.50% |
| Thurs. 12 am CT close to poll | ||
2. U.S. Small Caps Market Timing (IWM): Discussed above, but I’ll add that the tops shown in the chart below are the LOWER highs in place. Look at a longer term chart to see the prior ATH of 173.39. The current target for the Bulls is that 156.22 number. The failure there with large caps at new highs is a negative. See the chart below…
Russell 2000 U.S. Small Cap Index (click chart to enlarge; IWM, RUT):

Not good enough!
3. Gold Market Timing (GLD): Still a Bull. If rates move up more by a significant amount, gold/gold stocks will not like it.
The Gold ETF (click chart to enlarge the chart; GLD):
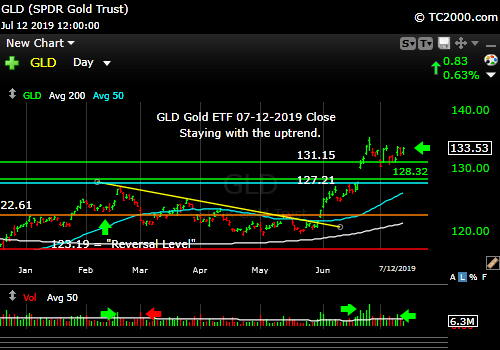
Still a Bull.
4. Interest Rate Market Timing: Rates have bounced…for now. Gold, gold stocks, and bonds have fallen. There could be more downside in this dip. I will buy the dips for now. I did on Friday (see above). You can buy in stages.
Check out the “Market Signal Summary” below – after you review the following chart…
U.S. 10 Year Treasury Note Yield (click chart to enlarge; TNX, IEF, TYX, TLT, TBF):

Buy the dips in bonds/Treasuries (rips in rates).
Now let’s review three key market timing signals together….
Do not use these signals as a trading plan. They are rough guidelines. I currently share my own moves on social media (links above).
Parenthetically: As my long term followers realize, my main focus here is getting the major US stock market indexes right, as much as possible, (SPX, IWM) as well as gold (GLD) and interest rates (TNX using IEF, TLT, IIM -currently I own IIM and TLT and one other leveraged muni fund I would not recommend at this time), as well as individual munis bought long ago when rates were 4.5 to 5%. Why use IIM of late vs. individual munis, which I also own? I am not going to ever spend the time needed to evaluate lower quality munis, and I don’t buy high quality munis with returns as low as they are now.
In the realm of equity index exposure, I hold some IJH and other midcap exposure now (less, comparatively at the moment, due to the part of the cycle we’re in – late), but do not publish my reviews of the charts. As it is, these posts take many hours to compile, so I must of course draw the line somewhere. The same goes for international markets. I have often shared my buys/sells on social media, but I don’t publish my research work other than what is presented there. I have very little small cap exposure, mainly through individual speculative stocks.
In regard to stock picks, in my view, if someone does not have both a detailed fundamental analytical perspective AND a technical opinion on a stock, I cannot place high value on their opinion. That is not to say big money cannot be made trading technically without any understanding of what a company does besides “they do cloud stuff and their earnings and revenues are growing.”
Unfortunately, the majority of the messaging on social media is at that level. If you asked many investors about cloud companies in detail about the companies’ products, they would not have a clue. If you do “have a clue,” great. “Go there.” Otherwise, you had better have a very proven and reliable sources, watch the charts, and watch your position sizes.
I do share certain individual stocks, as I have Apple, Microsoft, and Disney as examples, based on my own big picture view of the stocks and an analysis of the fundamentals. Again, I am not an individual stock analyst as my major focus, and you should do your own homework on any individual stocks I recommend, regardless of the big picture I may share. Some picks may be based in part on data from various sources I use, but for the big plays in dollar terms, I arrive at my conclusions independently. I never depend on anyone else’s opinion where there is a bigger position involved.
In regard to the three stocks I mentioned specifically, I consider only Disney (DIS) to be a buy on pullbacks now – at least not without a good sized pullback for the other two. I do not own Apple (AAPL) and would not recommend it currently, as they face too much China headwind and have decided they won’t share their unit sales for iPhone. I find that close to dishonesty – maybe it would be kinder to call it “a lack of openness.” I cannot own a stock when communications by the company are not open and honest. Microsoft (MSFT) is still growing earnings and revenues, and I have exposure to it in one of my accounts, but I don’t consider it cheap. It is too far ahead of the market at the current time to hold an out-sized position. Owning some seems reasonable, and I do.
MY MARKET SIGNAL AND TREND SUMMARY for a Further U.S. Stock Market Rally with Real GDP Growth (“Real” means above inflation):
Stock Signal NEUTRAL for a further U.S. stock market rally with a Bullish SP500 Index trend. The stock signal is based on small caps, as they often lead the market down. The lack of progress small caps made (noted above) keeps me at neutral.
The V*IX (which relates to SPX volatility; * added to symbol to throw off the webcrawlers!) See above for the close this week and other comments. These are the targets: 13.31, 14.04-14.08, 15.04, the “fulcrum” range = [15.94-15.95 to 16.09], 17.06, 17.27, and 17.89. The bonus target #8 is [12.-17-12.37]. The Bulls have 7 of 8 targets this week at a 12.39 VIX close. I consider the “fulcrum” the key decision point that turns the market from Bearish to Bullish, when the VIX falls below that entire fulcrum range.
The ‘Bull Nirvana Target’ is our V*IX # of 2018: 13.31.” (That is target #7 for the Bulls.)
Gold Signal RED for a further U.S. stock market rally with a BULLISH Gold Trend. What gold does mostly as I’ve written HERE is follow real interest rates.
From before: “Remember GLD is being used as an indicator for the ECONOMY here.” If gold continues to rise, it means the market believes real rates will fall, which in the current context means the global economy is slowing. That will ultimately hurt U.S. stocks.
Rate Signal RED for a further stock market rally with a Bearish 10 Year Yield Trend. For Reference: “Rates usually RISE slowly in a strong recovery and the stock market rally continues as they rise, as I’ve repeated multiple times on social media and here. Empirically though, rates that are “lower” (than 3.11%) and are NOT rising rapidly have allowed the market to climb back above the prior all time high (ATH).” Rates are bouncing in a downtrend until proven otherwise.
I said weeks ago, “Watch the oil price too. Higher oil tends to mean higher rates.” WTI had bounced, but has started weakening again. It closed at 60.21 vs. 57.51 last week and still looks like it could be rolling over. There a a lower high below both 50 and 200 day mav’s. If that lower high is exceeded, expect a further rally.
For Two Weeks Now: If the bounce in TNX continues too quickly and too high, this will give rise to Rate Shock III… As said before: “Watch the rate at which TNX climbs if the current trend reverses. If it shoots up very fast, stocks will correct.” In the Sept. 28th issue: “A rapid push higher in rates would mean trouble for stocks, as occurred in early 2018. That’s what I called ‘Rate Shock.'” The period of rising rates in early October I called #RateShockII. The risk lately has been the “Negative Rate Shock I” we saw in May.
Thank you for reading. Would you please leave your comments below where it says “Leave a Reply”… or ask a question or report a typo…
Pay it forward by sending the link to MarketTiming.Blog (that link will immediately connect them to this webpage) to a relative or friend. Thanks for doing that.
Be sure to visit the website for more general investing knowledge at:
Standard Disclaimer: It’s your money and your decision as to how to invest it.
I thank Worden Brothers for the charting system I use to post these charts. If you want to know more about the charting system I use every day, contact me. It makes it much easier to follow along with me if you can see the charts and manipulate them on your own computer. It’s a great investment to have an excellent charting system.
Note: I’ve updated my criteria for the equity signal for a further U.S. stock market rally to the following: GREEN = Bullish, YELLOW = Neutral, RED = Bearish. In other words, the colors tell you whether the signal supports the stock rally or not, while the Bullish, Neutral, and Bearish designations are about the trend.
A BEARISH trend signal does not mean we should not buy. A BULLISH trend signal does not mean you cannot sell some exposure. It depends on what is going on in the economy and how oversold/overbought the market is at a given point whether the Bearish signal is to be sold or bought, sold on the next bounce, etc. and whether a Bullish signal is to be bought or if profits should be taken. A NEUTRAL trend signal does not mean the end of the Bull or Bear. It means to wait and look for possible subsequent entry points within the existing trend, Bull or Bear, but preserve capital if the entry fails. Our strong intention is to buy low and sell high. By the way, I will keep showing the prior orange “Trigger lines” in the IWM and GLD charts for now as reference points only; they have historical value for us from the post-2016 election period.
Copyright © 2019 By Wall Street Sun and Storm Report, LLC All rights reserved.
