A Market Timing Report based on the 07-19-2019 Close, published Saturday, July 20th, 2019…
I deliver focused comments on market timing once a week. These are supplemented with daily “Tweets/StockTwits” (see links below) and comments in the “markettiming” room on StockTwits.
I provide quite a bit of intraweek commentary, and if you don’t see it, you will miss out on quite a bit of context, so please click on the social media links below and have a read… Thank you as always for being loyal readers and interacting on social media with your questions and comments!
1. SP500 Index Market Timing (S&P 500 Index®; SPY, SPX):
Earnings reports started to pour in this week, and yet the markets were down across the board. Yes, that means large, mid and small caps.
Microsoft reported on Thursday, and although it beat on both earnings and revenues, the stock was distributed. What’s that mean? There were lots of buyers, but also lots of sellers, which is something that can happen at a market top. Since Microsoft (MSFT) is leading the market, this market may be about to move into a correction of 5-15% as I’ve defined it (about 1/3 of the way down) under my New Rules. Let’s next check my “Bull Market Health Score”…
Are the Bulls serious?
What would satisfy me that the Bulls are serious about this advance?
Let’s check the list once again… The Score this week? Bulls 0.5/Bears 4.5. Bearish Score at new highs! Last week it was Bulls 2.5/Bears 2.5. For each checklist item below, I give you the points scored as Bullish or Bearish.
1. New high. Bulls 0.5 point. There was a new high on Monday, but the close was negative for the week. Only if SPX falls below both of the 2018 and 2019 highs, will I move to a full Bear point, but the SP500 did come off the top of a big channel (shown via yellow lines on SPY chart below). SPX closed below the 7-3 high, which is negative, as that was the last breakout target. The score for the Bulls of 1/2 point is based on large caps only however. More on that below!
2. VIX below the “Bull Nirvana Number” AND my bonus number? Bears 1. Why? Because the VIX Game Score has moved to Bulls 5/Bears 3, which is a backup. The lowest close we’ve seen was 12.39, just 0.02 points above the TOP end of my 8th Bull VIX Target. Not good enough. Still, we are still below my “fulcrum” number (explained at base of report).
3. AD % Line (proprietary stat; see base of report about this): Bears 1 point. The close was 16.511 vs. 16, 577 last Friday. The 6-20-19 high at a peak in SPX was 16,517, so this close was below there. Negative. Next Bear target is 16,471.
4. Volume: Bears 1 point. Volume went UP on Friday when price went DOWN. Bearish.
5. The “U.S. Index Matrix Signal” as I call it: Bears 1 point. The small caps and midcaps have both rolled over from lower highs. Bearish.
Why might this lead to a full correction at a minimum if not a Mini Bear market? First, I favor a correction as being more probable, because even Bearish economic forecasters I follow don’t see a recession coming, just an earnings and GDP slowing. This move down is likely, for this reason, to look like the 2015 and 2016 corrections of 12.55% and 15.21% from the 2015 top, respectively. Technically, anything over a 15% correction would be a Mini Bear, but it’s too little to quibble about. An impeachment could cause more damage as I cover below. I don’t consider it likely at this point.
Let’s check in on the context around the price action of the market by looking at the current RISKS…
Earnings Risk: what is shown are the projections in the FactSet 3-15-19 report followed by the reports from 4-12-19 through 7-19-19 (details HERE)… The last numbers for Q2 are numbers for the current reported earnings from 16% of SP500 Index companies to date. The arrows “—>” indicate 3 weeks of of omitted data in order to compress the data.
For Q2 2019, analysts are projecting earnings growth of 0.1% —> -1.3% —> -2.1% —> -2.6% -> -2.6% -> -3.0% -> -1.9%
and revenue growth of 4.6% -> 4.2% -> 4.4% -> 4.3% -> 4.3% -> 4.3% ->4.2% -> 4.1% -> 4.1% -> 4.0% -> 3.9% -> 3.9% -> 3.8% -> 3.8% -> 3.7% -> 3.8%
For Q3 2019, analysts are projecting earnings growth of 1.8% —> 0.8% —> 0.3% —> -0.5% -0.5% -> -0.8% -> -1.4%
and revenue growth of 4.4% —> 4.4% —> 4.2% —> 3.8% -> 3.8% -> 3.3% -> 3.2%
For Q4 2019, analysts are projecting earnings growth of 8.1% —> 7.5% —> 7.2% —> 6.3% -> 6.3% -> 6.0% -> 5.4%
and revenue growth of 4.8% —> 4.8% —> 4.6% —> 4.3% -> 4.3% -> 4.2% -> 4.0%
For CY 2019, analysts are projecting earnings growth of 3.4% —> 3.2% —> 2.7% -> 2.6% -> 2.4% -> 2.3%
and revenue growth of 4.7% —> 4.7% —> 4.5% -> 4.4% -> 4.3% -> 4.4%
For Q1 2020, analysts are projecting earnings growth of 10.5% -> 10.7% -> 10.3 -> 9.9% -> 9.8% -> 9.5%
and revenue growth of 6.2% -> 6.1% -> 6.0% -> 5.8% -> 5.8% -> 5.9%
For Q2 2020, analysts are projecting earnings growth of 13.3% -> 13.3% -> 12.9% -> 13.2% -> 13.5% -> 12.0%
and revenue growth of 6.8% -> 6.8% -> 6.6% -> 6.6% -> 6.6% -> 6.7%
Here’s a Brief Review of the Other Market Risks at Hand:
China Deal Risk: No important change. Trump likes to keep saying “Mnuchin just called XYZ in China,” but the impact on the market of those statements has fallen to near zero. The market wants a deal now, not promises of one.
U.S. Iran War Risk: Less stable. A British flagged oil tanker with Swedish ownership was seized by Iran. They are talking apparently.“Our priority continues to be to find a way to de-escalate the situation,” British Foreign Secretary Jeremy Hunt said per BBC. Prior to that, an Iranian vessel was seized by the UK for violating the ban on oil shipments to Syria.
Mueller Report/Impeachment Risk: No important change but “Mueller Time” is July 24th, having been delayed one week. Mark your calendar for market risk on that day. Let’s hope one day the screaming on CNN, Fox News, and MSNBC can end one day. Don’t hold your breath too long though! The best they can hope for in my view is Mueller makes it clear that Congress has enough to push forward with their own investigation. He is NOT going to state any new conclusions. He has said very clearly, it’s Congress’ job to impeach the President if they so choose, because DOJ rules do not allow him to charge a sitting President with a crime. When Trump leaves office SDNY could go after the President, which gives him plenty of incentive to remain in office and allow the statue of limitations clock to run out.
Remember also that the Clinton Impeachment drawdown created a Mini Bear market from which there was a fairly rapid recovery even before his Senate trial. It was a big buying opportunity in one of the biggest Bull markets of all time. If the Mueller testimony goes South on Weds. there could be trouble, but I doubt he’ll give the Democrats too much help beyond his report as I’ve said.
When did the SP500 Index peak in 1998 when Bill Clinton was headed to his impeachment? July 17th. This year? On July 15th the all time high (ATH) of SPX was set at 3017.80. We cannot count out the Bulls quite yet, but the challenge level has risen.
Tangent on Ethics: One other thing… In regard to Trump’s involvement in violating campaign finance laws as investigated by the FBI/SDNY, the FBI determined he was very likely involved in the calls per the phone logs when the Trump Organization payments to porn star Stormy Daniels were being set up by negotiations involving Trump, Hope Hicks, Cohen, the National Enquirer, and the lawyer for Daniels (Clifford is her real name).
Why were she and Trump not charged? One less biased prosecutor I heard said it’s likely due to the inability to prove intent. If she did not know the laws, oddly enough, the law says you cannot convict her of violating the campaign finance laws. Funny isn’t it? They don’t seem to allow that out for robbing a bank. “Oh, I thought I was just taking money from the bank that I would return later!” 😉
At any rate, this proves Trump very likely broke the law with what I’d guess is about a 99.99% probability despite the absence of wire taps. Remember that. In addition, he has lawyers all around him to ask about the law, and he still broke it. Put 2 and 2 together. I would guess he did have intent, whether the FBI can prove it or not. Yes, I do care that we have a President that follows the law.
END of Tangent on Ethics!
More risks…
2020 Election Risk: No important change. Probably the biggest risk to the markets and most Americans are oblivious to this from the markets’ point of view. I’ll stand by this: “The market will likely pull back at least 10-15% going into the election if the outcome is even unclear, meaning President Trump is NOT ahead by a wide margin (a likelihood, but not a certainty, depending on whether the Dems go for a “McGovern” candidate, as in Nixon-McGovern in 1972, a Democrat disaster.”
Deficit/Debt Threat: No important change. They all see the problem and do nothing about it. They just keep spending. As mentioned last week: Per the NY Times: “Within a decade, more than $900 billion in interest payments will be due annually, easily outpacing spending on myriad other programs.” The 2018 defense budget was $800 B. Medicare? $582 B. Think about that! Trump and the GOP may be spending dollars meant for your future Medicare and Social Security today.
Fed Rate Cut Risk: No important change. We are back to a 0.25% cut for July.
As said two weeks ago, “No cut [in July] would cause the market to dive. A cut of just 0.25% could disappoint the market as well, although the majority would be fine as they expect that cut.” The majority are still looking for July, Sept. and Dec. cuts per CME Group. Only the minority expect other cuts thru April 2020.
As I said four weeks ago, the Fed members actually don’t believe three cuts are going to be needed, as summarized HERE.
GDP Risk: This could help the Bulls via more Fed rate cuts, but eventually it will backfire should we slip into a recession. Not in the near term, but eventually. GDP will be reported on July 26th prior to the Federal Reserve FOMC meeting.
Now take a look at the SP500 chart. The first is the SPY chart showing the long term upward channel. Note that the lower line of the channel ignores the out-sized volatility in December. Ignore it for now. It does not really matter as we’re most focused on the top channel line….
SP500 Large Cap Index CLOSE (click chart to enlarge; SPX, SPY):

Note the up channel (yellow lines).
And now the SP500 Index as the SPX:
NOTE: It’s the 7-19-2019 Close NOT the 7-12-2019 Close despite the label…

Coming off a top?
Now let’s check in on two “Canary Signals” we’ve been following:
“Intel-igent Market Timing Signal” (Intel; INTC): Positive, but pausing before rising above the Dec. 3, 2018 high, a level reached just before the market FELL in a big way. Earnings out July 25th.
Bank of America (BAC) Market Timing Signal: Neutral. No change from last week. “This could be a head and shoulders formation (with subsequent failure to make a new high) unless rates keep climbing.”
Rates have been in a holding pattern since June 17th, but one would think that if the Fed is lowering rates 3 times, TNX will fall further and drag down the banks or at least keep them from going very far. Earnings for BAC were out this week and there has been no breakout response thus far.
Keep up-to-date during the week at Twitter and StockTwits (links below) where a combined 34,055 investors are following the markets with me…
Follow Me on Twitter® Follow Me on StockTwits®.
Join the Conversation in the StockTwits “MarketTiming” Room
Now let’s go on to review investor sentiment…
Survey Says!
Sentiment of individual investors (AAII.com) showed a Bull minus Bear percentage spread of just +7.29% vs. +6.1 the prior week. That’s still not that Bullish. Recent tops have been 20ish, which themselves are not that extreme.
As I’ve said: “At the same time, we have not likely seen the ultimate top of this Bull market, at least for the large caps, because sentiment is just not positive enough.” Sentiment is not high enough to say that this move up is finished. This conflicts with the idea that we’re moving into a correction already, even if we only see one more marginal new ATH.
| Bulls | Neutrals | Bears |
| 35.93% | 35.43% | 28.64% |
| Thurs. 12 am CT close to poll | ||
2. U.S. Small Caps Market Timing (IWM): Discussed above. Look at the breakdown in the chart…
Russell 2000 U.S. Small Cap Index (click chart to enlarge; IWM, RUT):
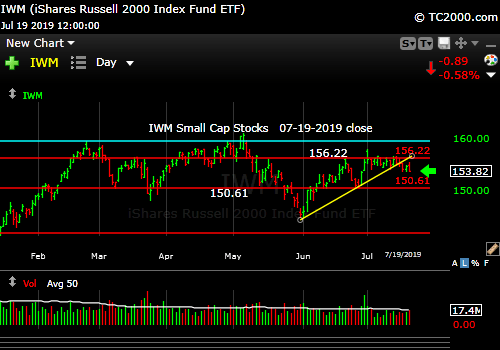
Small caps rolling over again?
3. Gold Market Timing (GLD): Still a Bull despite being overbought short term, which is why it pulled back a bit. I gave advice to a follower on StockTwits on how to trade around this IF you choose to: HERE.
The Gold ETF (click chart to enlarge the chart; GLD):

Still a Bull, just stretched.
4. Interest Rate Market Timing: The rate bounce was weak. If the Federal Reserve is in fact lowering rates 3 times, there should be more profits ahead in TLT, gold, and gold stocks. The market is still about 40% UNconvinced that there will be three rate cuts in 2019.
Check out the “Market Signal Summary” below – after you review the following chart…
U.S. 10 Year Treasury Note Yield (click chart to enlarge; TNX, IEF, TYX, TLT, TBF):
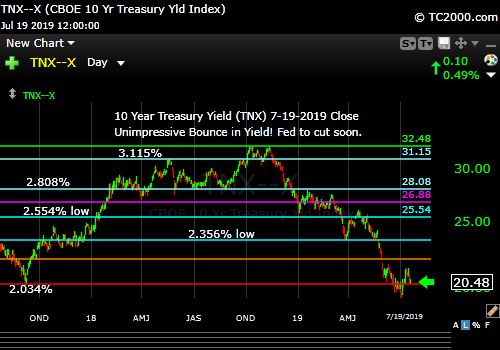
Weak bounce. More downside for rates, upside for Treasuries.
Now let’s review three key market timing signals together….
Do not use these signals as a trading plan. They are rough guidelines. I currently share my BUYS and SELLS in as timely a way as possible (close to real time as much as possible) on social media (links above).
MY MARKET SIGNAL AND TREND SUMMARY for a Further U.S. Stock Market Rally with Real GDP Growth (“Real” means above inflation):
Stock Signal NEUTRAL for a further U.S. stock market rally with a Bullish SP500 Index trend. The stock signal is based on small caps, as they often lead the market down. The weakness of small caps keeps me at neutral.
The V*IX (which relates to SPX volatility; * added to symbol to throw off the webcrawlers!) See above for the close this week and other comments. These are the targets: 13.31, 14.04-14.08, 15.04, the “fulcrum” range = [15.94-15.95 to 16.09], 17.06, 17.27, and 17.89. The bonus target #8 is [12.-17-12.37]. The Bulls have 5 of 8 targets this week at a 14.45 VIX close. I consider the “fulcrum” the key decision point that turns the market from Bearish to Bullish, when the VIX falls below that entire fulcrum range.
The ‘Bull Nirvana Target’ is our V*IX # of 2018: 13.31.” (That is target #7 for the Bulls.)
Gold Signal RED for a further U.S. stock market rally with a BULLISH Gold Trend. What gold does mostly as I’ve written HERE is follow real interest rates.
From before: “Remember GLD is being used as an indicator for the ECONOMY here.” If gold continues to rise, it means the market believes real rates will fall, which in the current context means the global economy is slowing. That will ultimately hurt U.S. stocks.
Rate Signal RED for a further stock market rally with a Bearish 10 Year Yield Trend. For Reference: “Rates usually RISE slowly in a strong recovery and the stock market rally continues as they rise, as I’ve repeated multiple times on social media and here. Empirically though, rates that are “lower” (than 3.11%) and are NOT rising rapidly have allowed the market to climb back above the prior all time high (ATH).” Rates are bouncing in a downtrend until proven otherwise.
I said weeks ago, “Watch the oil price too. Higher oil tends to mean higher rates.” WTI had bounced, but has started weakening again. It closed at 55.76 vs. 60.21 last week and is rolling over. There a a lower high below both 50 and 200 day mav’s. We now have another lower low.
For 3 Weeks Now – just a reminder – I don’t think this is the path from here: If the bounce in TNX continues too quickly and too high, this will give rise to Rate Shock III… As said before: “Watch the rate at which TNX climbs if the current trend reverses. If it shoots up very fast, stocks will correct.” In the Sept. 28th issue: “A rapid push higher in rates would mean trouble for stocks, as occurred in early 2018. That’s what I called ‘Rate Shock.'” The period of rising rates in early October I called #RateShockII. The risk lately has been the “Negative Rate Shock I” we saw in May.
Thank you for reading. Would you please leave your comments below where it says “Leave a Reply”… or ask a question or report a typo…
Pay it forward by sending the link to MarketTiming.Blog (that link will immediately connect them to this webpage) to a relative or friend. Thanks for doing that.
Be sure to visit the website for more general investing knowledge at:
Standard Disclaimer: It’s your money and your decision as to how to invest it.
I thank Worden Brothers for the charting system I use to post these charts. If you want to know more about the charting system I use every day, contact me. It makes it much easier to follow along with me if you can see the charts and manipulate them on your own computer. It’s a great investment to have an excellent charting system.
Note: I’ve updated my criteria for the equity signal for a further U.S. stock market rally to the following: GREEN = Bullish, YELLOW = Neutral, RED = Bearish. In other words, the colors tell you whether the signal supports the stock rally or not, while the Bullish, Neutral, and Bearish designations are about the trend.
A BEARISH trend signal does not mean we should not buy. A BULLISH trend signal does not mean you cannot sell some exposure. It depends on what is going on in the economy and how oversold/overbought the market is at a given point whether the Bearish signal is to be sold or bought, sold on the next bounce, etc. and whether a Bullish signal is to be bought or if profits should be taken. A NEUTRAL trend signal does not mean the end of the Bull or Bear. It means to wait and look for possible subsequent entry points within the existing trend, Bull or Bear, but preserve capital if the entry fails. Our strong intention is to buy low and sell high. By the way, I will keep showing the prior orange “Trigger lines” in the IWM and GLD charts for now as reference points only; they have historical value for us from the post-2016 election period.
Copyright © 2019 By Wall Street Sun and Storm Report, LLC All rights reserved.
