A Market Timing Report based on the August 12 Intraday Data, published Monday, August 12th, 2019…
I deliver focused comments on market timing once a week. These are supplemented with daily “Tweets/StockTwits” (see links below) and comments in the “markettiming” room on StockTwits.
I provide quite a bit of intraweek commentary, and if you don’t see it, you will miss out on quite a bit of context, so please click on the social media links below and have a read… Thank you as always for being loyal readers and interacting on social media with your questions and comments!
1. SP500 Index Market Timing (S&P 500 Index®; SPY, SPX):
I’ve been writing this report today as the market continues to fall. That’s real time confirmation of the trends I refer to below!
Earnings reports are as of last Friday in for 90% of the SP500 Index. Per FactSet, if earnings continue to be negative for the index, though only at -0.7% (see below), Q2 will be the second of two quarters said to be negative for earnings.
Let’s next check my “Bull Market Health Score”…
What would satisfy me that the Bulls are serious?
Let’s check the list once again… The Bull Market Health Score this week? Bulls 0/Bears 5. At the end of July we were at Bulls 2.5/Bears 2.5.
For each checklist item below, I give you the points scored as Bullish or Bearish.
1. New high. Bears 1.0 point. Lower high for Bears.
2. VIX below the “Bull Nirvana Number” AND my bonus number? Bears 1.0 point. At the moment, (8-12-19 12:38 pm) the VIX is 19.45. The VIX Game Score as I call it is Bulls 0/Bears 8 as of the close Friday and again today, while it was Bulls 8/Bears 0 at the end of July. For the July 26th close, I said:
” The Bulls don’t have to be finished here, but they may be. There has been a steady fall in the VIX from the lower VIX high achieved on June 3rd. We are past the easy part of the Bull trade now.”
3. AD % Line Uptrend (proprietary stat; see base of report about this): Bears 1.0 point. It’s at 16,414 now (Mon. 2:23 pm) vs. 16, 465 last Friday. It’s now back below the May 1st high.
4. Volume: Bears 1 point. Volume did not rise on the 1.88% up move in the market on Thursday, August 8th. That was one signal to “sell some.” I was looking for just a 1-3 day counter trend rally, which we got.
5. The “U.S. Index Matrix Signal” as I call it: Bears 1 point. Large, mid, and small caps are all rolling over.
Let’s check in on the context around the price action of the market by looking at the current RISKS…
Earnings Risk: what is shown are the projections in the FactSet 3-15-19 report followed by the reports from 4-12-19 through 8-09-19 (details HERE)… The last numbers for Q2 are numbers for the current reported earnings from 90% of SP500 Index companies to date. The arrows “—>” indicate 3 weeks of of omitted data in order to compress the data.
For Q2 2019, analysts are projecting earnings growth of 0.1% —> -1.3% -> —> -2.1% —> -2.6% -> -2.6% -> -3.0% -> -1.9% -> -2.6%-> -1.0% -> -0.7%
and revenue growth of 4.6% —> 4.3% —> 4.1% —> 3.8% -> 3.8% -> 3.7% -> 3.8% ->4.0% ->4.1% -> 4.1%
For Q3 2019, analysts are projecting earnings growth of 1.8% —> 0.8% —> 0.3% —> -0.5% -> -0.5% -> -0.8% -> -1.4% ->-1.9% -> -2.2% -> -3.1%
and revenue growth of 4.4% —> 4.4% —> 4.2% —> 3.8% -> 3.8% -> 3.3% -> 3.2% ->3.2% -> 3.1% -> 3.0%
For Q4 2019, analysts are projecting earnings growth of 8.1% —> 7.5% —> 7.2% —> 6.3% -> 6.3% -> 6.0% -> 5.4% ->4.9% -> 4.5% -> 3.9%
and revenue growth of 4.8% —> 4.8% —> 4.6% —> 4.3% -> 4.3% -> 4.2% -> 4.0% ->4.0%-> 4.5%-> 4.0% -> 4.0%
For CY 2019, analysts are projecting earnings growth of 3.4% —> 3.2% —> 2.7% -> 2.6% -> 2.4% -> 2.3% -> 1.7% -> 1.9% -> 1.5%
and revenue growth of 4.7% —> 4.7% —> 4.5% -> 4.4% -> 4.3% -> 4.4% ->4.4% -> 4.4% -> 4.3%
For Q1 2020, analysts are projecting earnings growth of 10.5% -> 10.7% -> 10.3 -> 9.9% -> 9.8% -> 9.5% ->9.2% –>9.0% -> 8.5%
and revenue growth of 6.2% -> 6.1% -> 6.0% -> 5.8% -> 5.8% -> 5.9% ->5.9% -> 5.7% -> 5.6%
For Q2 2020, analysts are projecting earnings growth of 13.3% -> 13.3% -> 12.9% -> 13.2% -> 13.5% -> 12.0% ->12.6% -> 10.7 -> 9.9%
and revenue growth of 6.8% -> 6.8% -> 6.6% -> 6.6% -> 6.6% -> 6.7% ->6.6% -> 6.5% -> 6.4%
Conclusion: Is it still the case that earnings are weak (about flat) for the 2nd quarter in a row and are due to be negative for a third quarter (Q3 2019). The market is waking up to the fact that the Federal Reserve does not see the level of risk it sees! Hence, we have crashing 10 Year Treasury yields and falling stock markets around the world, when the Fed lowering rates aggressively should cause yields to rise at the long end. The market sees the Federal Reserve as being behind the curve.
Here’s a Brief Review of the Other Market Risks at Hand:
China Deal Risk: No important change. A deal is still promised, but the jawboning is not working at all anymore. Heard about the boy who cried wolf? The lack of progress, should it lead to higher tariffs, would be a big blow to global markets. Trump and Xi need to reach an agreement before then…or else…
U.S. Iran War Risk: Simmering at a low boil, but not over as indicated by recent statements from Iran.
Mueller Report/Trump Impeachment Risk: Ongoing. Read my analysis in the July 26th issue HERE.
2020 Election Risk: No important change. Probably the biggest risk to the markets and most Americans are oblivious to this from the markets’ point of view. I’ll stand by this: “The market will likely pull back at least 10-15% going into the election if the outcome is even unclear, meaning President Trump is NOT ahead by a wide margin (a likelihood, but not a certainty, depending on whether the Dems go for a “McGovern” candidate, as in Nixon-McGovern in 1972, a Democrat disaster.”
Deficit/Debt Threat: No important change. I’ll leave this here as a monument to our monumental debt: “They all see the problem and do nothing about it. They just keep spending. Per the NY Times: ‘Within a decade, more than $900 billion in interest payments will be due annually, easily outpacing spending on myriad other programs.’ The 2018 defense budget was $800 B. Medicare? $582 B. Think about that! Trump and the GOP may be spending dollars meant for your future Medicare and Social Security today.”
Fed Rate Cut Risk: No important change. The decline in yields is getting worse. The market is still leery of Federal Reserve Chair Powell’s “mid-cycle adjustment” in rates statement, meaning it believes he won’t be aggressive enough in lowering the Fed Funds rate.
Now take a look at the SP500 chart.
SP500 Large Cap Index AT 11:02 am E.T. MONDAY (click chart to enlarge; SPX, SPY):

Rolling over again.
Now let’s check in on two “Canary Signals” we’ve been following:
“Intel-igent Market Timing Signal” (Intel; INTC): Negative. Nearly back to the May low. Though a U.S. China Trade War resolution will eventually cause it to rally strongly, the delay of an agreement could cause a further decline.
Bank of America (BAC) Market Timing Signal: Negative. Broke down badly off the May top, while rates continue to collapse, ruining banking margins. Testing near March and June lows.
Keep up-to-date during the week at Twitter and StockTwits (links below) where a combined 34,101 investors are following the markets with me…
Follow Me on Twitter® Follow Me on StockTwits®.
Join the Conversation in the StockTwits “MarketTiming” Room
Now let’s go on to review investor sentiment…
Survey Says!
Sentiment of individual investors (AAII.com) showed a Bull minus Bear percentage spread of -26.54% vs -14.38 last week . The low in Sentiment in December was -28% for the poll ending on 12-12-18, but the price low was on December 26th intraday. Sentiment has room to become more extreme, but the December comparison says to me there is more room for a further decline in the SP500 Index ahead, even if sentiment does not worsen.
| Bulls | Neutrals | Bears |
| 21.66% | 30.15% | 48.20% |
| Thurs. 12 am CT close to poll | ||
2. U.S. Small Caps Market Timing (IWM):
Avoid them. They are higher beta, so they’ll fall harder in a further market decline. They are breaking down in lockstep with large caps after a brief bounce.
Russell 2000 U.S. Small Cap Index (click chart to enlarge; IWM, RUT):
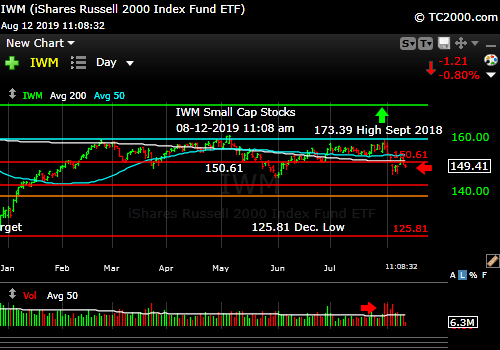
To be avoided due to higher beta/risk.
3. Gold Market Timing (GLD):
I said on 7-26-18: “Still a Bull. Add on dips.” I also said the ascending triangle should lead (with higher probability) to an upside resolution, and that happened. It’s hard to chase when gold goes vertical/exponential, so wait for a pullback, or you’ll likely be part of a pullback. That said, the run does not appear to be over as long as the Federal Reserve is going to be cutting rates. When they STOP cutting and long rates start rising significantly, we’ll need to close the trade and keep core gold holdings only.
The Gold ETF (click chart to enlarge the chart; GLD):
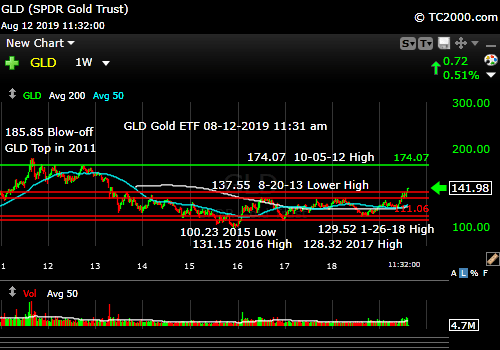
Bull run intact, but only a buy on dips.
4. Interest Rate Market Timing (10 Year Treasury Yield; TNX, TLT, IEF):
The 10 Year Treasury Yield is still crashing, down 8.0 basis points just for Monday, which is a very bad sign for the stock market, and a very good sign for gold/gold stocks. I exited TLT early, but did so knowing I still had exposure to long municipal bonds and gold/gold stocks as hedges.
Check out the “Market Signal Summary” below – after you review the following chart…
U.S. 10 Year Treasury Note Yield (click chart to enlarge; TNX, IEF, TYX, TLT, TBF):

Rates crashing to the prior lows.
Now let’s review three key market timing signals together….
Do not use these signals as a trading plan. They are rough guidelines. I currently share my BUYS and SELLS in as timely a way as possible on social media (links above).
MY MARKET SIGNAL AND TREND SUMMARY for a Further U.S. Stock Market Rally with Real GDP Growth (“Real” means above inflation):
Stock Signal RED for a further U.S. stock market rally with a Bearish SP500 Index trend. The stock signal is based on small caps, as they often lead the market down.
The V*IX (which relates to SPX volatility; * added to symbol to throw off the webcrawlers!) These are the targets: 13.31, 14.04-14.08, 15.04, the “fulcrum” range = [15.94-15.95 to 16.09], 17.06, 17.27, and 17.89. The bonus target #8 is [12.-17-12.37]. The Bears have 8 of 8 targets at a VIX of 20.52 (Monday, 2:39 pm ET). I consider the “fulcrum” the key decision point that turns the market from Bearish to Bullish, when the VIX falls below that entire fulcrum range.
The ‘Bull Nirvana Target’ is our V*IX # of 2018: 13.31.” (That is target #7 for the Bulls.)
Gold Signal RED for a further U.S. stock market rally with a BULLISH Gold Trend. What gold does mostly as I’ve written HERE is follow real interest rates.
From before: “Remember GLD is being used as an indicator for the ECONOMY here.” If gold continues to rise, it means the market believes real rates will fall, which in the current context means the global economy is slowing. That will ultimately hurt U.S. stocks.
Rate Signal RED for a further stock market rally with a BEARISH 10 Year Yield Trend.
For Reference: “Rates usually RISE slowly in a strong recovery and the stock market rally continues as they rise, as I’ve repeated multiple times on social media and here. Empirically though, rates that are “lower” (than 3.11%) and are NOT rising rapidly have allowed the market to climb back above the prior all time high (ATH).”
I said weeks ago, “Watch the oil price too. Higher oil tends to mean higher rates.” It is at 54.81 at 8-12-19 1:50 pm ET. It closed at 54.50 last week after a bounce off the May low. WTI Oil is still below its 50 and 200 day moving average. Minus a war with Iran or other disruptions, oil will move with the prospects of the global economy (Trump hates wars as he sees them as wasteful and doesn’t like the bloodshed either. He’s right on those points!)
Just a reminder (not a current problem): If TNX bounces too quickly and too high, this will give rise to Rate Shock III… As said before: “Watch the rate at which TNX climbs if the current trend reverses. If it shoots up very fast, stocks will correct.” In the Sept. 28th issue: “A rapid push higher in rates would mean trouble for stocks, as occurred in early 2018. That’s what I called ‘Rate Shock.'” The period of rising rates in early October I called #RateShockII.
The risk lately has been “Negative Rate Shocks.” (Not negative rates in the U.S. yet! “Negative” refers to the direction of the shock.) First we had “Negative Rate Shock I” in December 2018 (because rates FELL while the Fed raised the Fed Funds rate 0.25% in mid-December, in what was perceived as a policy error), “Negative Rate Shock II” in May, and “Negative Rate Shock III” in August.
Thank you for reading. Would you please leave your comments below where it says “Leave a Reply”… or ask a question or report a typo…
Pay it forward by sending the link to MarketTiming.Blog (that link will immediately connect them to this webpage) to a relative or friend. Thanks for doing that.
Be sure to visit the website for more general investing knowledge at:
Standard Disclaimer: It’s your money and your decision as to how to invest it.
I thank Worden Brothers for the charting system I use to post these charts. If you want to know more about the charting system I use every day, contact me. It makes it much easier to follow along with me if you can see the charts and manipulate them on your own computer. It’s a great investment to have an excellent charting system.
Note: I’ve updated my criteria for the equity signal for a further U.S. stock market rally to the following: GREEN = Bullish, YELLOW = Neutral, RED = Bearish. In other words, the colors tell you whether the signal supports the stock rally or not, while the Bullish, Neutral, and Bearish designations are about the trend.
A BEARISH trend signal does not mean we should not buy. A BULLISH trend signal does not mean you cannot sell some exposure. It depends on what is going on in the economy and how oversold/overbought the market is at a given point whether the Bearish signal is to be sold or bought, sold on the next bounce, etc. and whether a Bullish signal is to be bought or if profits should be taken. A NEUTRAL trend signal does not mean the end of the Bull or Bear. It means to wait and look for possible subsequent entry points within the existing trend, Bull or Bear, but preserve capital if the entry fails. Our strong intention is to buy low and sell high. By the way, I will keep showing the prior orange “Trigger lines” in the IWM and GLD charts for now as reference points only; they have historical value for us from the post-2016 election period.
Copyright © 2019 By Wall Street Sun and Storm Report, LLC All rights reserved.

Thank you David!
You’re welcome Charles!