A Market Timing Report based on the 07-26-2019 Close, published Saturday, July 27th, 2019…
I deliver focused comments on market timing once a week. These are supplemented with daily “Tweets/StockTwits” (see links below) and comments in the “markettiming” room on StockTwits.
I provide quite a bit of intraweek commentary, and if you don’t see it, you will miss out on quite a bit of context, so please click on the social media links below and have a read… Thank you as always for being loyal readers and interacting on social media with your questions and comments!
1. SP500 Index Market Timing (S&P 500 Index®; SPY, SPX):
Earnings reports are in for 44% of the SP500 Index. Per FactSet, if earnings continue to be negative for the index, though only by a couple of percent (see below), this will be the second of two quarters said to be negative for earnings. Another firm whose data I review says the earnings numbers are slightly positive (about +2%; that was on Monday, but FactSet was still reporting negative earnings growth).
Regardless, earnings are about flat, and the market appears to be discounting improving comparisons next year, which you can see below are much stronger. Will those numbers be brought down? That is the question! Whether ’tis nobler to pursue a rising market despite the slings and arrows of lower earnings fortunes, or by a sleep to say this ends in heartache and the thousand natural shocks that markets are heir to? That’s obviously what Shakespeare said about investing in an ever rising Bull market in the midst of multiple market risks! 😉
Sentiment has been the real guide to this market in my view. Review that below. Astoundingly, sentiment says we are nowhere near a top! And that is why I added a bit of exposure even though the market is a bit stretched here on the new breakout to another all time high this week. Individual investors, who are the best guide in my view, are still very skeptical of this rally. The flow stats on investments in bonds vs. stocks are heavily skewed to bonds still despite ever lower rates. That has worked out well in fact. Lower rates and higher stocks. Higher gold too by the way, because the endpoint of this is a disaster for fiat currencies. I’ll say more about adding exposure as a market goes up, a bit later, but….
Let’s next check my “Bull Market Health Score”…
Are the Bulls serious?
What would satisfy me that the Bulls are serious about this advance?
Let’s check the list once again… The Score this week? Bulls 2.5/Bears 2.5. Last week it was Bulls 0.5/Bears 4.5. Last week I erroneously said the score was neutral and no one noticed? It was BEARISH after a minor dip off the 7-15 top. This week we have a NEUTRAL score with a new all time high. That means the new high is suspect. The challenge to that statement would be that split sentiment (similar numbers of Bulls and Bears) has carried this market higher and higher and higher… Based on the numbers below I could have foregone the last add on Friday, which I kept small. I’ll comment further on adding to breakouts after we go over these numbers….
For each checklist item below, I give you the points scored as Bullish or Bearish.
1. New high. Bulls 1.0 point. The market is stretched to the top of the channel I pointed out last week (yellow lines in the chart below), but despite that, we have a new high. The Bulls win this point!
2. VIX below the “Bull Nirvana Number” AND my bonus number? Bulls 1 point. Yes, but barely below point #8 (0.01 below the 8th Bull point). The VIX Game Score as I call it is Bulls 8/Bears 0 as of the close Friday. Of course, being near the lows of the past two years may be a problem. Even lower lows need to be achieved, or we’ll see a big summer spike in VIX. I’ve grown to dislike summers for this reason. 😉 Usually between June and October, we see some turbulence. The Bulls don’t have to be finished here, but they may be. There has been a steady fall in the VIX from the lower VIX high achieved on June 3rd. We are past the easy part of the Bull trade now.
3. AD % Line (proprietary stat; see base of report about this): Bulls 0.5 point. The close was 16,583 vs. 16, 511 last Friday. The 6-20-19 high at a peak in SPX was 16,517, so this close was above there. The 7-15 SPX high had an AD % of 16,615. which would be the next Bull target. I withheld 0.5 points from the Bulls because the AD % did not go to a new high with the price of SPX. That’s what is called a negative divergence, but so far, I’d say it’s not lethal.
4. Volume: Bears 1 point. Volume went down vs. the day before, not up on the breakout. Negative. Look at the breakout volume on 6-20-19 for comparison. THAT is what you want to see.
5. The “U.S. Index Matrix Signal” as I call it: Bears 1 point. The small caps and midcaps are both below their May highs. That’s does not show broad market strength. On social media, you’ll see me say “The U.S. Index Matrix shows strong buying.” That means the small to mid caps are participating as they should, not following tentatively or even retreating.
I cannot vouch for the world recovering in a more robust way. The numbers have not supported that. U.S. GDP reported on Friday was goosed above 2% by government spending. The SAAR GDP came in at 2.1% and the Year/Year GDP came in at 2.3%. You can find a link to the Y/Y Chart HERE. I wonder if Trump is using ammunition too early prior to the 2020 election.
Let’s check in on the context around the price action of the market by looking at the current RISKS…
Earnings Risk: what is shown are the projections in the FactSet 3-15-19 report followed by the reports from 4-12-19 through 7-26-19 (details HERE)… The last numbers for Q2 are numbers for the current reported earnings from 44% of SP500 Index companies to date. The arrows “—>” indicate 3 weeks of of omitted data in order to compress the data.
For Q2 2019, analysts are projecting earnings growth of 0.1% —> -1.3% -> —> -2.1% —> -2.6% -> -2.6% -> -3.0% -> -1.9% -> -2.6%
and revenue growth of 4.6% —> 4.3% —> 4.1% —> 3.8% -> 3.8% -> 3.7% -> 3.8% ->4.0%
For Q3 2019, analysts are projecting earnings growth of 1.8% —> 0.8% —> 0.3% —> -0.5% -0.5% -> -0.8% -> -1.4% ->-1.9%
and revenue growth of 4.4% —> 4.4% —> 4.2% —> 3.8% -> 3.8% -> 3.3% -> 3.2% ->3.2%
For Q4 2019, analysts are projecting earnings growth of 8.1% —> 7.5% —> 7.2% —> 6.3% -> 6.3% -> 6.0% -> 5.4% ->4.9%
and revenue growth of 4.8% —> 4.8% —> 4.6% —> 4.3% -> 4.3% -> 4.2% -> 4.0% ->4.0%
For CY 2019, analysts are projecting earnings growth of 3.4% —> 3.2% —> 2.7% -> 2.6% -> 2.4% -> 2.3% -> 1.7%
and revenue growth of 4.7% —> 4.7% —> 4.5% -> 4.4% -> 4.3% -> 4.4% ->4.4%
For Q1 2020, analysts are projecting earnings growth of 10.5% -> 10.7% -> 10.3 -> 9.9% -> 9.8% -> 9.5% ->9.2%
and revenue growth of 6.2% -> 6.1% -> 6.0% -> 5.8% -> 5.8% -> 5.9% ->5.9%
For Q2 2020, analysts are projecting earnings growth of 13.3% -> 13.3% -> 12.9% -> 13.2% -> 13.5% -> 12.0% ->12.6%
and revenue growth of 6.8% -> 6.8% -> 6.6% -> 6.6% -> 6.6% -> 6.7% ->6.6%
Conclusion: Earnings have been weak for the 2nd quarter in a row and are due to be negative for a third quarter. The market is looking past this weakness to something better, based largely on a minimum of three cuts of 0.25% each from the Federal Reserve. If the market does not get the three cuts, it will NOT be happy.
These low rates help fund the buybacks that continue by the way. Companies wanting to goose their earnings and also able to borrow (not the new small caps for ex.) can simply buy back more of their stock.
Here’s a Brief Review of the Other Market Risks at Hand:
China Deal Risk: No important change. A deal is still promised. Yet Larry Kudlow, Trump’s economic advisor, says don’t count on a big deal anytime soon. Meanwhile, the chief negotiators are flying to China this coming week. I have an intuitively based suspicion. I believe that President Xi of China has threatened some “Armageddon” level of retribution against Trump should he impose 25% tariffs on China on an additional $300 B of Chinese goods. The 10% Xi tolerated, as he fought it by debasing the yuan. The current 25% sanctions on 250 B of goods is hurting more. Xi hurt American farmers by taking his grocery shopping list elsewhere in the world. Trump says he could impose those additional sanctions, but it would be suicidal, so he won’t.
What could Xi do at an “Armageddon threat” level? Some ideas would be to madly dump long dated U.S. Treasuries into the market. This could be coordinated between China and Russia and perhaps some of the smaller players. Same day, same time – SELL! If they can create a panic Rate Shock as I’ve called the big moves, it could shake the equity market badly.
Xi could also block all future sales of certain U.S. companies in China. He does not have to seize their assets, just shut them down. Apple has too many employees there to be attacked in my view, but others do not. An example? He could simply shut down all Starbucks locations. What does he care if there are U.S. coffee/tea shops in China? They have their own competitors now who can hire the displaced workers. These are just some of the disruptions that could be dreamed up beyond cyber warfare, election interference etc.
Who do you think the Chinese might attack in the 2020 election cycle? Trump is my wild guess. China and the Russians could work together on this to hammer Trump on social media, and even seek to change digital election results. The Russians give the appearance of liking Trump over Clinton, but my guess is they’d feel better with Biden over Trump. P.S. that is why Trump had better see the light and make sure there is a paper trail for ALL U.S. election results. Someone is going to pay for the lack of such an audit method.
U.S. Iran War Risk: Quieter this week. Iran was acting out but did not escalate this past week. Maybe they were threatened more directly. Previously a British flagged oil tanker with Swedish ownership was seized by Iran. Prior to that, an Iranian vessel was seized by the UK for violating the ban on oil shipments to Syria.
Mueller Report/Impeachment Risk: Mueller stood largely by his report, which did not exonerate the president, nor did he indict him, as he chose (though he did not have to) to follow the DOJ memo stating that a sitting President cannot be indicted.
The assertion by Fox hosts that it’s all a big hoax, which is Trump’s standard message, is wrong. Don McGhan testified he was directly ordered by President Trump to have Attorney General Sessions fire Special Counsel Robert Mueller. That is obstruction of justice. That we knew before the hearing occurred. Obstruction of justice does not require the act be successful. Intent is required to convict, but can be inferred from a series of acts by the party in question that imply corrupt intent.
The statute on removal of a Special Counsel: “The regulations further state the special counsel could be removed only “for misconduct, dereliction of duty, incapacity, conflict of interest, or for other good cause, including violation of Departmental policies.” (Ref.) Even the attempt to remove Mueller simply because he did not like being investigated for obstruction is obstruction of justice. Realize that Republicans under Nixon did think obstruction of justice was grounds for impeachment and removal of a President. Nixon did not burglarize the Watergate Hotel. He tried to cover up Watergate. In contrast, today’s Republicans in Congress are tolerant of the crime of obstruction of justice. And even the Democrats are afraid of turning off the public by proceeding with impeachment.
Ethics Tangent of the Week: Parenthetically, the treatment of Mueller by the GOP Congressmen was inexcusable. The man is a decorated Marine who saved fellow marines from being killed in Vietnam under harrowing circumstances noted HERE. He saved them while under enemy fire. That’s no video game we’re talking about. He risked his life.
Here is an excerpt:
In July 1968, he was sent to South Vietnam, where he served as a rifle platoon leader as a second lieutenant with Second Platoon, H Company, 2nd Battalion, 4th Marines, 3rd Marine Division.[12][26] On December 11, 1968, during an engagement in Operation Scotland II, he earned the Bronze Star with “V” device for combat valor for rescuing a wounded Marine under enemy fire during an ambush in which he saw half of his platoon become casualties.[27][28] In April 1969, he received an enemy gunshot wound in the thigh, recovered, and returned to lead his platoon until June 1969.[29] For his service in and during the Vietnam War, his military decorations and awards include: the Bronze Star Medal with Combat “V”, Purple Heart Medal, two Navy and Marine Corps Commendation Medals with Combat “V”, Combat Action Ribbon, National Defense Service Medal, Vietnam Service Medal with four service stars, Republic of Vietnam Gallantry Cross, Republic of Vietnam Campaign Medal, and Parachutist Badge.
To me? Mueller is a man a courage vs. President Bone Spurs Trump. No contest. He also served as FBI Director for 13 years after many years serving as a U.S. prosecutor. The first time he was approved by the Senate in a 98 to 0 vote. The second time, President Obama asked him to serve for two additional years and he was confirmed 100 to 0. Knowing all this about the man, I watched the GOP questioning with a high degree of revulsion. His metal capacity? Trump, the “stable genius” [his words], made fun of him, yet the man was clear when it counted and remember, testifying and answering rapidly read questions from angry people can be disorienting, even to the young.
Another point… Leadership at his level does not require as much “quick brainpower” as it does wisdom. He provided that wisdom to his team of investigators, and I take this honorable man at his word that his conduct was nonpartisan. He was not born yesterday, remember. He has spent a lifetime avoiding partisanship in his public duties. Hence the extension of his Directorship of the FBI under Obama even though he was a Republican with a 100 to 0 vote for confirmation.
One day our brains may be less quick. Let’s hope those around us are not making fun of us with the grotesque disrespect shown to Director Mueller by most of the Republicans. Not a political judgment here. This is a judgment of deeply flawed character, and my judgment is “guilty”!
END of Ethics Tangent 😉
Here’s the problem for the impeachment path.
1. If the Democrats could not impeach Trump based on the Mueller report, without additional evidence, why would they be moved to do it now?
2. The public is not behind impeachment, and that is the litmus test House Leader Pelosi is using to proceed more formally.
Yet the investigations will continue, and the risk, should McGahn be allowed to testify, may move to moderate. If McGhan testifies, the public will believe him is my guess. Then Trump will find the polls shifting against him, as they did as the case against Nixon was pursued over a period of time. McGhan would be the John Dean of the Trump era.
From last week: Remember also that the Clinton Impeachment drawdown created a Mini Bear market from which there was a fairly rapid recovery even before his Senate trial. It was a big buying opportunity in one of the biggest Bull markets of all time. When did the SP500 Index peak in 1998 when Bill Clinton was headed to his impeachment? July 17th.
More risks…
2020 Election Risk: No important change. Probably the biggest risk to the markets and most Americans are oblivious to this from the markets’ point of view. I’ll stand by this: “The market will likely pull back at least 10-15% going into the election if the outcome is even unclear, meaning President Trump is NOT ahead by a wide margin (a likelihood, but not a certainty, depending on whether the Dems go for a “McGovern” candidate, as in Nixon-McGovern in 1972, a Democrat disaster.”
Deficit/Debt Threat: No important change. I’ll leave this here as a monument to our monumental debt: “They all see the problem and do nothing about it. They just keep spending. As mentioned last week: Per the NY Times: “Within a decade, more than $900 billion in interest payments will be due annually, easily outpacing spending on myriad other programs.” The 2018 defense budget was $800 B. Medicare? $582 B. Think about that! Trump and the GOP may be spending dollars meant for your future Medicare and Social Security today.”
Fed Rate Cut Risk: No important change. We are due for a 0.25% cut for July. Keep reading though…my “Fed Warning” I put under the TNX section #4 below…
As said three weeks ago, “No cut [in July] would cause the market to dive. A cut of just 0.25% could disappoint the market as well, although the majority would be fine as they expect that cut.” The majority are still looking for July, Sept. and Dec. cuts per CME Group. Only the minority expect other cuts thru April 2020.
As I said five weeks ago, the Fed members actually don’t believe three cuts are going to be needed, as summarized HERE. They need to shift this during this meeting or three cuts just are not as likely. The market will not like that.
GDP Risk: GDP was reported as discussed above. It was “good enough” for now, though slowing vs. the July 2018 peak in the Y/Y number at 3.2%. It’s been downhill to the tune of 0.9 GDP points since then.
What do you do if the market just keeps creeping higher and higher and higher? To someone with mostly cash, this can be like a teacher scratching her nails on the blackboard. You want it to stop and there is no telling when it will! Another nails on blackboard experience to avoid is going down for several years and then “never” making a new high. Ask the Japanese about that.
Are you aware that EWJ, the Japan ETF is now at levels seen in 1991? That is 28 years with no capital appreciation of those shares. Can you see why it’s necessary to manage risk? It’s easy to say “You should be 100% invested in stocks, because look at what the market has done you fool!” (that message is easy to find on social media, disguised in certain ways) and yet, if you invest in that way at a top of the market as in 2007, and suffer a 55% drawdown (2009 low), you have to make back over 100% to get back to even. And if it the situation becomes like Japan, you may retire and never see your money move to new highs again.
Say you are 61 now. You’ll see why I picked that age in a moment. The average age of death for U.S. males is 78.69 years. I know, we all believe we’ll live longer than the stats. Yet, the average 61 year old would be dead prior the market making a new high, if our market (may God forbid it! ;)) turned into what the Japanese market has been like for 3 decades.
There is a balance to strike between losing opportunity and losing money. Where that falls is up to you! Just make a conscious decision about it.
The only thing to do to manage that “lost opportunity risk” is to add slowly as the market rises if it fails to correct substantially. As said, it DID correct in May, and that was one place to add. I’d do it slowly in steps at this point, and leave some cash regardless unless you find specific investable stocks/other opportunities like gold. Betting that interest rates will go SUBSTANTIALLY lower in the U.S. is now a tougher call than it was that rates would fall from 3.25% to “somewhere significantly lower.” So Treasuries could bite us on the you-know-what. The recovery cannot continue for too long until the Fed has to raise rates to control/prevent inflation moving above their 2% PCE Inflation Index target. At that point, Treasuries won’t be doing well unless stocks are selling off in a big way. Clearly that would also impact the gold/gold stock trade. Be prepared to take profits in both. Balance that with this thought: Taking profits too early is a mistake. The Fed has to change direction again to void the bond/Treasury and gold trades in my view. I’ll be patient, I promise!
As said, the time to “add more” is after pullbacks such as the one we saw in May. I felt I had enough exposure for “what was coming,” but I did edge up my exposure on the rally back during June and again in July with my last add on this breakout. I also had bought at the 3-08 pullback, so I would have been buying the same price point had I added at the May low.
Now take a look at the SP500 chart. The first is the SPY chart showing the long term upward channel. Note that the lower line of the channel ignores the out-sized volatility in December. Ignore it for now. It does not really matter as we’re most focused on the top channel line….
SP500 Large Cap Index CLOSE (click chart to enlarge; SPX, SPY):
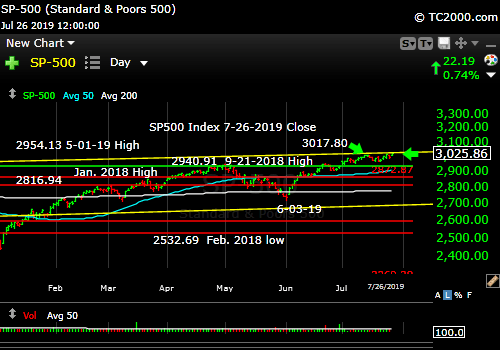
New all time high with neutral Market Health Signal.
Now let’s check in on two “Canary Signals” we’ve been following:
“Intel-igent Market Timing Signal” (Intel; INTC): Negative. Initially the reaction was positive on the 25th after the close, but things turned negative by the 26th when the China deal was brought back into question. The last price bar is a Bearish engulfing signal vs. the price range of the prior two days. That means there was an attempt to attain a higher high that failed and it closed below the range of the prior two days AND on high volume by the way. It looks like a reversal until proven otherwise (new high).
Bank of America (BAC) Market Timing Signal: Neutral. Re-challenging the May high is not good enough. And why is it rallying on supposedly a Fed that is now in a rate cutting cycle? Hmmmm…. Someone is wrong!
Rates have gone nowhere since June 3rd, but one would think that if the Fed is lowering rates three times, TNX would fall further and drag down the banks or at least keep them from going very far.
Keep up-to-date during the week at Twitter and StockTwits (links below) where a combined 34,055 investors are following the markets with me…
Follow Me on Twitter® Follow Me on StockTwits®.
Join the Conversation in the StockTwits “MarketTiming” Room
Now let’s go on to review investor sentiment…
Survey Says!
Sentiment of individual investors (AAII.com) showed a Bull minus Bear percentage spread of just -0.28% vs. +7.29% the prior week. That spread has been flattish for weeks!
As I’ve said: “At the same time, we have not likely seen the ultimate top of this Bull market, at least for the large caps, because sentiment is just not positive enough.” Sentiment is not high enough to say that this move up is finished. The small and midcaps MUST now come along or this rally will fail. Sentiment says the large caps, at least, are not at a top yet.
| Bulls | Neutrals | Bears |
| 35.93% | 35.43% | 28.64% |
| Thurs. 12 am CT close to poll | ||
2. U.S. Small Caps Market Timing (IWM): Discussed above. Not good enough and higher volatility, so be careful unless you know your companies inside and out. The small cap index is not where the action is. If it can exceed the May high, I’ll be impressed!
Russell 2000 U.S. Small Cap Index (click chart to enlarge; IWM, RUT):
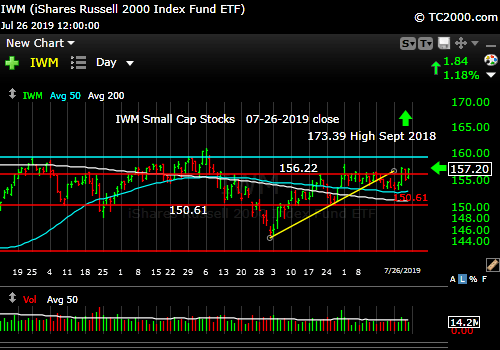
Weak still vs. large caps.
3. Gold Market Timing (GLD): Still a Bull. Add on dips. The ascending triangle is Bullish and SHOULD lead to an upside resolution. Buyers came in on the last attempt of a breakout and then sellers matched them the next day. Gold is waiting to SEE what the Fed will do. If the Fed cuts and does not balk on further cuts with questionable wording, gold will like it and stocks will too.
The Gold ETF (click chart to enlarge the chart; GLD):
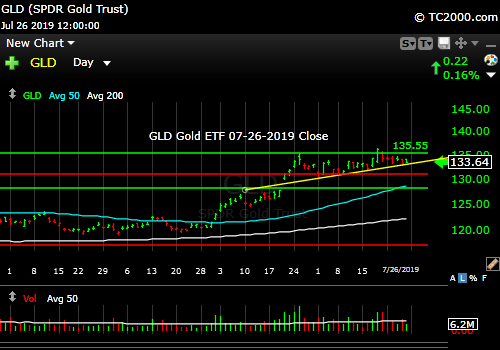
Ascending triangle is Bullish.
4. Interest Rate Market Timing: The 10 Year Yield has moved sideways and closed Friday at the June 3rd close. Same number! The Fed will cut 0.25% this week, but no more, as GDP is good enough. Again, if they hint at “one and done,” you’ll see selling of EVERYTHING but dollars. Bonds, gold, and stocks will drop like rocks! But if they do the opposite, and hint at more cuts in 2019, you’ll see the opposite. I believe Powell will “behave” as he’s clearly been whipped into line by Trump now. You could see the fear on his face in prior meetings when Trump’s attitude toward him and the Fed was raised. It is not a great precedent by the way.
I changed the trend signal to NEUTRAL below. We’ve formed the kind of bottoming formation we saw back in January through March. It is not impossible for rates to rise from here (see “one and done scenario” above), but after the Jan-Mar. period, TNX fell to new lows. If Powell keeps to what the bond market wants, rates will drop to new lows off the current base.
Check out the “Market Signal Summary” below – after you review the following chart…
U.S. 10 Year Treasury Note Yield (click chart to enlarge; TNX, IEF, TYX, TLT, TBF):
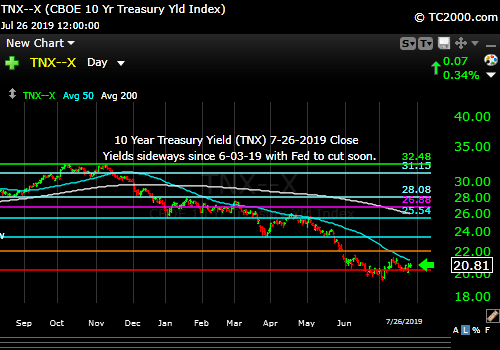
Rates sideways since 6-03-19.
Now let’s review three key market timing signals together….
Do not use these signals as a trading plan. They are rough guidelines. I currently share my BUYS and SELLS in as timely a way as possible (close to real time as much as possible) on social media (links above).
MY MARKET SIGNAL AND TREND SUMMARY for a Further U.S. Stock Market Rally with Real GDP Growth (“Real” means above inflation):
Stock Signal NEUTRAL for a further U.S. stock market rally with a Bullish SP500 Index trend. The stock signal is based on small caps, as they often lead the market down. The weakness of small caps keeps me at neutral.
The V*IX (which relates to SPX volatility; * added to symbol to throw off the webcrawlers!) See above for the close this week and other comments. These are the targets: 13.31, 14.04-14.08, 15.04, the “fulcrum” range = [15.94-15.95 to 16.09], 17.06, 17.27, and 17.89. The bonus target #8 is [12.-17-12.37]. The Bulls have 8 of 8 targets this week at a 12.16 VIX close. I consider the “fulcrum” the key decision point that turns the market from Bearish to Bullish, when the VIX falls below that entire fulcrum range.
The ‘Bull Nirvana Target’ is our V*IX # of 2018: 13.31.” (That is target #7 for the Bulls.)
Gold Signal RED for a further U.S. stock market rally with a BULLISH Gold Trend. What gold does mostly as I’ve written HERE is follow real interest rates.
From before: “Remember GLD is being used as an indicator for the ECONOMY here.” If gold continues to rise, it means the market believes real rates will fall, which in the current context means the global economy is slowing. That will ultimately hurt U.S. stocks.
Rate Signal RED for a further stock market rally with a NEUTRAL 10 Year Yield Trend. I explained why I’m neutral above (7-26-19 post).
For Reference: “Rates usually RISE slowly in a strong recovery and the stock market rally continues as they rise, as I’ve repeated multiple times on social media and here. Empirically though, rates that are “lower” (than 3.11%) and are NOT rising rapidly have allowed the market to climb back above the prior all time high (ATH).” Rates are bouncing in a downtrend until proven otherwise.
I said weeks ago, “Watch the oil price too. Higher oil tends to mean higher rates.” WTI had bounced, but has started weakening again. It closed at 56.20 vs. 55.76 last week and is still rolling over. At least that’s what it looks like now. There’s a lower high below both 50 and 200 day mav’s. We now have another slightly lower low.
For 3 Weeks Now – just a reminder – I don’t think this is the path from here: If the bounce in TNX continues too quickly and too high, this will give rise to Rate Shock III… As said before: “Watch the rate at which TNX climbs if the current trend reverses. If it shoots up very fast, stocks will correct.” In the Sept. 28th issue: “A rapid push higher in rates would mean trouble for stocks, as occurred in early 2018. That’s what I called ‘Rate Shock.'” The period of rising rates in early October I called #RateShockII. The risk lately has been the “Negative Rate Shock I” we saw in May.
Thank you for reading. Would you please leave your comments below where it says “Leave a Reply”… or ask a question or report a typo…
Pay it forward by sending the link to MarketTiming.Blog (that link will immediately connect them to this webpage) to a relative or friend. Thanks for doing that.
Be sure to visit the website for more general investing knowledge at:
Standard Disclaimer: It’s your money and your decision as to how to invest it.
I thank Worden Brothers for the charting system I use to post these charts. If you want to know more about the charting system I use every day, contact me. It makes it much easier to follow along with me if you can see the charts and manipulate them on your own computer. It’s a great investment to have an excellent charting system.
Note: I’ve updated my criteria for the equity signal for a further U.S. stock market rally to the following: GREEN = Bullish, YELLOW = Neutral, RED = Bearish. In other words, the colors tell you whether the signal supports the stock rally or not, while the Bullish, Neutral, and Bearish designations are about the trend.
A BEARISH trend signal does not mean we should not buy. A BULLISH trend signal does not mean you cannot sell some exposure. It depends on what is going on in the economy and how oversold/overbought the market is at a given point whether the Bearish signal is to be sold or bought, sold on the next bounce, etc. and whether a Bullish signal is to be bought or if profits should be taken. A NEUTRAL trend signal does not mean the end of the Bull or Bear. It means to wait and look for possible subsequent entry points within the existing trend, Bull or Bear, but preserve capital if the entry fails. Our strong intention is to buy low and sell high. By the way, I will keep showing the prior orange “Trigger lines” in the IWM and GLD charts for now as reference points only; they have historical value for us from the post-2016 election period.
Copyright © 2019 By Wall Street Sun and Storm Report, LLC All rights reserved.

Thank you David! Now we have an indication that the Trump administration talks with China have failed with the tariff announcements today! This is why this man has to be defeated!
I’ll play devil’s advocate. They have been bad actors unchallenged by prior wimpy administrations. The balance is the pain China can induce and when Trump will have to pull the plug to save himself politically. Being re-elected may mean the difference between Trump being a convicted criminal or not and so his eye has to ultimately land on the election ball.