A Market Timing Report based on the August 23, 2019 Close, published Saturday, August 24th, 2019…
I deliver focused comments on market timing once a week. These are supplemented with daily “Tweets/StockTwits” (see links below) and comments in the “markettiming” room on StockTwits.
I provide quite a bit of intraweek commentary, and if you don’t see it, you will miss out on quite a bit of context, so please click on the social media links below and have a read… Thank you as always for being loyal readers and interacting on social media with your questions and comments!
1. SP500 Index Market Timing (S&P 500 Index®; SPY, SPX):
At 10:59 am Friday President Trump tweeted out several tweets from his @realdonaldtrump account on Twitter, which ordered CEOs of U.S. companies to leave China to either find alternative sources for goods or better yet, bring the jobs home. This is what he said: HERE. These, of course, are jobs no American wants like repetitively putting cell phone components together many hours a day. This and a few other tweets along the same lines tanked the markets. The pressure continued for most of the day with a small lift into the close. Trump sent the market down 2.59% for the day.
Let’s next check my “Bull Market Health Score”…
What would satisfy me that the Bulls are serious?
Let’s check the list once again… The Bull Market Health Score this week? Bulls 0/Bears 5. At the end of July we were at Bulls 2.5/Bears 2.5. Last week it was Bulls 0.5/Bears 4.5
For each checklist item below, I give you the points scored as Bullish or Bearish.
1. New high? Bears 1.0 point. Answer: No. Last week I said:
“Bulls must retake S*PX 2943.31 and S*PY 294.15 to be convincing that the current correction is over at least in getting us back to a test of the prior ATH (all time high). (*’s added to throw off the ‘web crawlers’; it’s not my goal to become part of the ‘consensus.'”
The Bulls never made it over those numbers and the double two wave up pattern I predicted would occur last week, in fact happened as you see in the SPX chart below… The high was 2939.08 on Thursday. Close but no cigar! First is the wave down to the 8-05 low, then the two UP waves ending on 8-08 and 8-22, respectively. And now, we are in Wave 3 down, which could either be a Fibonacci multiple of Wave 1 (Wave 3 of 5) or simply a C wave in a three wave pattern. Either one of those would break the 8-05 low. More on the targets I’m looking for below…
2. VIX below the “Bull Nirvana Number” AND my bonus number? Bears 1.0 point. Answer: No. At the Friday close, the VIX was 19.87 vs. the prior week’s close at 18.47. The VIX Game Score as I call it is Bulls 0/Bears 8 as of the close Friday. There is plenty of more upside as the VIX pattern starts to look very much like the pattern in 2018 when the market crashed. It may not crash now, but don’t think it CANNOT happen (that would mean revisiting the December low as a possible target). The chart I shared on the VIX Volatility Index is HERE.
3. AD % Line in an Uptrend (proprietary stat; see base of report about this)?: Bears 1.0 point. Answer: No. It’s at 16,424 as of Friday vs. 16,446 last week. Lower highs are seen with a descending triangle, which is Bearish. Time-wise, it could take about 10 trading days to get back to the June low and that may not backstop the market. It could go faster if volatility spikes dramatically next week.
4. Volume on Up Moves? Bears 1 point. Answer: No. I said last week: “Volume also did not rise this past Friday on the rally, which makes it suspect. The summer cannot be blamed as this assessment is relative to recent volume numbers.” There has been NO volume confirmation of any of the up days in August. None.
5. The “U.S. Index Matrix Signal” (as I call it) Positive? Bears 1.0 point. Answer : No. I said last week there was a chance for a several day bounce in the markets, given the bounce of small and mid caps off the prior low, but that bounce really was only one day! The rest of it was a consolidation near the top, established on the first day. The matrix points the direction for the large caps, which is almost surely to revisit the prior August lows at a minimum.
As I said last week:
“The bounce that began on Friday could simply form a double 2 wave UP, meaning two bounce waves that reach the same level and lead to a larger 3rd wave down, which I call “The Big Red Wave.” That level of correction would take us down to 2694 or -11.0% from the all time high (ATH). Alternatively, the lower upward sloping SPX channel line (yellow in chart below) may hold. That level is rising over time as it’s an uptrend line, but for now is at 2760 [updated for Fri. close], or a drop of 8.9% from the ATH. The June low is in between those two numbers and is therefore a viable target as well.”
We are in “correction territory per my “New Rules.” The SP500 Index is now at -5.98% vs. the all time high on 7-26-19. My “New Rules” for market correction naming are HERE (scroll down to “New Rules”). This drop could stop at one of the above mentioned levels and would then bounce to another lower high, before falling once again to the final low, which could be at the December low or lower (Dec. low is the probable worst case at this time in my opinion – a big double bottom).
My definition of a correction is much more helpful than the standard 7-10% range. There are some drops of 3 to 5% over a few days that do NOT lead to a bigger correction or Mini Bear Market as I call them if they occur over several days. But a drop of 5% in SPX usually means more downside.
Recognize that sudden large drops are very negative however, especially when coming off a top. The drop on 8-05 was one of those and look at where we are – back to the same low.
The market could bounce at any time including Monday, but the odds favor more downside in my view…
Let’s ask what could CAUSE a sustained rally (rise of more than 2-3 days)? What are the “upside opportunities” as I call them:
1. The U.S. Federal Reserve lowers interest rates more quickly than suggested by their latest “mid-cycle adjustment” language. Not going to happen it seems short of financial instability of greater magnitude. The Federal Reserve’s Chair Powell just spoke on Friday at Jackson Hole, Wyoming and said the Fed is willing to ease, but is following the data, not Trump tweets. They see the U.S. as doing better than the rest of the world and are watching foreign markets and global economic slowing, but don’t feel it is directly threatening the U.S. I covered this in several messages Friday you should read HERE (and those above that one). The next Fed meeting is Sept. 17-18, a long time away in market terms. The Fed could act between meetings, yes, but Powell expressed zero urgency on Friday in his speech.
Should the Fed lower rates? I agree that the inverted yield curve says they CAN lower rates and get away with it without causing undue inflation, but whether it will do anything to demand for loans when rates are already very low is very arguable too. Fed Governor Esther George, a dissenting, voting FOMC member said on Thursday that rates were already near a zero real rate. Pushing them to negative she said, would not cause businesses to invest more. I agree. I think the whole emphasis on the Fed is just a back door tactic to weaken the U.S. dollar, which Trump is intent upon. Which brings me to….
2. The U.S. Treasury Intervenes to Weaken the U.S. Dollar
This would be taken very badly by the EU, China, etc. and they would simply respond with their own currency manipulations. That does not mean Trump won’t attempt it, and it could goose the market for a bounce, until the market realized the rest of the world would just print their own money in kind. Then the market would resume its fall. We lose buying power when the dollar falls by the way. In the late 1970’s the stock market was going up with the dollar going down such that in real terms, stock investors were LOSING MONEY.
Please do not buy into Trump’s talk that a weak dollar is “good.” It’s good for stock prices (Until it isn’t! Ask Argentina), not REAL, inflation adjusted wealth creation!
3. China, Europe, and Japan provide FISCAL STIMULUS to their economies. I am not saying they “should” do this, but it would help to create demand, while their debt levels rise. The German central bank says none is needed HERE. Japan has adopted stimulus programs while also raising tax rates as noted HERE. China has adopted new banking measures to free up more money for economic expansion. This is what they did: HERE. China is growing, but at a slowing rate: “Second-quarter economic growth slowed to a near 30-year low” per CNBC.
Trump is hurting the powerhouse of growth for the global economy and that directly impacts U.S. businesses who need NEW MARKETS to expand into such as China’s in order to grow. Look at what percentage growth China is vs. total global growth HERE. It is a BIG number. Hurt that and you hurt the U.S. China needs to play fair for sure, but the manner in which one negotiates with a long term partner does matter.
4. Trump’s U.S. China Trade War Ends: Fat chance that happens soon, although the threats are getting bigger and bigger at this point. Perhaps that alone will force a faster solution. Trump, after the Friday market close, now says he’ll see President #Xi and raise him 5%! HERE are the details (Sept. 1st tariffs are going from 10 to 15% and the 25% will go to 30% on Oct. 1st.).
The massive uncertainty this brings along with the direct hit to U.S. companies doing business in China is weighing on the markets. Ending it would result in a strong rally, which the market has been anticipating until now. The market may decide to “give up” on its hopes for a resolution, since all of the prior hopes have been dashed. The question for me is how much market pain Trump will endure until he decides to negotiate a deal.
Xi is facing pain as well and agreeing not to cheat is something the Chinese need to enter the world economy as a big player, which they are not in many ways. Financially, they are far behind, despite their population size. Creatively, they are laggards too in most areas, although they are making inroads in 5G tech, with 40 cities about to light up with 5G on Oct. 1st. China is beating the U.S. in the 5G rollout, which could mean a competitive disadvantage for the U.S. in developing the secondary and tertiary products related to 5G. Their cell phone companies are far ahead of the U.S. including Apple. This may be one big reason Trump is going after Huawei.
5. Timing is everything. Last week I said the Bull view could be:
“‘Things will be better on a comparative basis in Q4 2019 and Q1 2020, so buy stocks now.’ Just the comparative improvement in earnings and revenues, IF the world does not in fact slip into a recession, would help the stock markets globally. This is not only true in the U.S., but also is the case in Europe and China. The issue is whether further weakness for Q3 results will drive stocks down more before they recover.”
Let’s check in on the context around the price action of the market by looking at the current Market Risks…
No Earnings Update this week. No new data from FactSet.
Earnings Risk: what is shown are the projections in the FactSet 3-15-19 report followed by the reports from 4-12-19 through 8-09-19 (details HERE)… The last numbers for Q2 are numbers for the current reported earnings from 90% of SP500 Index companies to date. The arrows “—>” indicate 3 weeks of of omitted data in order to compress the data.
For Q2 2019, analysts are projecting earnings growth of 0.1% —> -1.3% -> —> -2.1% —> -2.6% -> -2.6% -> -3.0% -> -1.9% -> -2.6%-> -1.0% -> -0.7%
and revenue growth of 4.6% —> 4.3% —> 4.1% —> 3.8% -> 3.8% -> 3.7% -> 3.8% ->4.0% ->4.1% -> 4.1%
For Q3 2019, analysts are projecting earnings growth of 1.8% —> 0.8% —> 0.3% —> -0.5% -> -0.5% -> -0.8% -> -1.4% ->-1.9% -> -2.2% -> -3.1%
and revenue growth of 4.4% —> 4.4% —> 4.2% —> 3.8% -> 3.8% -> 3.3% -> 3.2% ->3.2% -> 3.1% -> 3.0%
For Q4 2019, analysts are projecting earnings growth of 8.1% —> 7.5% —> 7.2% —> 6.3% -> 6.3% -> 6.0% -> 5.4% ->4.9% -> 4.5% -> 3.9%
and revenue growth of 4.8% —> 4.8% —> 4.6% —> 4.3% -> 4.3% -> 4.2% -> 4.0% ->4.0%-> 4.5%-> 4.0% -> 4.0%
For CY 2019, analysts are projecting earnings growth of 3.4% —> 3.2% —> 2.7% -> 2.6% -> 2.4% -> 2.3% -> 1.7% -> 1.9% -> 1.5%
and revenue growth of 4.7% —> 4.7% —> 4.5% -> 4.4% -> 4.3% -> 4.4% ->4.4% -> 4.4% -> 4.3%
For Q1 2020, analysts are projecting earnings growth of 10.5% -> 10.7% -> 10.3 -> 9.9% -> 9.8% -> 9.5% ->9.2% –>9.0% -> 8.5%
and revenue growth of 6.2% -> 6.1% -> 6.0% -> 5.8% -> 5.8% -> 5.9% ->5.9% -> 5.7% -> 5.6%
For Q2 2020, analysts are projecting earnings growth of 13.3% -> 13.3% -> 12.9% -> 13.2% -> 13.5% -> 12.0% ->12.6% -> 10.7 -> 9.9%
and revenue growth of 6.8% -> 6.8% -> 6.6% -> 6.6% -> 6.6% -> 6.7% ->6.6% -> 6.5% -> 6.4%
I’ll leave this from 8-09:
Conclusion: It is still the case that earnings are weak (about flat) for the 2nd quarter in a row and are due to be negative for a third quarter (Q3 2019). The market is waking up to the fact that the Federal Reserve does not see the level of risk it sees! Hence, we have crashing 10 Year Treasury yields and falling stock markets around the world, when the Fed lowering rates aggressively should cause yields to rise at the long end.
Here’s a Brief Review of the Other Market Risks at Hand:
China Deal Risk: Has gotten far worse this week, as discussed. Very negative for sentiment, especially for businesses trying to plan.
U.S. Iran War Risk: Simmering at a low boil, and not over. Iran claimed to have fired “a new missile” on Thurs. without providing details.
Mueller Report/Trump Impeachment Risk: Ongoing. Read my analysis in the July 26th issue HERE.
2020 Election Risk: No important change. Probably the biggest risk to the markets and most Americans are oblivious to this from the markets’ point of view. I’ll stand by this: “The market will likely pull back at least 10-15% going into the election if the outcome is even unclear, meaning President Trump is NOT ahead by a wide margin (a likelihood, but not a certainty, depending on whether the Dems go for a “McGovern” candidate, as in Nixon-McGovern in 1972, a Democrat disaster.” Elizabeth Warren is the dark-horse progressive who may overrun Biden, which would be a potential gift for Trump. She does not have the name or experience of a Clinton who served as Sec. of State, which I believe a woman needs more than a man, like that or not. A President has the unsavory job of being a “killer” on the world stage. You have to be willing to kill an Osama bin Laden for example. Warren would lose to Trump in my view, even if it were a close election due to the Democrats making a huge effort to defeat Trump.
Biden is still in a much stronger position to take Trump. Here is my advice to V.P. Biden on tax policy, which he has not yet fully fleshed out: He’s already said he’ll raise the tax rates on those who make $500,000 to $1 M/year to the prior 39.6% (Obama rates). He should leave the estate tax limit where it is: 11.4 M.
Wealth taxes such as those suggested by Warren are crazy. What sense does it make for Americans to believe it is right that the government should simply take 2% of your wealth from you every year simply because you are worth over $50 M? I believe a majority of Americans would find that creepy government confiscation of wealth beyond the pale of usual tax policy. How in the world would you value a person’s real estate and businesses every year, when Wall Street cannot get valuation right???
Going back to V.P. Biden: He could also easily close the hedge fund tax loophole that lowers their tax rate from usual income tax rates. Trump and the GOP let the prior ridiculous tax rate stand despite Trump’s campaign trail talk! Swampland there for sure!
Biden would also have to keep corporate rates reasonably low. He could raise them from 21% back up to 25% and get away with it, but if he goes higher than that, the U.S. becomes less competitive globally. China is at 25% for example.
The EU? The Tax Foundation says: “Europe has the lowest regional average rate, at 18.38 percent (25.43 percent when weighted by GDP).” There you go. I think I nailed the correct number for the Democrats to argue: 25%.
Finally, he could adopt a limited “Wall Street Tax,” such as having a small tax on all HIGH FREQUENCY trades alone (could be just pennies per trade depending on the numbers), which would help reduce volatility is my guess. I’d want to study it first though, to be sure it would not impair liquidity excessively; I doubt it, but you’d want to prove it via study. Joe Biden could win based on that set of tax policies by even gaining the support of independents.
Deficit/Debt Threat: No important change. I’ll leave this here as a monument to our monumental debt: “They all see the problem and do nothing about it. They just keep spending. Per the NY Times: ‘Within a decade, more than $900 billion in interest payments will be due annually, easily outpacing spending on myriad other programs’ – that includes Defense and Medicare!”
Fed Rate Cut Risk: Fed Chair Powell gave the market nothing, as I tweeted on Friday. The delay until the next meeting means more risk for the stock market.
Now take a look at the SP500 chart.
SP500 Large Cap Index (click chart to enlarge; SPX, SPY):
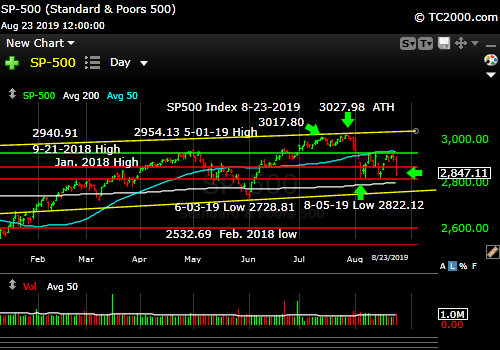
Third wave down. It could be another “Big Red Wave.”
Now let’s check in on two “Canary Signals” we’ve been following:
“Intel-igent Market Timing Signal” (Intel; INTC): Negative. Actually AWFUL. Just broke the Aug. low on high volume and is headed to the May low for starters at least. Trump has to fix the China Trade War soon, and if he did, Intel would benefit from that. A rise with volume above the 47.60 level would be the first step in a “pop.”
Bank of America (BAC) Market Timing Signal: Negative. Very negative, testing the June low and already below the March low on high volume.
Last week:
“Notice both canaries are positioned for a rally? But they must hold current support – or else. That’s called a pivot point.”
Pivots go up or they go down. This one went down hard.
Keep up-to-date during the week at Twitter and StockTwits (links below) where a combined 34,101 investors are following the markets with me…
Follow Me on Twitter® Follow Me on StockTwits®.
Join the Conversation in the StockTwits “MarketTiming” Room
Now let’s go on to review investor sentiment…
Survey Says!
Sentiment of individual investors (AAII.com) showed a Bull minus Bear percentage spread of -13.08% this week vs. -21.67% last week . From 2 weeks ago: “The low in Sentiment in December was -28% for the poll ending on 12-12-18, but the price low was on December 26th intraday. Sentiment has room to become more extreme, but the December comparison says to me there is more room for a further decline in the SP500 Index ahead, even if sentiment does not worsen.”
ONCE AGAIN: “This is the same pattern as the December pattern. Sentiment FELL after it peaked as the price of SPX fell. Not a big help for the Bulls.” In December, the spread two weeks after the high negative spread of -28% was -18.8% per AAII. This week’s value of -13.08% is close enough to say the Bulls are likely looking at more downside.
| Bulls | Neutrals | Bears |
| 26.64% | 33.64% | 39.72% |
| Thurs. 12 am CT close to poll | ||
2. U.S. Small Caps Market Timing (IWM):
Last week I said: “A trade perhaps, even if a quick one off the June low. They are higher beta, so they’ll fall harder in a further market decline. I’d rather stick to large caps at this point, but the small cap trade could work out. Use a stop. ;)”
Well, if you bought the open last Monday, you did not make much even if you sold the Mon. high or that of the next 3 days. Stay clear of small caps unless you have some system of allocating capital that tells you otherwise. Sure they could bounce Monday, or even for a few days, but without a strong catalyst like a “U.S. China Trade War Resolution,” they are likely to break still lower. Note the big volume spike on Friday on the selloff in the chart below…
Russell 2000 U.S. Small Cap Index (click chart to enlarge; IWM, RUT):

Stay out. That bottom may not hold.
3. Gold Market Timing (GLD):
I said on 7-26-18: “Still a Bull. Add on dips.” I bought some more gold stock exposure last week on the dips, and many of those are already off to the races. Gold and gold stocks are not done until rates have a clear reason(s) to move higher. Buy dips! Try not to chase, or if you do, add much less. Then add more on dips. Although the extent of the price breakout was slight on Friday, raising some suspicion about what gold will do next, there was strong volume behind it. I added a bit more on Friday as well (but walked my talk of “adding less” on breakouts).
Once you have a trend, buy the dips in the trend. It’s that simple. If you complicate it with “What if this? What if that?” you’ll miss out on HUGE profits. My GDX position just established in April and May 2019 is about +35%. Had I exited on the shallow pullbacks in June, July, and August, that would not be the case.
The Gold ETF (click chart to enlarge the chart; GLD):
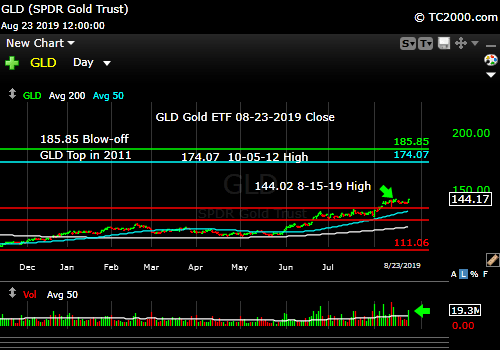
Gold has more upside.
4. Interest Rate Market Timing (10 Year Treasury Yield; TNX, IEF, TLT):
As I said Monday Aug. 5th: “The 10 Year Treasury Yield is still crashing, down 8.0 basis points just for Monday, which is a very bad sign for the stock market, and a very good sign for gold/gold stocks. I exited TLT early, but did so knowing I still had exposure to long municipal bonds and gold/gold stocks as hedges.”
Last week: “If the economy worsens from here, there will be more upside for TLT etc. If not and/or if Powell cuts rates aggressively, watch out below. Long rates will rise and bonds will be hurt. If he does it too slowly, long rates may fall further.”
In short, there has been further panic. Things are so extreme that the TNX chart is starting to look weird! This is a continuing rate crash, and some Bears are saying the TNX could reach zero. I cannot rule that out, but I think that is extreme for now unless Trump enacted those huge tariffs, in which case, the rate Bulls would win big. TNX 13.36 is the next downside target (means 1.336%). I believe the Treasury Bulls will see that target hit. There are upside risks for rates in the wings I have discussed above.
Of note is the dollar falling on Friday AS RATES FELL. That’s not been the recent pattern. The dollar has benefited until now from falling rates as money has poured into the US dollar via Treasury purchases with foreign currency as well as dollars. The rumor via Trump tweet hinting that the U.S. Treasury could deliberately attack the USD sent the greenback down on Friday.
By the way, late Friday, Steve Leisman @CNBC spoke to Federal Reserve Vice Chair Richard Clarida who said trying to force the yield curve into submission would likely fail due to the size of market forces driving it down. Even if the Fed lowered rates next week by 0.50% (50 basis points), rates would likely decline over the intermediate term – after a big bounce though! There is plenty of room for rates to bounce given any excuse in the near term.
Check out the “Market Signal Summary” below – after you review the following chart…
U.S. 10 Year Treasury Note Yield (click chart to enlarge; TNX, IEF, TYX, TLT, TBF):

Yields crash further!
Now let’s review three key market timing signals together….
Do not use these signals as a trading plan. They are rough guidelines. I currently share my BUYS and SELLS in as timely a way as possible on social media (links above).
MY MARKET SIGNAL AND TREND SUMMARY for a Further U.S. Stock Market Rally with Real GDP Growth (“Real” means above inflation):
Stock Signal RED for a further U.S. stock market rally with a Bearish SP500 Index trend. The stock signal is based on small caps, as they often lead the market down.
The V*IX (which relates to SPX volatility; * added to symbol to throw off the webcrawlers!) These are the targets: 13.31, 14.04-14.08, 15.04, the “fulcrum” range = [15.94-15.95 to 16.09], 17.06, 17.27, and 17.89. The bonus target #8 is [12.-17-12.37]. The Bears have 8 of 8 targets at a VIX of 19.87 (Friday close). I consider the “fulcrum” the key decision point that turns the market from Bearish to Bullish, when the VIX falls below that entire fulcrum range.
The ‘Bull Nirvana Target’ is our V*IX # of 2018: 13.31.” (That is target #7 for the Bulls.)
Gold Signal RED for a further U.S. stock market rally with a BULLISH Gold Trend. What gold does mostly as I’ve written HERE is follow real interest rates.
From before: “Remember GLD is being used as an indicator for the ECONOMY here.” If gold continues to rise, it means the market believes real rates will fall, which in the current context means the global economy is slowing. That will ultimately hurt U.S. stocks.
Rate Signal RED for a further stock market rally with a BEARISH 10 Year Yield Trend.
For Reference: “Rates usually RISE slowly in a strong recovery and the stock market rally continues as they rise, as I’ve repeated multiple times on social media and here. Empirically though, rates that are “lower” (than 3.11%) and are NOT rising rapidly have allowed the market to climb back above the prior all time high (ATH).”
I said weeks ago, “Watch the oil price too. Higher oil tends to mean higher rates.” It closed at 54.17 this week vs. 54.81 last week but in a Bearish descending triangle falling toward the June low. I was right that oil was falling over last week.
Just a reminder (not a current problem, because rates are “too low” now on a relative basis): If TNX bounces too quickly and too high, this will give rise to Rate Shock III… As said before: “Watch the rate at which TNX climbs if the current trend reverses. If it shoots up very fast, stocks will correct.” In the Sept. 28th issue: “A rapid push higher in rates would mean trouble for stocks, as occurred in early 2018. That’s what I called ‘Rate Shock.'” The period of rising rates in early October I called #RateShockII.
The risk lately has been “Negative Rate Shocks.” (Not negative rates in the U.S. yet! “Negative” refers to the direction of the shock.) First we had “Negative Rate Shock I” in December 2018 (because rates FELL while the Fed raised the Fed Funds rate 0.25% in mid-December, in what was perceived as a policy error), “Negative Rate Shock II” in May, and “Negative Rate Shock III” in August, which is continuing still!
Thank you for reading. Would you please leave your comments below where it says “Leave a Reply”… or ask a question or report a typo…
Pay it forward by sending the link to MarketTiming.Blog (that link will immediately connect them to this webpage) to a relative or friend. Thanks for doing that.
Be sure to visit the website for more general investing knowledge at:
Standard Disclaimer: It’s your money and your decision as to how to invest it.
I thank Worden Brothers for the charting system I use to post these charts. If you want to know more about the charting system I use every day, contact me. It makes it much easier to follow along with me if you can see the charts and manipulate them on your own computer. It’s a great investment to have an excellent charting system.
Note: I’ve updated my criteria for the equity signal for a further U.S. stock market rally to the following: GREEN = Bullish, YELLOW = Neutral, RED = Bearish. In other words, the colors tell you whether the signal supports the stock rally or not, while the Bullish, Neutral, and Bearish designations are about the trend.
A BEARISH trend signal does not mean we should not buy. A BULLISH trend signal does not mean you cannot sell some exposure. It depends on what is going on in the economy and how oversold/overbought the market is at a given point whether the Bearish signal is to be sold or bought, sold on the next bounce, etc. and whether a Bullish signal is to be bought or if profits should be taken. A NEUTRAL trend signal does not mean the end of the Bull or Bear. It means to wait and look for possible subsequent entry points within the existing trend, Bull or Bear, but preserve capital if the entry fails. Our strong intention is to buy low and sell high. By the way, I will keep showing the prior orange “Trigger lines” in the IWM and GLD charts for now as reference points only; they have historical value for us from the post-2016 election period.
Copyright © 2019 By Wall Street Sun and Storm Report, LLC All rights reserved.

Very nice! Thanks
Glad you enjoyed the read!