A Market Timing Report based on the August 30, 2019 Close, published Saturday, August 31th, 2019…
I deliver focused comments on market timing once a week. These are supplemented with daily “Tweets/StockTwits” (see links below) and comments in the “markettiming” room on StockTwits.
I provide quite a bit of intraweek commentary, and if you don’t see it, you will miss out on quite a bit of context, so please click on the social media links below and have a read… Thank you as always for being loyal readers and interacting on social media with your questions and comments!
1. SP500 Index Market Timing (S&P 500 Index®; SPY, SPX):
Let’s first check my “Bull Market Health Score”…
What would satisfy me that the Bulls are serious?
Let’s check the list once again… The Bull Market Health Score this week = Bulls 0/Bears 5. Last week we were at Bulls 0/Bears 5, so there’s been no progress. At the end of July we were at Bulls 2.5/Bears 2.5.
For each checklist item below, I give you the points scored as Bullish or Bearish.
1. New high? Bears 1.0 point. Answer: No. Two weeks ago I said:
“Bulls must retake S*PX 2943.31 and S*PY 294.15 to be convincing that the current correction is over at least in getting us back to a test of the prior ATH (all time high). (*’s added to throw off the ‘web crawlers’; it’s not my goal to become part of the ‘consensus.'”
The Bulls got to 2940.43 this week and closed at 2926.46. Close but no cigar as they say. SPY got to 294.24 and closed at 292.45. The number above remain the hurdles. The test this past week proves my numbers are right. They have been “anointed by the market” so to speak.
2. VIX below the “Bull Nirvana Number” AND my bonus number? Bears 1.0 point. Answer: No. At the Friday close, the VIX was 18.98 vs. the prior week’s close at 19.87. The VIX Game Score as I call it is Bulls 0/Bears 8 as of the close Friday (Game Numbers can be found at the base of this report). Fear is still high.
Look at the potential for more VIX (fear) upside: The chart I shared on the VIX Volatility Index is HERE.
3. AD % Line in an Uptrend? (This is a proprietary stat; see base of report.): Bears 1.0 point. Answer: No. It almost reached the prior high of late July of 16,632 this past Friday, but topped out at 16,605 and closed at 16,555. Nevertheless, the close was higher than that of the last three weeks.
The Bulls could pivot up on better news, but they’ll need something more than Trump jawboning on the ever elusive China deal. Why do I say that? Because the “talk about trade talks” has not won the market a high above the past two lower highs…and now we have 3 of those highs lined up. The Bulls can point to the marginal good news in the chart, which shows the last low was higher than the prior two lows. It’s a rough ascending triangle, which tends to resolve more often to the upside.
4. Volume on Up Moves? Bears 1 point. Answer: No. Volume did go up slightly on Friday, which was an end of month trading day, but the SP500 Index closed off its high and was up only 0.06%, so most of that small volume bump was distribution at the top of the recent range. The most impressive volume has been DOWNSIDE volume on the down days in late July and early August.
5. The “U.S. Index Matrix Signal” (as I call it) Positive? Bears 1.0 point. Answer : No. The small caps fortunately recovered from a test below the May low, which only occurred for one day on the close of 8-27-19. They have still lagged the large caps tremendously ever since June of 2018!
I said two weeks ago:
“The bounce that began on Friday could simply form a double 2 wave UP, meaning two bounce waves that reach the same level and lead to a larger 3rd wave down, which I call “The Big Red Wave.” That level of correction would take us down to 2694 or -11.0% from the all time high (ATH). Alternatively, the lower upward sloping SPX channel line (yellow in chart below) may hold. That level is rising over time as it’s an uptrend line, but for now is at 2760 [updated for Fri. close], or a drop of 8.9% from the ATH. The June low is in between those two numbers and is therefore a viable target as well.”
What we see now is THREE lower highs with lower lows for the small caps and slightly higher lows for the large caps. That does not change the technical picture. The Bulls have to come up with a better bounce soon, or we’ll descend into Wave 3 Down, the “Big Red Wave.”
What are the “upside opportunities” as I call them? Let’s ask what could cause or substantially contribute to a sustained rally (a rise of more than 2-3 days)?
1. The U.S. Federal Reserve lowers interest rates more quickly than suggested by their latest “mid-cycle adjustment” language.
Last week: “Not going to happen it seems, short of financial instability of greater magnitude…. The next Fed meeting is Sept. 17-18, a long time away in market terms. The Fed could act between meetings, yes, but Powell expressed zero urgency in his speech at Jackson Hole.”
The economic picture would have to worsen, not that the slowing in manufacturing is not already apparent to the Federal Reserve. Even Services and Consumer Sentiment are slipping.
From August U.S. Data: “IHS Markit US Manufacturing PMI dropped to 49.9 in August 2019 from 50.4 in the previous month.” Below 50 is contractionary. Chart is HERE. “The ISM Non-Manufacturing PMI for the United States dropped to 53.7 in July 2019 from 55.1 in the previous month.” Chart is HERE. Still above 50, so services are expanding, but in a falling trend.
The Consumer is not quite as happy as seen in an Aug. 30th report: “The University of Michigan’s consumer sentiment for the US was revised lower to 89.8 in August 2019 from a preliminary estimate of 92.1 and well below the previous month’s final 98.4. It was the lowest reading since October 2016.” The Chart is HERE.
Building Permits are positive (low interest rates help a lot) as shown HERE.
How much weakening it will take to move the Fed to more aggressive cuts is not known. They did not lower rates 50 basis point the first time they lowered in July, so we’ll assess their response on Sept. 18th with the full set of Fed projections, their statement, and of course, the dog and pony show (a.k.a. news conference with Chair Powell). Again, short of a perceived crisis before then, they will not act between meetings.
2. The U.S. Treasury Intervenes to Weaken the U.S. Dollar
As said previously: “This would be taken very badly by the EU, China, etc. and they would simply respond with their own currency manipulations. That does not mean Trump won’t attempt it, and it could goose the market for a bounce, until the market realized the rest of the world would just print their own money in kind. Then the market would resume its fall. We lose buying power when the dollar falls by the way. In the late 1970’s the stock market was going up with the dollar going down such that in real terms, stock investors were LOSING MONEY.”
3. China, Europe, and Japan provide FISCAL STIMULUS to their economies. I detailed in last week’s issue (link to upper right) that China and Japan are doing some things that could help.
4. Trump’s U.S. China Trade War Ends: Last week I said:
…”the threats are getting bigger and bigger at this point. Perhaps that alone will force a faster solution. Trump, after the Friday market close, now says he’ll see President #Xi and raise him 5%! HERE are the details (Sept. 1st tariffs are going from 10 to 15% and the 25% will go to 30% on Oct. 1st.).”
That turned out to be correct it appears from comments made this week by both sides. They are going to meet “at a higher level” as Trump put it and will be talking this coming week. Clothing manufacturers are going to be hit with those Sept. 1 tariffs, while other favored companies like Apple will have their tariffs delayed at least until Dec. 15th, so most of Christmas won’t be impacted. That would have been an earnings disaster. As it is, some retailers will have to lower their numbers. If the higher tariffs go into effect, I would expect consumers to react very negatively to price increases and GDP growth to slow further.
5. Timing is everything. Two weeks ago (and this is still a major theme I’ve been hearing) I said the Bull view could be:
“‘Things will be better on a comparative basis in Q4 2019 and Q1 2020, so buy stocks now.’ Just the comparative improvement in earnings and revenues, IF the world does not in fact slip into a recession, would help the stock markets globally. This is not only true in the U.S., but also is the case in Europe and China. The issue is whether further weakness for Q3 results will drive stocks down more before they recover.”
Let’s check in on the context around the price action of the market by looking at the current Market Risks…
We have some new earnings data this week…
Earnings Risk: what is shown are the projections in the FactSet 3-15-19 report followed by the reports from 4-12-19 through 8-09-19 with a skip of two weeks until the 8-30-19 data (details HERE)… The last numbers for Q2 are numbers for the current reported earnings from 99% of SP500 Index companies to date. The arrows “—>” indicate 3 weeks of of omitted data in order to compress the data.
For Q2 2019, analysts are projecting earnings growth of 0.1% —> -1.3% -> —> -2.1% —> -2.6% -> -2.6% -> -3.0% -> -1.9% -> -2.6%-> -1.0% -> -0.7% -> -0.4%
and revenue growth of 4.6% —> 4.3% —> 4.1% —> 3.8% -> 3.8% -> 3.7% -> 3.8% ->4.0% ->4.1% -> 4.1% -> 4.0%
For Q3 2019, analysts are projecting earnings growth of 1.8% —> 0.8% —> 0.3% —> -0.5% -> -0.5% -> -0.8% -> -1.4% ->-1.9% -> -2.2% -> -3.1% -> -3.5%
and revenue growth of 4.4% —> 4.4% —> 4.2% —> 3.8% -> 3.8% -> 3.3% -> 3.2% ->3.2% -> 3.1% -> 3.0% -> 3.1%
For Q4 2019, analysts are projecting earnings growth of 8.1% —> 7.5% —> 7.2% —> 6.3% -> 6.3% -> 6.0% -> 5.4% ->4.9% -> 4.5% -> 3.9% -> 3.5%
and revenue growth of 4.8% —> 4.8% —> 4.6% —> 4.3% -> 4.3% -> 4.2% -> 4.0% ->4.0%-> 4.5%-> 4.0% -> 4.0% -> 4.0%
For CY 2019, analysts are projecting earnings growth of 3.4% —> 3.2% —> 2.7% -> 2.6% -> 2.4% -> 2.3% -> 1.7% -> 1.9% -> 1.5% -> 1.5%
and revenue growth of 4.7% —> 4.7% —> 4.5% -> 4.4% -> 4.3% -> 4.4% ->4.4% -> 4.4% -> 4.3% -> 4.4%
For Q1 2020, analysts are projecting earnings growth of 10.5% -> 10.7% -> 10.3 -> 9.9% -> 9.8% -> 9.5% ->9.2% –>9.0% -> 8.5% -> 8.2%
and revenue growth of 6.2% -> 6.1% -> 6.0% -> 5.8% -> 5.8% -> 5.9% ->5.9% -> 5.7% -> 5.6% -> 5.7%
For Q2 2020, analysts are projecting earnings growth of 13.3% -> 13.3% -> 12.9% -> 13.2% -> 13.5% -> 12.0% ->12.6% -> 10.7 -> 9.9% -> 9.3%
and revenue growth of 6.8% -> 6.8% -> 6.6% -> 6.6% -> 6.6% -> 6.7% ->6.6% -> 6.5% -> 6.4% -> 6.5%
You can see that earnings projections for Q3 2019 are coming down and so are earnings out to 2020, although the comparisons are going to be easier vs. the prior year in 2020.
Here’s a Brief Review of the Other Market Risks at Hand:
China Deal Risk: Has improved slightly, simply because the situation cannot get worse without sending China and the U.S. down the tubes together.
U.S. Iran War Risk: Simmering at a low boil, and not over. France is trying to broker a deal between Trump and the Iranian leadership.
Mueller Report/Trump Impeachment Risk: Ongoing. Read my analysis in the July 26th issue HERE.
2020 Election Risk: No important change. Probably the biggest risk to the markets and most Americans are oblivious to this from the markets’ point of view. I’ll stand by this: “The market will likely pull back at least 10-15% going into the election if the outcome is even unclear, meaning President Trump is NOT ahead by a wide margin (a likelihood, but not a certainty, depending on whether the Dems go for a “McGovern” candidate, as in Nixon-McGovern in 1972, a Democrat disaster.”
Elizabeth Warren is the biggest threat to Biden. She’s too liberal to win the election in my view, depending on how poorly Trump behaves going into the election of course. If the economy does not perk up soon with the China Trade War behind Trump, he’ll have no chance in a run against Biden.
Deficit/Debt Threat: No important change. I’ll leave this here as a monument to our monumental debt, which could threaten interest rates in the future. The only reason we are off the hook for now is because the rest of the world is in worse shape.
Fed Rate Cut Risk: I discussed this above on the “upside opportunity” list. The delay until the next meeting means more risk for the stock market. Federal Reserve Chair Powell gave no hint he’ll either act aggressively or act between meetings.
Now take a look at the SP500 chart. The green line is 2940.91, the
9-21-2018 High, which preceded the decline from Sept. to December 24th.
SP500 Large Cap Index (click chart to enlarge; SPX, SPY):

Third top. Is that it for the Bulls?
Now let’s check in on two “Canary Signals” we’ve been following:
“Intel-igent Market Timing Signal” (Intel; INTC): Neutral. Would benefit from trade war resolution. A rise with volume above the 47.60 level would be the first step in a “pop.” Close Fri. was 47.41. Same position as the overall market (up at a much lower high in the case of Intel).
Bank of America (BAC) Market Timing Signal: Neutral but off the prior low, as is Intel. It has a series of higher lows going for it, but also a double top at 31.17. Close Fri. was 27.51, so there is upside in the recent range. The major influence on it will be interest rates.
Keep up-to-date during the week at Twitter and StockTwits (links below) where a combined 34,101 investors are following the markets with me…
Follow Me on Twitter® Follow Me on StockTwits®.
Join the Conversation in the StockTwits “MarketTiming” Room
Now let’s go on to review investor sentiment…
Survey Says!
Sentiment of individual investors (AAII.com) showed a Bull minus Bear percentage spread of -16.08% this week vs. -13.08% last week . As I’ve been saying, the pattern is similar to that of December, despite the fact that the price range has not had nearly as much downside.
Sentiment has to break to the single digits to tell us a new rally could be starting. Unfortunately, the signal could be a week late, as sentiment is only assessed once a week. The current sentiment level is actually a bit worse since last week, which is odd for a rising market. Overall this level of sentiment is not very predictive, since it is not at an extreme.
| Bulls | Neutrals | Bears |
| 26.13% | 31.66% | 42.21% |
| Thurs. 12 am CT close to poll | ||
2. U.S. Small Caps Market Timing (IWM):
Making lower highs and lower lows still. Horrific relative performance vs. large caps, where investors are seeking safety.
Russell 2000 U.S. Small Cap Index (click chart to enlarge; IWM, RUT):
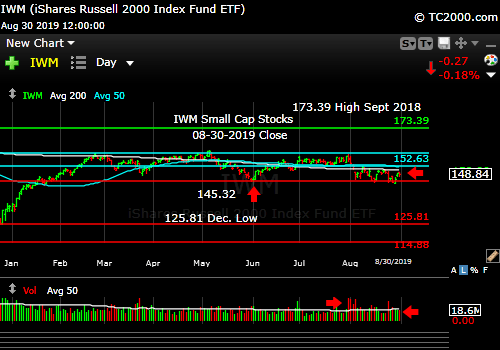
Small caps making lower highs and trailing large caps in a big way.
3. Gold Market Timing (GLD):
I said on 7-26-18: “Still a Bull. Add on dips.” If you have no exposure, you should do your best to buy more on dips than on rips. Interest rates have not declared yet how they will pivot, although banks are up off their June lows. The gold and gold stock up trend is still intact and with the Federal Reserve hinting at more accommodation, even if just 3 rate cuts, gold may continue its rally. A China Trade War resolution could hurt gold somewhat by lowering uncertainty, but as long as the global economy is still shaky and weakening along with interest rates, gold will do well.
The eventual inflection point in inflation (UP) and U.S. economic growth (UP) is what we need to pay attention to. Any sense that the Fed will end its series of interest rate cuts could trigger a gold sell-off.
The Gold ETF (click chart to enlarge the chart; GLD):
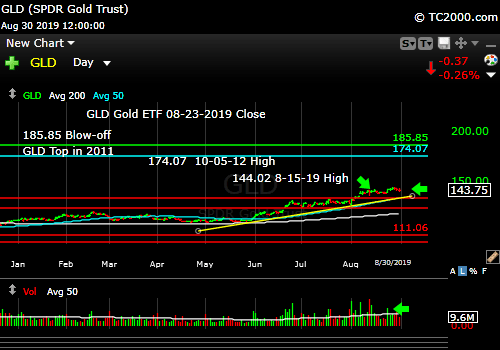
Still an uptrend.
4. Interest Rate Market Timing (10 Year Treasury Yield; TNX, IEF, TLT):
There has been no sign of a definite bounce, so I added some one year CD exposure on Friday morning. It’s doubtful the market will be making new highs if rates continue down. If they stabilize at current levels, that alone could help.
The dollar went to a new high this week, because our interest rates, although low, are better than those elsewhere in the world. Tom Lee made a good point last week on CNBC when he said the yield curve inversion this time is occurring in a context that is different from that associated with past recessions. The Fed normally has hiked rates prior to a recession as the economy expanded, which would then eventually invert the yield curve. The last time it hiked was in December, 2018, which was considered a policy error by critics. It is now lowering rates, and long rates are still inverted vs. short rates. To right the curve, the Fed would have to cut faster.
The Fed clearly has room to cut rates again without having to worry much about inflation, at least for now. Whether that would actually help much at all beyond “calming Central Bank intervention addicts” is unclear. Businesses are not going to make different investment decisions by and large as the Fed’s Gov. Esther George pointed out recently, with the 10 Year at 1.5% vs. 1.2%, except maybe to decide to inflate asset prices by borrowing at low rates and buying back their stock. That is a non-productive use of capital. It’s not the Fed’s job to inflate the stock, bond, and real estate markets. In fact, we’ve already “been there, and done that.” It was called “The Great Recession”!
Check out the “Market Signal Summary” below – after you review the following chart…
U.S. 10 Year Treasury Note Yield (click chart to enlarge; TNX, IEF, TYX, TLT, TBF):
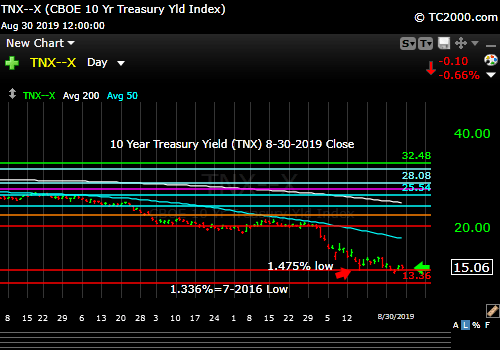
Rates still have not bounced appreciably.
Now let’s review three key market timing signals together….
Do not use these signals as a trading plan. They are rough guidelines. I currently share my BUYS and SELLS in as timely a way as possible on social media (links above).
MY MARKET SIGNAL AND TREND SUMMARY for a Further U.S. Stock Market Rally with Real GDP Growth (“Real” means above inflation):
Stock Signal RED for a further U.S. stock market rally with a Bearish SP500 Index trend. The stock signal is based on small caps, as they often lead the market down. Until the SPX attains that first goal mentioned above, I’ll keep calling it Bearish.
The V*IX (which relates to SPX volatility; * added to symbol to throw off the webcrawlers!) These are the targets: 13.31, 14.04-14.08, 15.04, the “fulcrum” range = [15.94-15.95 to 16.09], 17.06, 17.27, and 17.89. The bonus target #8 is [12.-17-12.37]. The Bears have 8 of 8 targets at a VIX of 18.98 (Friday close). I consider the “fulcrum” the key decision point that turns the market from Bearish to Bullish, when the VIX falls below that entire fulcrum range.
The ‘Bull Nirvana Target’ is our V*IX # of 2018: 13.31.” (That is target #7 for the Bulls.)
Gold Signal RED for a further U.S. stock market rally with a BULLISH Gold Trend. What gold does mostly as I’ve written HERE is follow real interest rates.
From before: “Remember GLD is being used as an indicator for the ECONOMY here.” If gold continues to rise, it means the market believes real rates will fall, which in the current context means the global economy is slowing. That will ultimately hurt U.S. stocks.
Rate Signal RED for a further stock market rally with a BEARISH 10 Year Yield Trend. (Remember: lower rates mean higher bond and Treasury prices)
For Reference: “Rates usually RISE slowly in a strong recovery and the stock market rally continues as they rise, as I’ve repeated multiple times on social media and here. Empirically though, rates that are “lower” (than 3.11%) and are NOT rising rapidly have allowed the market to climb back above the prior all time high (ATH).”
I said weeks ago, “Watch the oil price too. Higher oil tends to mean higher rates.” It closed at 55.10 this week vs. 54.17 last week but in a Bearish descending triangle falling toward the June and August lows.
Just a reminder (not a current problem, because rates are “too low” now on a relative basis): If TNX bounces too quickly and too high, this will give rise to Rate Shock III… As said before: “Watch the rate at which TNX climbs if the current trend reverses. If it shoots up very fast, stocks will correct.” In the Sept. 28th issue: “A rapid push higher in rates would mean trouble for stocks, as occurred in early 2018. That’s what I called ‘Rate Shock.'” The period of rising rates in early October I called #RateShockII.
The risk lately has been “Negative Rate Shocks.” (Not negative rates in the U.S. yet! “Negative” refers to the direction of the shock.) First we had “Negative Rate Shock I” in December 2018 (because rates FELL while the Fed raised the Fed Funds rate 0.25% in mid-December, in what was perceived as a policy error by critics), “Negative Rate Shock II” in May, and “Negative Rate Shock III” in August, which is on pause and awaiting the next pivot.
Thank you for reading. Would you please leave your comments below where it says “Leave a Reply”… or ask a question or report a typo…
Pay it forward by sending the link to MarketTiming.Blog (that link will immediately connect them to this webpage) to a relative or friend. Thanks for doing that.
Be sure to visit the website for more general investing knowledge at:
Standard Disclaimer: It’s your money and your decision as to how to invest it.
I thank Worden Brothers for the charting system I use to post these charts. If you want to know more about the charting system I use every day, contact me. It makes it much easier to follow along with me if you can see the charts and manipulate them on your own computer. It’s a great investment to have an excellent charting system.
Note: I’ve updated my criteria for the equity signal for a further U.S. stock market rally to the following: GREEN = Bullish, YELLOW = Neutral, RED = Bearish. In other words, the colors tell you whether the signal supports the stock rally or not, while the Bullish, Neutral, and Bearish designations are about the trend.
A BEARISH trend signal does not mean we should not buy. A BULLISH trend signal does not mean you cannot sell some exposure. It depends on what is going on in the economy and how oversold/overbought the market is at a given point whether the Bearish signal is to be sold or bought, sold on the next bounce, etc. and whether a Bullish signal is to be bought or if profits should be taken. A NEUTRAL trend signal does not mean the end of the Bull or Bear. It means to wait and look for possible subsequent entry points within the existing trend, Bull or Bear, but preserve capital if the entry fails. Our strong intention is to buy low and sell high. By the way, I will keep showing the prior orange “Trigger lines” in the IWM and GLD charts for now as reference points only; they have historical value for us from the post-2016 election period.
Copyright © 2019 By Wall Street Sun and Storm Report, LLC All rights reserved.

Thanks David!
You are welcome Charles!