A Market Timing Report based on the September 20, 2019 Close, published Saturday, September 21st, 2019…
I deliver focused comments on market timing once a week. These are supplemented with daily “Tweets/StockTwits” (see links below) and comments in the “markettiming” room on StockTwits.
I provide quite a bit of intraweek commentary, and if you don’t see it, you will miss out on quite a bit of context, so please click on the social media links below and have a read… Thank you as always for being loyal readers and interacting on social media with your questions and comments!
1. SP500 Index Market Timing (S&P 500 Index®; SPY, SPX):
My indicators are mostly aligned this week in proclaiming the recent highs the top of the current move off the August 5th low. But there are some interesting things going on under the hood.
1. Only Utilities (XLU) are now outperforming the SP500 Index vs. the August 5th low (this does not take dividends into account, but utilities have some of the higher dividend yields). With the Fed due to lower rates at least once more, they could rally further. Add to that earnings weakness for Q3 arriving in mid-October, and you could have a few more weeks of relative outperformance by utilities.
2. Heath care (XLV) has been doing the worst off the August 5th low. Reading the tea leaves around the 2020 Election contest is hard, and when Wall Street finds confusion, it tends to avoid a sector. Of course, right on cue, XLV bounced at the end of the week. In the end, drug and device companies could suffer a slightly worse fate than the current state or one far worse if they mess this up.
Drug/device companies can negotiate and must end up providing better overall prices (they must; both parties agree on this at least in theory minus Moscow Mitch McConnell who stands in the way of drug price regulations with some pals in the Senate who are in the pockets of the drug/device companies) as well as support their profits by serving a larger population of patients.
In the end, drug/device companies will take some sort of hit though as our pricing is so much higher than prices offered abroad by these same companies. Medicare for All would be a disaster for hospitals, because they depend on NON-Medicare pricing to actually pay for everything. Bernie Sanders’ plan throws the hospitals a few billion dollars to help them not go bankrupt. Medicare for All would be electroshock therapy for the healthcare system, and you do realize how much fun that is? Reform won’t happen as “Medicare for All.” It must happen incrementally. Biden has the right model in terms of the broad strokes.
Taxes on the “rich” will go back to the Obama rates with another boost on those who make over 1 Million per year perhaps with closed loopholes to jack up their tax rates. For example, they may place a limit on the amount of capital gains that can be taxed at the lowest rates. Realize this could cause turbulence in the stock market, when the ultra-wealthy sell before the next Dem President arrives, whether that is in 2020 or 2024.
3. Everything else including XLK (Tech sector of SPX) is barely above the market in the case of XLK or very close to SPX in performance.
4. Gold and gold stocks have been in a pullback timed exactly with the rate bump that started guess when? Sept. 5th. What’s with the 5th? 😉 That is when the SP500 Index broke out above a critical level after spending August in stock purgatory in a consolidation range. That is the signal we were looking for to void the “immediate Wave 3 Down” scenario for the SP500 Index. Rates up, stocks up, gold and gold stocks down has been the recent dance, because interest rates had simply fallen too far, too fast. In fact, TLT fell below where I sold it on 8-6 (at 139.13 and 139.21 before it peaked), and is now just above there at 141.89. I’ve added back part of that exposure.
Gold and gold stocks are beginning to recover in my view, just as the SP500 Index is making a slightly lower high than the all time high of 3027.98. You can see in the GLD chart below that it is sliding up the trend line. There was no breach of any consequence. We are staying with the trend until it changes! (Read the issue two weeks back ; see upper right for link on an investing “gem” I shared with loyal readers)
This week’s requirements for a strong stock market moving to new highs…
A. “Earnings growth resuming in Q4 2019 into 2020.” I had this here last week, but let’s look at the 2015-2016 slowing in earnings as a comparison. There was a Q4 2015 to Q2 2016 earnings slowing in the SP500 Index. There was an initial SPX pullback that spanned 8-20-15 to 9-29-15. The first negative earnings were reported in Mid-January 2016 and the last negative earnings were out by Mid-July 2016.
The FIRST 2015 market drop preceded the 2016 market low by about 4 1/2 to 6 months (from 2nd vs. the 1st 2015 breakdown in the market to the final 2016 low). The first drop also preceded the first quarter of reports of lousy earnings by just under 5 months. The 2-2016 LOW in the market preceded the last report of bad earnings of a three report series of bad earnings by just over 5 months.
At least in this case, the belief that the market front runs trouble by around 6 months was true, and it front runs the emergence of a recovery by about the same period of time. A month or two off in timing can mean a lot however, so be careful of applying this blindly!
The December crash started on Dec. 4th. That was 4 1/2 months prior to the first quarter of reported negative earnings growth (in Q1 2019) of the current series that FactSet says will last 3 quarters from Q1 thru Q3 2019. The recent MAJOR low in the SP500 Index was on June 3rd. The last pullback bottoming on Aug. 5th was a bit larger in percentage terms, but was higher than the June low. June 3rd is about 4 1/2 months AHEAD of the beginning of the last reports of negative earnings growth for this three quarter period of slowing, which begins in Mid-October.
What does all this mean from a Bullish point of view? The current earnings recession of 3 consecutive quarters of negative growth was paid for with two relatively shallow pullbacks of 7.63% in May and 6.80% in August. Are those pullbacks enough? Perhaps not, but a feather in the Bulls’ cap is the fact that the August lows were higher than the June low, and as said, the June low preceded the presumed end of bad earnings by the same amount of time as for the 2016 low. Ergo, the June 3rd low, could have been the last low of this cycle of bad earnings.
Now having said that, this puts the Bulls on the spot. There could still be some messes along the way through this earnings season, and earnings CANNOT be revised toward negative for upcoming quarters based on China problems etc. Secondly, the Bulls must take the market to a new all time high (ATH) very soon or we’ll have yet another pullback. The Bulls could pull off yet another higher low somewhere above the last of the three August lows. That could be the next point to add, but as I say, we’ll see if it is when we get there. I sold some of my QQQ exposure on Friday, because I suspect a pullback based on my exam of “Market Health” as covered below…
B. “Interest rates rising or at least stabilizing. Yes, and no. The 10 Year Treasury Yield rose to around the 50 day moving average, which was my target. Last time it did not even get to the 50 day before failing, but this time it had fallen so hard and so fast that a bigger bounce was to be expected. With the Fed still lowering rates, Treasuries may now be catching yet another wind higher. (Rates down, Treasuries/Bonds up). That is why I added back some TLT exposure last week. I was waiting for the Federal Reserve reaction to work itself out.
Last week: “Will the U.S. Federal Reserve lower interest rates more quickly than suggested by their latest “mid-cycle adjustment” language? Don’t count on it with the higher inflation numbers, and that’s where the debate comes in. I am predicting a 0.25% cut this week.”
So where did the Fed’s decision to lower rates by 0.25% as I predicted leave us? The CME group reports only a 42.8% probability of a 3rd cut by October (though up from 34%), 62.9% by December (vs. 54.9% last week), and a probability of 4 cuts by April meeting of 45.2% (vs. 42.1% last week). There is a very minute minority that expects a 0.25% cut every single quarter on average out through the April meeting. In sum, the expectations are for 3 cuts in 2019 and a coin flip on a 4th cut by the April 2020 meeting. That sounds about right with 2 dissenters wanting NO cut last week and one, Gov. Bullard, always the big dove, wanting a 0.50% cut.
The probabilities above say there are still a lot of investors “offsides” for the October Federal Reserve meeting. A decision to cut or NOT cut could equally rile the Treasury market. If they cut or even talk more about an October cut, TLT will rally. If they don’t cut, TLT’s bounce could be temporarily limited.
For now, the Federal Reserve believes that these cuts are just a “mid-cycle adjustment,” which is a thought that revolted the markets after the last meeting. This time he said they could use QE again as well. The market liked that, but then did not follow through.
The recent Repo market disruptions were based on the lack of liquidity in the banking system, and it is being debated whether it means anything in terms of credit market risk (When the banks went to repossess the securities they had lent to the Fed in exchange for cash, that seized up the markets – the Fed had to inject billions of dollars of liquidity into the market all at once, because even the Fed Funds rate was driven up above target, and repo rates went off the wall). Unless they siphon off these billions, it sure smells like more QE despite Clarida’s statement to the contrary. He says they’ve done the same thing in the past and not called it “QE.” It does say the Fed will act urgently as needed to keep credit markets from seizing up.
MY CONCLUSION FROM LAST WEEK UPDATED for the Fed Meeting:
“The majority of investors believe the Fed will cut ONE MORE TIME and that is it! This sequence of expected cuts is still what Powell called a ‘mid-cycle adjustment’ to rates, despite the rising pessimism about 2020.”
Now since we are still near that upper yellow trend line on the SP500 Index chart, let’s check my “Bull Market Health Score”…
What would satisfy me that the Bulls are serious?
Let’s check the list once again… The Bull Market Health Score this week = Bulls 1.5/Bears 3.5. Last week we were at Bulls 4/Bears 1. At the end of July before the pullback, we were at Bulls 2.5/Bears 2.5. The setup now is worse than in July.
For each checklist item below, I give you the points scored as Bullish or Bearish.
1. New high? Bears 0.5 point. Answer: Neutral at best. The lower high is also a negative if the market continues to turn down. The Bulls need to get the SPX up to that yellow line (see chart below) and void the lower high quickly.
2. V*IX trend favorable? Bulls 0.5 point. Answer: Neutral. At the Friday close, the V*IX (* added to throw off the crawlers – welcome to the Matrix ;)) was 15.32 vs. 13.74 last week. The V*IX Game Score as I call it is Bulls 4/Bears 4 as of the close Friday, but the Bulls do have the “fulcrum target” (see base of report). What I don’t like is the reversal of the last breakdown in V*IX on the daily. That’s a negative and implies the V*IX is strengthening. It needs to close back below 14.91 to reverse that impression.
3. AD % Line in an Uptrend? (This is a proprietary stat; see base of report.): Bulls 0.5 point. Answer: Neutral. The close was 16,717 vs. 16,749 last week. We need a new high to give the Bulls the full point.
4. Volume on Up Moves? Bears 1.0 point. Answer: Volume was up on the down move Friday. It was options expiration, but reviewing the prior options expirations makes this a flimsy excuse. The market did not like hearing the China Trade Talks were being mucked up again.
5. Is the “U.S. Index Matrix Signal,” as I call it, positive? Bears 1.0 point. Answer : No. The Bulls goosed the small and mid caps to their respective lower tops, and then they gave up. There were FOUR negative days in a row. Very negative for the overall market.
Let’s check in on the context around the price action of the market by looking at the current Market Risks…
We have some new earnings data this week…
Earnings Risk: what is shown are the projections in the FactSet 3-15-19 report followed by the reports from 4-12-19 through 8-09-19 with a skip of two weeks until the 8-30-19 data resumes the weekly data sequence (details HERE)… The arrows “—>” indicate 3 weeks of of omitted data in order to compress the data.
For Q2 2019, analysts are projecting earnings growth of 0.1% —> -1.3% -> —> -2.1% —> -2.6% -> -2.6% -> -3.0% -> -1.9% -> -2.6%-> -1.0% -> -0.7% -> -0.4% DONE
and revenue growth of 4.6% —> 4.3% —> 4.1% —> 3.8% -> 3.8% -> 3.7% -> 3.8% ->4.0% ->4.1% -> 4.1% -> 4.0% DONE
For Q3 2019, analysts are projecting earnings growth of 1.8% —> 0.8% —> 0.3% —> -0.5% -> -0.5% -> -0.8% -> -1.4% ->-1.9% -> -2.2% -> -3.1% -> -3.5% -> -3.6% -> -3.7% -> -3.8%
and revenue growth of 4.4% —> 4.4% —> 4.2% —> 3.8% -> 3.8% -> 3.3% -> 3.2% ->3.2% -> 3.1% -> 3.0% -> 3.1% -> 2.9% -> 2.8% -> 2.8%
For Q4 2019, analysts are projecting earnings growth of 8.1% —> 7.5% —> 7.2% —> 6.3% -> 6.3% -> 6.0% -> 5.4% ->4.9% -> 4.5% -> 3.9% -> 3.5% -> 3.4% -> 3.2% -> 3.0%
and revenue growth of 4.8% —> 4.8% —> 4.6% —> 4.3% -> 4.3% -> 4.2% ->4.0%-> 4.0%-> 4.0% -> 4.0% -> 4.0% -> 3.8% -> 3.7% -> 3.6%
For CY 2019, analysts are projecting earnings growth of 3.4% —> 3.2% —> 2.7% -> 2.6% -> 2.4% -> 2.3% -> 1.7% -> 1.9% -> 1.5% -> 1.5% -> 1.4% -> 1.3% -> 1.3%
and revenue growth of 4.7% —> 4.7% —> 4.5% -> 4.4% -> 4.3% -> 4.4% ->4.4% -> 4.4% -> 4.3% -> 4.4% -> 4.3% -> 4.2% -> 4.1%
For Q1 2020, analysts are projecting earnings growth of 10.5% -> 10.7% -> 10.3 -> 9.9% -> 9.8% -> 9.5% ->9.2% –>9.0% -> 8.5% -> 8.2% -> 8.1% -> 7.9% -> 7.9%
and revenue growth of 6.2% -> 6.1% -> 6.0% -> 5.8% -> 5.8% -> 5.9% ->5.9% -> 5.7% -> 5.6% -> 5.7% -> 5.5% -> 5.5% -> 5.4%
For Q2 2020, analysts are projecting earnings growth of 13.3% -> 13.3% -> 12.9% -> 13.2% -> 13.5% -> 12.0% ->12.6% -> 10.7 -> 9.9% -> 9.3% -> 9.2% -> 9.1% -> 9.0%
and revenue growth of 6.8% -> 6.8% -> 6.6% -> 6.6% -> 6.6% -> 6.7% ->6.6% -> 6.5% -> 6.4% -> 6.5% -> 6.4% -> 6.4% -> 6.3%
For CY 2020, analysts are projecting earnings growth of 10.7% -> 10.6% -> 10.6%
and revenue growth of 5.6% -> 5.6% -> 5.6%
You can see that earnings projections for Q3 2019 came down a bit more, and so did earnings in Q2 2020. Q1 2020 estimates did not change for earnings, but revenues dropped a bit.
Here’s a Brief Review of the Other Market Risks at Hand:
China Deal Risk: The Chinese negotiators left early to return home and snubbed U.S. farmers by canceling a visit. That was like flipping Trump the “old bird.” Those farmers are his base. It actually helps Trump when they do that sort of stupid thing. It just makes the farmers angry at the Chinese. Negative near term outlook.
Fed Rate Cut Risk: Discussed above.
U.S. Iran War Risk: UPDATE 9-16-19: Iran has been implicated in the attack on Saudi Oil facilities. A military response is inevitable. This will no go unanswered, because it cannot go unanswered. That would give license to such attacks and the global disruption from this is far too great to not respond. (Then I went on to say that a frontal attack would end the country of Iran as we know it.)
UPDATE FOR THIS ISSUE: Trump does not want a war. He’s being obvious about that. Still, he just deployed US troops to Saudi Arabia to protect their assets. They cannot do it on their own. But they SHOULD be doing this on their own. They are a country lacking creativity (they do virtually nothing but pump oil and invest the profits in other countries) that has sent terrorists to our shores while selling us alternatively overpriced and under-priced oil. I have nothing against the Saudi people, but the current leadership is engaged in war in Yemen against the Houthis rebels that seeks also to repel Iranian and UAE influences from destabilizing the current government, which has resulted in a widespread “100 Year Famine” in Yemen, and the leadership kills dissenters such as Jamal Khashoggi, whom they chopped up inside their embassy in Istanbul, Turkey.
I long ago predicted that if they did not evolve, they would be eating sand in the future, when oil was replaced as an energy source. Of course, their pain has come even earlier than oil’s demise, because of our ingenious (and sometimes devious when they pollute the water table!) fracking technology. That’s why they tried to drive the price down until it became too painful for the Saudis themselves. And now their butts are on the line and Trump can get some sort of quid-pro-quo from them like low oil prices prior to the 2020 Election. Good for consumers and good for Trump (whether you like him or not ;)). I’m sure there is real estate being considered for a Trump Tower to go up in Saudi Arabia, and when the deal is done, Trump will have his pockets stuffed with cash. One quarter joking there. Same for Moscow of course, although Putin is not exactly pleased with the sanctions Trump was forced to impose. The U.S. Senate FAILED to veto continuing aid to Saudi Arabia and now they have to support them or destabilize the oil supply of the world.
If Iran attacks U.S interests deployed to Saudi Arabia, there will be an all out war. I cannot believe the Iranians are that insane. I believe they knew Trump would not respond immediately to their latest attack, but a frontal attack on U.S. troops would not be tolerated for one millisecond. Iran would be destroyed and we will be out another $2 Trillion if that happens. Pray for peace! Trump needs to negotiate a new agreement with Iran on nuclear weapons, or he will be blamed for starting a war with Iran. And he’ll lose in 2020 if war happens. That is how well the Iranians are now positioned. They have him in a corner. But they had better not push him too far, or they will be “ended.”
2020 Election Risk: Discussed last week. It’s still Biden vs. Trump, but Warren is a threat. Bernie unlike Warren did not get much of a bump from the debate. Warren is a “positive Sanders,” (even though it sounds as though she’s about to break down and cry as she speaks, she also gets very excited about the “free stuff”) so she’ll likely pick up even more points from him. If he really wanted his agenda done, he’d quit and let her take the shot, but then there is ego.
Trump Impeachment Risk: Read my analysis in the July 26th issue HERE. They need new material to impeach Trump. What they have is not sufficient or it would have been pursued already.
Deficit/Debt Threat: No important change. I’ll leave this here as a monument to our monumental debt, which could threaten interest rates in the future. The only reason we are off the hook for now is because the rest of the world is in worse shape. When rates rise, there will be “heck to pay.”
Now take a look at the SP500 chart. The green line is 2940.91, the
9-21-2018 High preceding the decline ending December 24th. The upper yellow line is the next target (now at about 3049, but rises slightly daily as it’s an up trend line).
SP500 Large Cap Index (click chart to enlarge; SPX, SPY):

Topped out?
Now let’s check in on two “Canary Signals” we’ve been following:
“Intel-igent Market Timing Signal” (Intel; INTC): Negative. Failed at the July high and has been down 6 days in a row and on high volume Friday.
Bank of America (BAC) Market Timing Signal: Negative. Looks like a lower high is being formed. Need a brand new high to void that. 31.17 is the lower top target.
Keep up-to-date during the week at Twitter and StockTwits (links below) where a combined 34,144 investors are following the markets with me…
Follow Me on Twitter® Follow Me on StockTwits®.
Join the Conversation in the StockTwits “MarketTiming” Room
Now let’s go on to review investor sentiment…
Survey Says!
Sentiment of individual investors (AAII.com) showed a Bull minus Bear percentage spread of +7.52% vs. +1.88% last week . The limitation is that sentiment that is not at extremes is less predictive. But what was the sentiment spread on Dec. 5th just after the Dec. 3rd high? 7.5%. That was the peak of the spread achieved after the Nov. 23rd low. The spread we’ve reached is OK for a lower high if that is confirmed early in the week.
Some good news? This is not what a top looks like. Sentiment goes “off the charts” at major highs. The good news is that there is room for much more upside in sentiment.
| Bulls | Neutrals | Bears |
| 35.34% | 36.84% | 27.82% |
| Thurs. 12 am CT close to poll | ||
2. U.S. Small Caps Market Timing (IWM):
Two weeks ago: “A breakout in small and mid caps next week would confirm the move in large caps. ”
It did not happen. Stay away from small caps still. They need a breakout above those lower highs.
Russell 2000 U.S. Small Cap Index (click chart to enlarge; IWM, RUT):
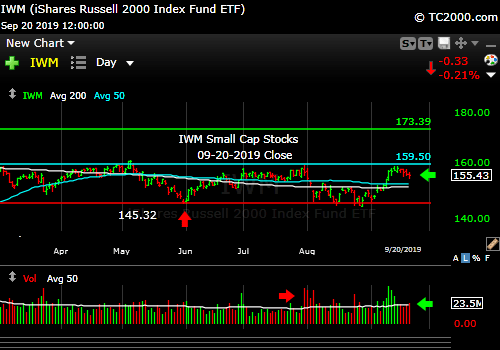
Failing. Falling off a lower top.
3. Gold Market Timing (GLD):
I’ll stand by this:
“This is not yet the time to pivot out of gold trades in my view. As long as the Federal Reserve is still lowering interest rates, gold/gold stocks will do well. When inflation starts to rise again, we’ll have to sell our trading positions in gold.”
See above for much more on gold.
The Gold ETF (click chart to enlarge the chart; GLD):

Gold on the mend.
4. Interest Rate Market Timing (10 Year Treasury Yield; TNX, IEF, TLT):
I said last week:
“The simplest view of the chart tells you that the 9-2017 low of 2.034% could be the next upside target, before global slowing brings U.S. rates back down. As said, we have to watch the incoming data, because that is not a given!”
We got to 1.903% last week and slid a bit. The Treasury/Bond market is now leading the Fed. If the “October Cut Doves” gain momentum, TNX will continue its fall. The Fed is not being clearly dovish despite the QE comment by Powell this past week. That 2.0%ish level mentioned last week could still come into play, but gold is looking good for more upside, so I’m not investing in that notion. I also added back the small amount of TLT exposure I had sold just before the Fed meeting. I have not added back the munis I took off.
Remember, FOUR Fed cuts will NOT be a “midcycle adjustment” and would be taken badly by the market ironically, considering the market’s addiction to lower rates. ***A fourth cut means the Federal Reserve is seeing recession risk as significantly high.***
Recessions above all else, create what I call “Big Bear Markets.” Therefore, a fourth rate cut will raise stock market risk dramatically. (December 2018 was a Mini Bear Market; see my New Rules HERE. Scroll to “New Rules” in blue.)
Check out the “Market Signal Summary” below – after you review the following chart…
U.S. 10 Year Treasury Note Yield (click chart to enlarge; TNX, IEF, TYX, TLT, TBF): NOTE: The 1.429% low is the lowest low shown below the bottom yellow line. That red pointer should be a bit farther to the right. It is now a Treasury Bull target.

Rates could fall. Maximum upside is to around 2%.
Now let’s review three key market timing signals together….
Do not use these signals as a trading plan. They are rough guidelines. I currently share my BUYS and SELLS in as timely a way as possible on social media (links above).
MY MARKET SIGNAL AND TREND SUMMARY for a Further U.S. Stock Market Rally with Real GDP Growth (“Real” means above inflation):
Stock Signal BEARISH for a further U.S. stock market rally with a NEUTRAL SP500 Index trend. The stock signal is based on small caps, as they often lead the market down. The SPX needs a new high to turn back to Bullish, at least above the recent consolidation.
The V*IX (which relates to SPX volatility; * added to symbol to throw off the webcrawlers!) These are the targets: 13.31, 14.04-14.08, 15.04, the “fulcrum” range = [15.94-15.95 to 16.09], 17.06, 17.27, and 17.89. The bonus target #8 is [12.-17-12.37]. The Bears have 4 of 8 targets at a VIX of 15.32 (Friday close). I consider the “fulcrum” the key decision point that turns the market from Bearish to Bullish, when the VIX falls below that entire fulcrum range.
The ‘Bull Nirvana Target’ is our V*IX # of 2018: 13.31.” (That is target #7 for the Bulls.)
Gold Signal RED for a further U.S. stock market rally with a BULLISH Gold Trend. What gold does mostly as I’ve written HERE is follow real interest rates.
From before: “Remember GLD is being used as an indicator for the ECONOMY here.” If gold continues to rise, it means the market believes real rates will fall, which in the current context means the global economy is slowing. That will ultimately hurt U.S. stocks.
Rate Signal YELLOW for a further stock market rally with a long term BEARISH and short term NEUTRAL 10 Year Yield Trend. (Remember: lower rates mean higher bond and Treasury prices) The short term trend says this could “be all the rates Bulls are going to get.” Up to about 2% as a possibility, but not one I’m betting on. The long term trend is obviously Bearish.
For Reference: “Rates usually RISE slowly in a strong recovery and the stock market rally continues as they rise, as I’ve repeated multiple times on social media and here. Empirically though, rates that are “lower” (than 3.11%) and are NOT rising rapidly have allowed the market to climb back above the prior all time high (ATH).”
I said weeks ago, “Watch the oil price too. Higher oil tends to mean higher rates.” It closed at 58.09 despite the Iran War risk spike vs. 54.85 last week. It held the June low and has since formed higher lows in Aug. and Sept. Still holds: If it rises above 58.82 and then 60.94, oil and oil stocks will be off to the races. 63.38 would be the next target. XLE was repelled by the 200 day mav.
Just a reminder: If TNX bounces too quickly and too high, this will give rise to Rate Shock III… As said before: “Watch the rate at which TNX climbs if the current trend reverses. If it shoots up very fast, stocks will correct.” In the Sept. 28th issue: “A rapid push higher in rates would mean trouble for stocks, as occurred in early 2018. That’s what I called ‘Rate Shock.'” The period of rising rates in early October I called #RateShockII.
The risk lately has been “Negative Rate Shocks.” (Not negative rates in the U.S. yet! “Negative” refers to the direction of the shock.) First we had “Negative Rate Shock I” in December 2018 (because rates FELL while the Fed raised the Fed Funds rate 0.25% in mid-December, in what was perceived as a policy error by critics), “Negative Rate Shock II” in May, and “Negative Rate Shock III” in August, which is on pause and awaiting the next pivot.
Thank you for reading. Would you please leave your comments below where it says “Leave a Reply”… or ask a question or report a typo…
Pay it forward by sending the link to MarketTiming.Blog (that link will immediately connect them to this webpage) to a relative or friend. Thanks for doing that.
Be sure to visit the website for more general investing knowledge at:
Standard Disclaimer: It’s your money and your decision as to how to invest it.
I thank Worden Brothers for the charting system I use to post these charts. If you want to know more about the charting system I use every day, contact me. It makes it much easier to follow along with me if you can see the charts and manipulate them on your own computer. It’s a great investment to have an excellent charting system.
Note: I’ve updated my criteria for the equity signal for a further U.S. stock market rally to the following: GREEN = Bullish, YELLOW = Neutral, RED = Bearish. In other words, the colors tell you whether the signal supports the stock rally or not, while the Bullish, Neutral, and Bearish designations are about the trend.
A BEARISH trend signal does not mean we should not buy. A BULLISH trend signal does not mean you cannot sell some exposure. It depends on what is going on in the economy and how oversold/overbought the market is at a given point whether the Bearish signal is to be sold or bought, sold on the next bounce, etc. and whether a Bullish signal is to be bought or if profits should be taken. A NEUTRAL trend signal does not mean the end of the Bull or Bear. It means to wait and look for possible subsequent entry points within the existing trend, Bull or Bear, but preserve capital if the entry fails. Our strong intention is to buy low and sell high. By the way, I will keep showing the prior orange “Trigger lines” in the IWM and GLD charts for now as reference points only; they have historical value for us from the post-2016 election period.
Copyright © 2019 By Wall Street Sun and Storm Report, LLC All rights reserved.

Thanks!
You are welcome Charles!