A Market Timing Report based on the September 13, 2019 Close, published Saturday, September 14th, 2019…
I deliver focused comments on market timing once a week. These are supplemented with daily “Tweets/StockTwits” (see links below) and comments in the “markettiming” room on StockTwits.
I provide quite a bit of intraweek commentary, and if you don’t see it, you will miss out on quite a bit of context, so please click on the social media links below and have a read… Thank you as always for being loyal readers and interacting on social media with your questions and comments!
NOTE: ALL CHARTS REPRESENT THE 9-13-2019 FRIDAY CLOSE.
1. SP500 Index Market Timing (S&P 500 Index®; SPY, SPX):
Last week I detailed four requirements for a strong stock market moving to new highs, and we need to review them now…
A. “Earnings growth resuming in Q4 2019 into 2020.” This is expected, but we first have to make it through negative Q3 earnings without enough negative revisions to drag on those future earnings.
B. “Interest rates rising or at least stabilizing. We can give this one a temporary check mark! At the moment, it seems there will only be two more rate cuts by April 2020 per investors for a total of 3 cuts despite this bounce in rates.
How many times the Fed will cut is still being debated in the minds of investors! How do I know this? Because the CME Group data says that the October cut will move to December or January, but a fourth cut has become more probable in 2020! The Fed would not continue to cut rates if things were improving steadily in the economy, so the data shows the interest rate cut Bulls are still looking for more downside. That means this move up in interest rates could be a false one with still more gains ahead for both Treasuries and gold/gold stocks.
Will the U.S. Federal Reserve lower interest rates more quickly than suggested by their latest “mid-cycle adjustment” language? Don’t count on it with the higher inflation numbers, and that’s where the debate comes in. I am predicting a 0.25% cut this week.
CME Group says a 0.25% cut on Sept. 18th has a 79.6% probability. vs a 91.2% probability last week, and the rest of the probability distribution says the Fed will not cut at all. That would be Cut #2 to be clear. There is a 34% probability vs. last week a 59.6% probability they will cut again in October, and now a 54.9% probability vs. a 35.2% probability last week of a Cut #3 or more by December. Essentially that moves the expected October cut to December. (If you look at the data, remember that Cut #1 was done at the July meeting.)
By January there is a 68.3% vs. a 60.4% probability last week that rates reflect three cuts in total for the sequence of cuts. How about 4 cuts? March? 38.6% prob. vs. 33.8% prob. last week of 4 cuts. April? 42.1%% vs. 19.2% probability last week of 4 cuts.
CONCLUSION: The majority of investors believe the Fed will cut TWO MORE TIMES and that is it! This sequence of expected cuts is still what Powell called a “mid-cycle adjustment” to rates, despite the rising pessimism about 2020. Investors may be disappointed by the number of eventual cuts if inflation numbers continue to warm.
The good news is that we’re not yet to the ultimate stock market top in my view.
When we are recovering, as I’ve shared here before, RATES RISE, they do not fall. Rates rose sharply, at least from their previous low level. A move UP of 11.2 basis points on Friday is a BIG move for one day. The previous day they went up 5.8 basis points, which is also a strong move.
Is that sort of move a big thing? Well, if you look at the data since the October 2018 top at 3.248%, there were only a few data points with rises of that magnitude:
1. 1-04-19 10.5 bp when rates moved off a low and stocks were moving into a strong rally. The rate gains held up for a few months before rates stepped down once again.
2. 7-05-19 9.5 bp when SP500 Index was only about 1% below the eventual high. The yield was coming off another temporary low that held rates up for another 18 trading days before they collapsed to the next low.
3. 9-05-19 10.6 bp on the day the yield came off its low and the SP500 Index broke to new highs.
When was the most recent big DROP in the 10 Year Yield? On 8-01-19, there was a 12.7 bp when Trump had just stirred up things with China with new tariff threats and the SP500 Index broke immediate support the same day.
You’ll notice there are several correlations/relationships here.
1. A strong yield move up is being read as a POSITIVE for the stock market. Rates rise when an economy improves after rates are lowered by the Fed when things are soft. That is the dance. I realize my loyal readers know that, but it’s good to bring the key concepts into focus for the discussion.
2. But in one case (#2), the impact of higher interest rates was short lived. The market topped 16 trading days later and did not make it that much higher before falling.
3. The rapid up move is correlated with not only a very long move down in rates since Oct. 2018, but also with a recent collapse in rates based on a China Trade talk failure. Market participants DO care about trade in a significant way at least on a trading basis. They see the future of the economy differently with the trade war resolved vs. a long drawn out fight, which it obviously dislikes. Uncertainty is poison to any stock market.
4. I’ll save my fourth point for the 10 Year Treasury Yield Chart below. Be sure to read it!
C. U.S. China Trade War resolution. President Trump said this week he’d consider an “interim deal” with China, and said they’d being buying a lot of agricultural goods (to make his Midwest voters a lot happier, as they’ve been suffering), and China said it would even lower some tariffs on U.S. products selectively. Trump held off the 30% tariff raise from 25% for an additional two weeks to allow time for talks in the second week of October following China’s celebration in the 1st week of October.
D. President Trump’s re-election or (adding this week) Former VP Joe Biden’s Election. Biden did better during this last debate and even fended off an ageist attack on him by Castro. As long as Biden does not move up corporate tax rates dramatically in his stated tax plan (I have not seen a statement on corporate rates from his campaign), I predict the markets will not react in fear to a Biden presidency.
The worst case for the markets is having anyone close in perspective to Sanders or Warren in the White House. The earnings of the SP500 Index would drop precipitously on their higher corporate tax rates, and that would make U.S. firms less competitive on a global basis (I think the tax rate of these companies should be adjusted based on the percentage of goods they produce in the U.S.). At the present time, no one else in the field besides those two is even a close threat to Joe Biden. Notice that in THREE DEBATES, there has been zero discussion of tax policy other than tangential threats to tax the ultra rich? What is with this need to demonize the rich? You’d think they want to be elected by any means possible. 😉
Yes, there are inequities in the system, and I believe strongly in profit sharing with loyal employees, but they don’t need to lump every successful person in with CEOs who make 50-100 Million a year as Co-CEO Mark Hurd of Oracle does (His salary was mentioned when he took a leave of absence due to a health issue – unspecified, although investors may actually want to know what the risk is to his health).
E. Impeachment dies in the House: I’m adding this back, because the House took steps toward furthering their investigations this week. Still, there is very little talk about it. Do not underestimate the impact on the markets if this perks up, so it’s something we need to watch closely.
Now since we are approaching that upper yellow trend line on the SP500 Index chart, let’s check my “Bull Market Health Score”…
What would satisfy me that the Bulls are serious?
Let’s check the list once again… The Bull Market Health Score this week = Bulls 4/Bears 1. Last week we were at Bulls 4/Bears 1, so the market is still healthy with the exception volume behind the large cap move. At the end of July before the pullback, we were at Bulls 2.5/Bears 2.5.
For each checklist item below, I give you the points scored as Bullish or Bearish.
1. New high? Bulls 1.0 point. Answer: No, but progress was made to retake the all time high. The high this week was SPX 3020.74, close of 3007.39 and SPY 302.46, a close of 301.09.
Last week: The Bulls got to SPX of 2985.86 and closed the week at 2978.71 . SPY got to 298.83 and closed at 298.05.
Where to next? The upper channel line in yellow on the chart below would be the next target ABOVE the prior ATH. One of my indicators shows there is room for a very “giddy” new high as we saw back in Jan. 2018, but you know what happened after that. Sentiment does support a new high as you’ll read below. Stay with the trend. I have a surprising take on small caps you’ll read later.
2. VIX trend favorable? Bulls 1.0. Answer: Yes. At the Friday close, the VIX was 13.74 vs. the prior week’s close at 15.00. I reported last Saturday that the “VIX Fever” had broken with the close below prior support (15.51) AND below my “fulcrum target” (see base of report for VIX Game #s). The VIX Game Score as I call it is Bulls 6/Bears 2 as of the close Friday.
3. AD % Line in an Uptrend? (This is a proprietary stat; see base of report.): Bulls 1.0 point. Answer: Yes. The close was 16,749 a new ATH. The breakout above 16.632, the 7-31-19 high has been eclipsed for 5 trading days.
4. Volume on Up Moves? Bears 1.0 point. Answer: No. Volume for the large caps did not go up on the breakout day, which was Wednesday. There is a caveat here though. The volume WAS SEEN in the small caps as the chart in section 2 shows! Since this market health score refers largely to large cap stocks with a secondary role played in #5 by small and mid caps, I won’t split this point between the Bulls and Bears.
5. Is the “U.S. Index Matrix Signal,” as I call it, positive? Bulls 1.0 point. Answer : Yes, and although they (both small and mid caps) have reached “chart resistance” as of Friday, the volume behind this move suggests the Bulls could push further upward.
Let’s check in on the context around the price action of the market by looking at the current Market Risks…
We have some new earnings data this week…
Earnings Risk: what is shown are the projections in the FactSet 3-15-19 report followed by the reports from 4-12-19 through 8-09-19 with a skip of two weeks until the 9-06-19 data resumes the weekly data sequence (details HERE)… The arrows “—>” indicate 3 weeks of of omitted data in order to compress the data.
For Q2 2019, analysts are projecting earnings growth of 0.1% —> -1.3% -> —> -2.1% —> -2.6% -> -2.6% -> -3.0% -> -1.9% -> -2.6%-> -1.0% -> -0.7% -> -0.4% DONE
and revenue growth of 4.6% —> 4.3% —> 4.1% —> 3.8% -> 3.8% -> 3.7% -> 3.8% ->4.0% ->4.1% -> 4.1% -> 4.0% DONE
For Q3 2019, analysts are projecting earnings growth of 1.8% —> 0.8% —> 0.3% —> -0.5% -> -0.5% -> -0.8% -> -1.4% ->-1.9% -> -2.2% -> -3.1% -> -3.5% -> -3.6% -> -3.7%
and revenue growth of 4.4% —> 4.4% —> 4.2% —> 3.8% -> 3.8% -> 3.3% -> 3.2% ->3.2% -> 3.1% -> 3.0% -> 3.1% -> 2.9% -> 2.8%
For Q4 2019, analysts are projecting earnings growth of 8.1% —> 7.5% —> 7.2% —> 6.3% -> 6.3% -> 6.0% -> 5.4% ->4.9% -> 4.5% -> 3.9% -> 3.5% -> 3.4% -> 3.2%
and revenue growth of 4.8% —> 4.8% —> 4.6% —> 4.3% -> 4.3% -> 4.2% -> 4.0% ->4.0%-> 4.5%-> 4.0% -> 4.0% -> 4.0% -> 3.8% -> 3.7%
For CY 2019, analysts are projecting earnings growth of 3.4% —> 3.2% —> 2.7% -> 2.6% -> 2.4% -> 2.3% -> 1.7% -> 1.9% -> 1.5% -> 1.5% -> 1.4% -> 1.3%
and revenue growth of 4.7% —> 4.7% —> 4.5% -> 4.4% -> 4.3% -> 4.4% ->4.4% -> 4.4% -> 4.3% -> 4.4% -> 4.3% -> 4.2%
For Q1 2020, analysts are projecting earnings growth of 10.5% -> 10.7% -> 10.3 -> 9.9% -> 9.8% -> 9.5% ->9.2% –>9.0% -> 8.5% -> 8.2% -> 8.1% -> 7.9%
and revenue growth of 6.2% -> 6.1% -> 6.0% -> 5.8% -> 5.8% -> 5.9% ->5.9% -> 5.7% -> 5.6% -> 5.7% -> 5.5% -> 5.5%
For Q2 2020, analysts are projecting earnings growth of 13.3% -> 13.3% -> 12.9% -> 13.2% -> 13.5% -> 12.0% ->12.6% -> 10.7 -> 9.9% -> 9.3% -> 9.2% -> 9.1%
and revenue growth of 6.8% -> 6.8% -> 6.6% -> 6.6% -> 6.6% -> 6.7% ->6.6% -> 6.5% -> 6.4% -> 6.5% -> 6.4% -> 6.4%
For CY 2020, analysts are projecting earnings growth of 10.7% -> 10.6%
and revenue growth of 5.6% -> 5.6%
You can see that earnings projections for Q3 2019 came down a bit more, and so did earnings into 2020, although the comparisons are going to be easier vs. the prior year in 2020.
Here’s a Brief Review of the Other Market Risks at Hand:
China Deal Risk: Has improved as discussed.
Fed Rate Cut Risk: Discussed above.
U.S. Iran War Risk: UPDATE 9-16-19: Iran has been implicated in the attack on Saudi Oil facilities. A military response is inevitable. This will no go unanswered, because it cannot go unanswered. That would give license to such attacks and the global disruption from this is far too great to not respond. That is the way of the world in its current state of consciousness and its available options. The response will start and could end with air strikes, but should Iran send troops into Saudi Arabia, it will become the next Middle East War, because the Saudis would require American troops to face off Iran. A “clean war” would quickly become messy.
No change from: “Simmering at a low boil, and not over. Iran is reportedly already breaking the 2015 agreement on enrichment of uranium. Trump claims they want to negotiate.”
2020 Election Risk: Discussed above.
Trump Impeachment Risk: Discussed above. Read my analysis in the July 26th issue HERE.
Deficit/Debt Threat: No important change. I’ll leave this here as a monument to our monumental debt, which could threaten interest rates in the future. The only reason we are off the hook for now is because the rest of the world is in worse shape. When rates rise, there will be “heck to pay.”
Now take a look at the SP500 chart. The green line is 2940.91, the
9-21-2018 High preceding the decline from Sept. to December 24th. The upper yellow line is the next target (now at about 3044, but rises slightly daily as it’s an up trend line).
SP500 Large Cap Index (click chart to enlarge; SPX, SPY):
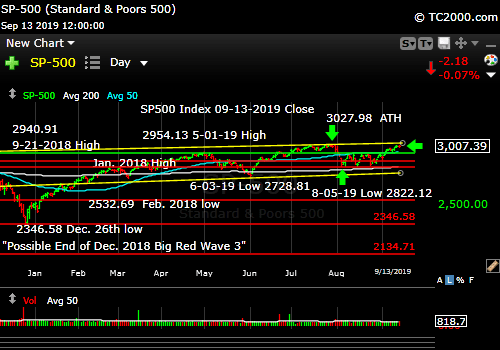
Almost at the prior all time high (ATH).
Now let’s check in on two “Canary Signals” we’ve been following:
“Intel-igent Market Timing Signal” (Intel; INTC): Positive. July high is the next target for the Bulls to take out.
Bank of America (BAC) Market Timing Signal: Neutral, and no, interest rates did not head lower this past week, which helps the banks greatly. 31.17 is the top of the current range that has been in place for months.
Keep up-to-date during the week at Twitter and StockTwits (links below) where a combined 34,144 investors are following the markets with me…
Follow Me on Twitter® Follow Me on StockTwits®.
Join the Conversation in the StockTwits “MarketTiming” Room
Now let’s go on to review investor sentiment…
Survey Says!
Sentiment of individual investors (AAII.com) showed a Bull minus Bear percentage spread of +1.88% vs. -10.87% last week .
The fact that investor sentiment is still tentative with the SP500 Index breaking to the top of the trading range is BULLISH. Spreads of 20-30 are substantialy Bullish, and the sentiment in Jan. 2018 of a spread > 40% was off the wall Bullish)
| Bulls | Neutrals | Bears |
| 33.13% | 35.63% | 31.25% |
| Thurs. 12 am CT close to poll | ||
2. U.S. Small Caps Market Timing (IWM):
Last week: “A breakout in small and mid caps next week would confirm the move in large caps. ”
Small caps did in fact not just come along with large caps this week – they outperformed them on HIGH VOLUME. The real challenge is the combination of three major highs all around that first high of 159.50. Above there? It’s a clear signal of more gains for the entire market, just as the prior breakout above those August lower highs was. Watch what I do this week on social media if/when we get that signal.
Russell 2000 U.S. Small Cap Index (click chart to enlarge; IWM, RUT):
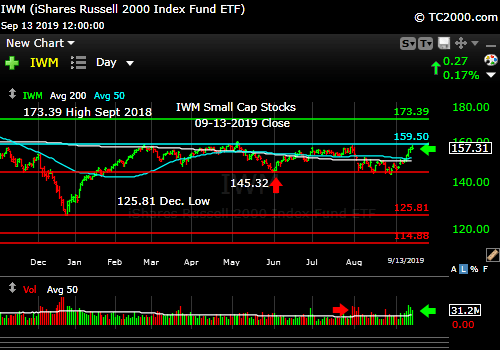
A breakout would mean a lot here!
3. Gold Market Timing (GLD):
Last week: “Be awake next week for the PPI( Weds.) and CPI (Thurs.) inflation data. Retail sales are on Friday.
I said: “This is not yet the time to pivot out of gold trades in my view. As long as the Federal Reserve is still lowering interest rates, gold/gold stocks will do well. When inflation starts to rise again, we’ll have to sell our trading positions in gold.”
Right on cue, gold fell as rates rose sharply as the inflation data was on the warm side as I detailed on social media HERE and in the “markettiming room” HERE. We’ve been holding these positions knowing a rate-based counter-trend move could occur. If you traded out of at least part of your gold position near the prior highs when rates were super stretched, good for you. But as I shared in detail last week, if you are not willing to jump back in for what could be the “next leg up in gold,” then you should not sell unless that’s the only way you can preserve a decent profit.
What’s the caveat for gold in a rising rate environment if that is what we’re moving to (unproven if that 2.06% level holds)? The Fed is trying to maintain the expansion, so if it moves too slowly, real rates don’t expand and in fact the Fed falls behind perhaps, pushing gold higher as real rates move lower. You can watch real Treasury rates HERE. The 10 Year Treasury last had a slightly negative real rate on Sept. 4th (-0.04%). With the pop this week, it’s back to 0.23%, not great but better.
Look at the number of failed rallies in GLD on the first chart below (a weekly chart). This is the SIXTH significant rally for gold since the June 2013 low. That means this rally could fail as well. The one that won’t fail could be 1 year or 5 years away, when the entire monetary/debt system suffers a crisis after years of these ridiculous negative rates whose purpose is to prevent natural, cyclical downturns in the economies of the world. All the Central Banks are playing the same game, just to varying degrees, with the U.S. trailing Europe and Japan on “negative rates.”
This is why we must TRADE our trading position in gold and not seek to “Buy and Hold” it. ( I do have a core gold “fiat currency insurance position.”) We know what the endpoint will be for these “Frankenstein monetary experiments.” We just have no way of knowing when investors will give up on western fiat currencies. Why do you think Russia is selling U.S. dollars and building up its gold holdings? China has also been a strong buyer of gold. Do you think China may someday threaten the U.S. dollar as the reserve currency as they build their ability to innovate? What if the world started buying yuan instead of dollars?
This is why we have to continue to bring immigrant talent into the U.S. and support our educational and research systems, which have driven the world’s best innovations for decades. China is now pressing to lead on 5G as I discussed last week. A win for them there would be a strong signal to the U.S. tech industry. As I said last week, Apple is a YEAR BEHIND Huawei on 5G phones.
Finally, to be a global tech leader, China will need both access to more capital and access to U.S. technology, which it won’t get as an adversary. And it would not deserve it. What is our edge? Freedom is our edge. Captive spirits are less willing to step out and take risks, so until REAL freedom arrives in China, the U.S. will have a huge advantage. I just hope our leaders don’t blow it on the education and research fronts!
Despite the caveat that this could become a failed gold rally, the rally has not yet failed in a meaningful way (the close was not decisively below trend – not yet anyway, and the breakout above the prior major highs shown below is still intact). The trend is still up for gold for now. The downside risk is to the breakout level, which is below the current trend as shown on the first chart. 137.55 is the highest of those tops. The positive view is that GLD is still above the five previous failed rally attempts. When that changes, gold will go back to a trading sell. Remember that holding a core gold position like GLD in your portfolio is a form of currency insurance against the decline of the U.S. dollar, which over time, the Fed and Treasury ensure goes down. That’s the only way they can repay our massive debt.
The Gold ETF (click chart to enlarge the chart; GLD):
NOTE: CHART represents the 9-13-19 CLOSE!

Gold in pullback, but still above key breakout levels.
CHART represents the 9-13-19 CLOSE!
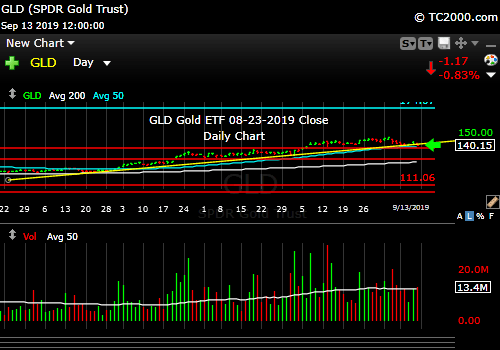
GLD is barely below the up trend line.
4. Interest Rate Market Timing (10 Year Treasury Yield; TNX, IEF, TLT):
The narrative around the rate rise was covered above. But I promised to share the most important point on positioning, which is the verification of the prior major lows by the recent low and lunge upward:
Point #4. As shown in the first TNX chart below for the 10 Year Treasury Yield, the low created by this surge in rates is a higher low above the 2012 1.394% low as well as the 1.336% low of 07-2016. That means the range was defended and the entire upside of the range is now in play. A breach of that lowest low would indicate a dive toward zero/negative rates was in the cards, even for the U.S. For now, the rate Bulls (those expecting interest rates to rise further) are in control until proven otherwise. The global economy says “No” to that notion. U.S. inflation data and slow but positive GDP growth say “Yes” to still higher rates.
Don’t underestimate this signal. Note that the rate rise was the greatest since the rise immediately after the 2016 Election based on the perception that Trump’s policies would stimulate economic growth, which requires higher interest rates (see 2nd chart below). It also drew in foreign investment in the U.S. stock market no doubt as well. This comparison tells you that the rate rise is not necessarily “bad” for stocks.
In fact, the data this week may say that the U.S. is not going to be subject to the economic drag from the rest of the world. Of course, it’s not immune to that influence, but we COULD lead the world back out of a slowdown vs. having the rest of the world lead us into recession. There is that possibility if we can get through Q3 earnings starting in mid-October or so without too much downward revision in the revenue and earnings numbers.
Alternatively, the numbers suggest the Fed is moving into a period of being “cornered” between slow GDP growth and higher inflation as I discussed this week (see second link under the Gold section above). That’s what is called “stagflation,” which was a big problem throughout the 1970’s through the start of Reagan’s first term. It led to very high interest rates under Fed Chair Volcker, which amounted to shock therapy for inflation expectations.
The simplest view of the chart tells you that the 9-2017 low of 2.034% could be the next upside target, before global slowing brings U.S. rates back down. As said, we have to watch the incoming data, because that is not a given!
Check out the “Market Signal Summary” below – after you review the following chart…
U.S. 10 Year Treasury Note Yield (click chart to enlarge; TNX, IEF, TYX, TLT, TBF):
NOTE: Chart represents the 9-13-19 CLOSE!

The prior major lows held. This looks like a major reversal UP.
NOTE: Chart represents the 9-13-19 CLOSE!

Largest weekly rise in rates since the 2016 election!
Now let’s review three key market timing signals together….
Do not use these signals as a trading plan. They are rough guidelines. I currently share my BUYS and SELLS in as timely a way as possible on social media (links above).
MY MARKET SIGNAL AND TREND SUMMARY for a Further U.S. Stock Market Rally with Real GDP Growth (“Real” means above inflation):
Stock Signal NEUTRAL for a further U.S. stock market rally with a Bullish SP500 Index trend. The stock signal is based on small caps, as they often lead the market down. The small cap trend is neutral, leaning Bullish until the current trading range is breached to the upside (discussed above).
The V*IX (which relates to SPX volatility; * added to symbol to throw off the webcrawlers!) These are the targets: 13.31, 14.04-14.08, 15.04, the “fulcrum” range = [15.94-15.95 to 16.09], 17.06, 17.27, and 17.89. The bonus target #8 is [12.-17-12.37]. The Bears have 6 of 8 targets at a VIX of 13.74 (Friday close). I consider the “fulcrum” the key decision point that turns the market from Bearish to Bullish, when the VIX falls below that entire fulcrum range.
The ‘Bull Nirvana Target’ is our V*IX # of 2018: 13.31.” (That is target #7 for the Bulls.)
Gold Signal RED for a further U.S. stock market rally with a BULLISH Gold Trend. What gold does mostly as I’ve written HERE is follow real interest rates.
From before: “Remember GLD is being used as an indicator for the ECONOMY here.” If gold continues to rise, it means the market believes real rates will fall, which in the current context means the global economy is slowing. That will ultimately hurt U.S. stocks.
Rate Signal YELLOW for a further stock market rally with a long term BEARISH and short term BULLISH 10 Year Yield Trend. (Remember: lower rates mean higher bond and Treasury prices)
For Reference: “Rates usually RISE slowly in a strong recovery and the stock market rally continues as they rise, as I’ve repeated multiple times on social media and here. Empirically though, rates that are “lower” (than 3.11%) and are NOT rising rapidly have allowed the market to climb back above the prior all time high (ATH).”
I said weeks ago, “Watch the oil price too. Higher oil tends to mean higher rates.” It closed at 54.85 vs. 55.10 last week but is starting to look more neutral in trend than Bearish. It held the June low and has since formed higher lows in Aug. and Sept. If it rises above 58.82 and then 60.94, oil and oil stocks will be off to the races. The bounce in XLE has been strong off the prior low, but it’s only to the prior relative levels attained on failed rallies.
Just a reminder (not a current problem, because rates are “too low” now on a relative basis, but the rate of rise has been fast enough to be concerned should it continue): If TNX bounces too quickly and too high, this will give rise to Rate Shock III… As said before: “Watch the rate at which TNX climbs if the current trend reverses. If it shoots up very fast, stocks will correct.” In the Sept. 28th issue: “A rapid push higher in rates would mean trouble for stocks, as occurred in early 2018. That’s what I called ‘Rate Shock.'” The period of rising rates in early October I called #RateShockII.
The risk lately has been “Negative Rate Shocks.” (Not negative rates in the U.S. yet! “Negative” refers to the direction of the shock.) First we had “Negative Rate Shock I” in December 2018 (because rates FELL while the Fed raised the Fed Funds rate 0.25% in mid-December, in what was perceived as a policy error by critics), “Negative Rate Shock II” in May, and “Negative Rate Shock III” in August, which is on pause and awaiting the next pivot.
Thank you for reading. Would you please leave your comments below where it says “Leave a Reply”… or ask a question or report a typo…
Pay it forward by sending the link to MarketTiming.Blog (that link will immediately connect them to this webpage) to a relative or friend. Thanks for doing that.
Be sure to visit the website for more general investing knowledge at:
Standard Disclaimer: It’s your money and your decision as to how to invest it.
I thank Worden Brothers for the charting system I use to post these charts. If you want to know more about the charting system I use every day, contact me. It makes it much easier to follow along with me if you can see the charts and manipulate them on your own computer. It’s a great investment to have an excellent charting system.
Note: I’ve updated my criteria for the equity signal for a further U.S. stock market rally to the following: GREEN = Bullish, YELLOW = Neutral, RED = Bearish. In other words, the colors tell you whether the signal supports the stock rally or not, while the Bullish, Neutral, and Bearish designations are about the trend.
A BEARISH trend signal does not mean we should not buy. A BULLISH trend signal does not mean you cannot sell some exposure. It depends on what is going on in the economy and how oversold/overbought the market is at a given point whether the Bearish signal is to be sold or bought, sold on the next bounce, etc. and whether a Bullish signal is to be bought or if profits should be taken. A NEUTRAL trend signal does not mean the end of the Bull or Bear. It means to wait and look for possible subsequent entry points within the existing trend, Bull or Bear, but preserve capital if the entry fails. Our strong intention is to buy low and sell high. By the way, I will keep showing the prior orange “Trigger lines” in the IWM and GLD charts for now as reference points only; they have historical value for us from the post-2016 election period.
Copyright © 2019 By Wall Street Sun and Storm Report, LLC All rights reserved.
