A Market Timing Report based on the October 4, 2019 Close, published Saturday, October 5th, 2019…
I deliver focused comments on market timing once a week. These are supplemented with daily “Tweets/StockTwits” (see links below) and comments in the “markettiming” room on StockTwits.
I provide quite a bit of intraweek commentary, and if you don’t see it, you will miss out on quite a bit of context, so please click on the social media links below and have a read… Thank you as always for being loyal readers and interacting on social media with your questions and comments!
1. SP500 Index Market Timing (S&P 500 Index®; SPY, SPX):
We are headed into earnings season with investors believing that everything companies are about to say is reasonably priced in. Why else would they have rallied off the recent low? I messaged on social media that my indicators had fallen enough to allow for a bounce, and sure enough, we got a bounce. But there are nearby time periods where similar bounces failed, and this may be a redo of August for example. There are a number of risks simultaneously facing the stock market. I will cover them one by one below…
In chart terms we are in mid-channel now, which is not the best place to add exposure. You have about equal downside to upside.
Off the low, I did start buying an initial position in a real estate stock I’ve been tracking for a while. I combine sound analysis with the technical view and start a position, when the entry looks good, and preferably when the overall market has hit some sort of bottom.
I believe in “Technofundamentals,” which is why “Technofundamentals.com” will take you to this blog. Why just do an EKG on a heart patient like Bernie Sanders by the way, when you can also do an echo-cardiogram to determine whether his heart has been badly or just mildly damaged by his myocardial infarction (means part of his heart muscle died and at this point they have not said how much has died – it’s why a massive heart attack kills patients; no muscle to pump means no pump…)? I’ll get back to the Bernie Sanders fallout in a bit. But seriously why do loads of fundamental stock analysis and not examine the chart to see if investors are buying or selling??? And why don’t chart readers pay close attention to macro risks? That’s precisely why I evaluate all current market risks here. It’s because they matter!
What is happening “Under the Hood” this week?
1. The SP500 Index simply fell to and tested the prior trend line on the daily chart up from the August lows (that line is higher than the lower yellow trend line shown on the chart below…). That test succeeded. There is often a slight overshoot as investors decide whether they’ll come in and buy or not. They did come in. The problem as you’ll read later, was their limited enthusiasm! This bounce is not a healthy bounce.
2. Utilities continued to outperform every other sector since the Aug. 5th low on up. Why? Rates fell back to the prior lows! It’s as simply as that. IF rates do not make brand new lows, Utilities, REITs, and Treasuries will all suffer depending on the exact rate of acceleration/deceleration of inflation. (A mild acceleration in inflation, while the economy is decelerating, is not bad for utilities etc. because investors are chasing any positive return they can find.)
If the Fed were to drop interest rates suddenly and by a lot, real yields would plummet, and all the above would work. If the Fed starts raising rates ahead of inflation, they will do so because the economy is strengthening, and all of the above will be hurt. Economic growth is the enemy of safe higher yielding investments like REITs and Utilities. With gold, you have the roadmap of how to assess when it will work HERE.
3. There is a back and forth between those who believes long rates will rise, because the Fed is going to come to the rescue and lower rates much more, and those who don’t think that is needed. If you believe Utilities represent a signal, then the Fed is not done lowering rates and they may lower them more than expected. This drives more and more money into utilities until they too are overvalued, and they too fall when the entire market falls as one great sinking ship. I covered that point last week.
4. Heath care (XLV) stocks bounced with the market, but are still lagging since the Aug. lows. They are the easiest political target. Prices of all health products whether appliances or drugs will FALL over the next few years as price controls are instituted. It’s the only way the system can afford to provide healthcare to everyone. And there is a common belief by the vast majority of Americans that doing so is the right thing.
5. XLE is the worst performer as oil is retrace testing the early Aug. low. If inflation ticks up, it will be in part due to an oil rally, so watch the price of oil closely.
6. XLP: If inflation accelerates over the coming couple of quarters, consumer staples will have problems as their input costs rise. They only work in periods like December. There will now be a pivot out of this sector as soon as either growth or inflation accelerates. Read the Ray Dalio section of Tony Robbins “Money: Master the Game” if you want to review his asset allocation model based on GDP acceleration/deceleration and Inflation acceleration/deceleration, which comprise his “four season” model. Others have copied his system as he founded the largest hedge fund on the planet, and that’s well worth imitating. It’s worth a read.
Let’s turn to the state of the market, which has made a lower high vs. the top yellow line in the SP500 Index market timing chart below…
What would satisfy me that the Bulls are serious?
They are sort of serious this week, but the numbers are moving in the right direction. The Bull Market Health Score this week is Bulls 2.0/Bears 3.0 vs. Bulls 0.5/Bears 4.5 last week.
For each checklist item below, I give you the points scored as Bullish or Bearish.
1. New high? Bulls 0.5 point. Answer: No. Last week: “The only ‘good news’ is that despite that lower close, the index has not broken the base of the prior 3 days. Write down this number: 2957. 73. If the SPX falls below there, it could do a quick test below and rise again, but it must…or else we’ll see the next leg down from the Sept. high.”
What we saw was a break of that level on Tuesday on a closing basis and then a swoop down on Wednesday, a flush on Thursday with a reversal back up. Wednesday I pointed out that one of my “stretch indicators” had bottomed, and sure enough the market had as well. It has predicted multiple lows this year. But the same thing may happen now as seen in May. There was a three day bounce and the market turned back down. There are other holes in this bounce as you see below.
2. V*IX trend favorable? Bulls 0.5 Answer: Neutral. The VIX did fall from the same level as the last Aug. high, but the up trend is still intact on the daily chart. The V*IX Game Score as I call it is barely Bulls 3/Bears 4 (7 point scale) as of the close Friday. The midpoint is the “fulcrum.” (details at base of report)
3. AD % Line in an Uptrend? (This is a proprietary stat; see base of report.): Bulls 0.5 point. Answer: Neutral. The indicator has bounced with the market, which is positive, but it did so in May as well and then collapsed to a new low. The close was 16,649 vs. 16,683 last week, but the indicator is above its July highs.
4. Higher volume on Up Moves? Lower volume on Down moves? Bears 1.0 point. Answer: No. The volume was poor for SPX and miserable for small and mid caps.
5. Is the “U.S. Index Matrix Signal,” as I call it, positive? Bulls 0.5 point. Answer : Too early to tell, but off the lows. Both mid and small caps are off their lows, which is positive, but the volume on Friday was miserable. A Bull could say the chart shows a bounce off the low end of the range that has been in force since the 6-03-2019 low. It could be a decent trade, but the base in the small caps had better hold!
Let’s check in on the context around the price action of the market by looking at the current Market Risks…
We have some new earnings data this week…
Earnings Risk: what is shown are the projections in the FactSet 3-15-19 report followed by the reports from 4-12-19 through 8-09-19 with a skip of two weeks until the 8-30-19 data resumes the weekly data sequence (details HERE)… The arrows “—>” indicate 3 weeks of of omitted data in order to compress the data.
For Q2 2019, analysts are projecting earnings growth of 0.1% —> -1.3% -> —> -2.1% —> -2.6% -> -2.6% -> -3.0% -> -1.9% -> -2.6%-> -1.0% -> -0.7% -> -0.4% DONE
and revenue growth of 4.6% —> 4.3% —> 4.1% —> 3.8% -> 3.8% -> 3.7% -> 3.8% ->4.0% ->4.1% -> 4.1% -> 4.0% DONE
For Q3 2019, analysts are projecting earnings growth of 1.8% —> 0.8% —> 0.3% —> -0.5% -> -0.5% -> -0.8% -> -1.4% ->-1.9% -> -2.2% -> -3.1% -> -3.5% -> -3.6% -> -3.7% -> -3.8% -> -3.7% -> -4.1%
and revenue growth of 4.4% —> 4.4% —> 4.2% —> 3.8% -> 3.8% -> 3.3% -> 3.2% ->3.2% -> 3.1% -> 3.0% -> 3.1% -> 2.9% -> 2.8% -> 2.8% -> 2.8% -> 2.8%
For Q4 2019, analysts are projecting earnings growth of 8.1% —> 7.5% —> 7.2% —> 6.3% -> 6.3% -> 6.0% -> 5.4% ->4.9% -> 4.5% -> 3.9% -> 3.5% -> 3.4% -> 3.2% -> 3.0% -> 2.9% ->2.6%
and revenue growth of 4.8% —> 4.8% —> 4.6% —> 4.3% -> 4.3% -> 4.2% ->4.0%-> 4.0%-> 4.0% -> 4.0% -> 4.0% -> 3.8% -> 3.7% -> 3.6% -> 3.6% -> 3.6%
For CY 2019, analysts are projecting earnings growth of 3.4% —> 3.2% —> 2.7% -> 2.6% -> 2.4% -> 2.3% -> 1.7% -> 1.9% -> 1.5% -> 1.5% -> 1.4% -> 1.3% -> 1.3% -> 1.3% -> 1.2%
and revenue growth of 4.7% —> 4.7% —> 4.5% -> 4.4% -> 4.3% -> 4.4% ->4.4% -> 4.4% -> 4.3% -> 4.4% -> 4.3% -> 4.2% -> 4.1% -> 4.1% -> 4.1%
For Q1 2020, analysts are projecting earnings growth of 10.5% -> —> 9.8% -> 9.5% ->9.2% –>9.0% -> 8.5% -> 8.2% -> 8.1% -> 7.9% -> 7.9% -> 7.8% -> 7.6%
and revenue growth of 6.2% —>5.8% -> 5.9% ->5.9% -> 5.7% -> 5.6% -> 5.7% -> 5.5% -> 5.5% -> 5.4% -> 5.4% -> 5.5%
For Q2 2020, analysts are projecting earnings growth of 13.3% —> 13.5% -> 12.0% ->12.6% -> 10.7 -> 9.9% -> 9.3% -> 9.2% -> 9.1% -> 9.0% -> 9.0% -> 8.7%
and revenue growth of 6.8% -> —> 6.6% -> 6.7% ->6.6% -> 6.5% -> 6.4% -> 6.5% -> 6.4% -> 6.4% -> 6.3% -> 6.3% -> 6.3%
For CY 2020, analysts are projecting earnings growth of 10.7% -> 10.6% -> 10.6% -> 10.6% -> 10.5%
and revenue growth of 5.6% -> 5.6% -> 5.6% -> 5.6% -> 5.7%
The series of projections for Q4 2019 has fallen from the first estimates from 8.1% down to 2.6%. It could turn negative as Q3 is already projected to be. Q3 is now being reported. Of companies with Q3 reports out, 19/21 have reported a surprise per FactSet. Remember, they lower and then they surprise! But in the end, what is important is whether earnings are accelerating or decelerating. Same for revenues.
Here’s a Brief Review of the Other Market Risks at Hand:
China Deal Risk: President Trump uttered no new threats this week, but keeps saying China is doing horribly etc. He had better come up with a deal, because if not, the market could tank when he then imposes another 5% to a large subset of tariffs on China. We need China to grow. We also need them to respect our intellectual property. If Trump faces impeachment with a collapsing stock market on “no China deal,” he is more at risk of impeachment. He’ll make a deal if he can, unless he’s going to “shoot the moon” and tank his own presidency to escape it and build towers all over Russia (which he was considering during the 2016 campaign). October 15th is the 5% tariff raise deadline Trump imposed on China.
Fed Rate Cut Risk: Now the probability is 76.4% the Fed cuts in October by 0.25% for the 3rd time as assessed by CME Group. An additional 4th cut in Dec. is at only 41.7% now. Remember, THREE cuts is a mid-cycle adjustment. Four means they expect recession.
What about January? The odds of cut #4 or even #5 are 67% now. This means the odds are even higher this week that we are going into a recession. Is it guaranteed? Of course not. It’s just one data point, but be clear that 4 or 5 or more rate cuts in total are NOT a mid-cycle adjustment in an ongoing economic expansion. It means there is considerable GDP slowing happening.
What about March? The odds are 75.1% for 4 or more cuts with some even expecting SIX cuts by then. Only 35.1% expect 5 or 6 cuts by then. Last week “44.4% expect a 4th cut by March 202o.” April? 79.7% expect there to have been 4 or more cuts. Last week “50.3% by April 2020 (45.2% last week).” A minority, 43.7%, expect the number of cuts to exceed four by April.
Last week:
“Let’s hope that 4 rate cut probability drops below 50% soon, or it means investors are EXPECTING A RECESSION vs. a further recovery!”
I’ll stick to this game plan and “Roller-coaster Map”:
“As my loyal readers know, if there’s a recession, think up to MORE than December’s decline times two, or a Big Bear Market as I call it.
In sum, the market goes down further as Q3 Earnings hit the fan. Things should improve into year end and at the start of 2020, so the market then rallies. A final high is reached prior to the discounting of a recession, which brings on a ‘Big Bear Market.’ Got it? 😉 It’s a roller-coaster we’re now on. “
U.S. Iran War Risk: Consensus is that Iran was responsible for the attack on Saudi oil interests. Quiet for now, because Trump hates wars, and Iran was trying to force the U.S. to negotiate with them and end sanctions. He is saying it’s the Saudi’s decision to react, but it’s not. It’s ours. We are the only ones that can save the Saudi kingdom. If Iran attacks our troops in Saudi Arabia, a major war would begin. And Iran would lose, and we would lose great American soldiers. Let’s pray for peace! I think peace is actually more likely, because the alternative is so grim for both sides. Trump would lose the 2020 Election if he starts another Middle East war based on protecting Saudi oil interests! That thought is totally Anti-Trump. That should be crystal clear to all.
2020 Election Risk: True still: “Trump is purposely attacking Biden as he sees him as his top rival. He wants to frame the election as “Capitalism vs. Socialism” as it appears Warren is now the #2 pick of the Democrats in the past two polls.”
Bernie’s health issue is a big problem for his campaign. I wrote about the history of illness on the campaign trail last week. They used to hide it. JFK was one of our sickliest presidents as he had Addison’s Disease among other problems. Yet the public was not privy to the fact that he nearly died multiple times. Now we’re aware of almost everything, or so we think. If Bernie weakens further, he could drop out and cede a lot of his support to Warren, who then would be far ahead of Biden.
Trump Impeachment Risk: Trump may or may not be impeached. It doesn’t matter (although the market may go into fear for a while over it as with Clinton). If there is no new evidence, the market says they don’t have enough to kick him out of office. That’s all that will matter unfortunately or fortunately despite the ups and downs the process may create over the next few months.
As I said last week:
“I think they have to at least “admonish” him as they did President James Buchanan as described HERE. Censure could make him un-electable, so they will try to avoid it, but they will censure him if the evidence is bad enough. If the Democrats cannot get a conviction, they’ll settle for “admonishment” or formal censure. Of course, that is a matter for negotiation and the Democrats could end up with “nothing” if they don’t agree to censure or less prior to a Senate trial, and then, if vindicated by the Senate, Trump will be able to say he was vindicated by the Senate, which we all know has it’s limitations due to partisanship. Still, he could use it in his campaign, especially with his base of voters.”
Deficit/Debt Threat: No important change. I’ll leave this here as a monument to our monumental debt, which could threaten interest rates in the future. When rates rise, there will be “heck to pay.”
Now take a look at the SP500 chart. The green line is 2940.91, the
9-21-2018 High preceding the decline ending December 24th. The upper yellow line is the next target (now at about 3073 a brand new ATH, but rises slowly over time).
SP500 Large Cap Index (click chart to enlarge; SPX, SPY):
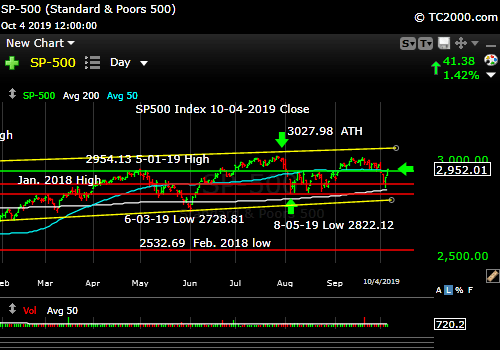
A bounce in a big rally or just a counter-trend move?
Now let’s check in on two “Canary Signals” we’ve been following:
“Intel-igent Market Timing Signal” (Intel; I*NTC; * there to throw off the crawlers!): Neutral. Intel is above the prior key level of 50.50 at a 50.92 close, but a move above 53.50 failed previously, so a higher high than that is required.
Bank of America (BAC) Market Timing Signal: Neutral. Off the low, but if the Fed is going to keep cutting rates, best to stay away. Other than the dividend, it’s made no progress since the end of 2017.
Keep up-to-date during the week at Twitter and StockTwits (links below) where a combined 34,144 investors are following the markets with me…
Follow Me on Twitter® Follow Me on StockTwits®.
Join the Conversation in the StockTwits “MarketTiming” Room
Now let’s go on to review investor sentiment…
Survey Says!
Sentiment of individual investors (AAII.com) showed a Bull minus Bear percentage spread of -18.07 vs -3.89% last week. It reached a level low enough to be supportive of a bounce. But the -18 number is not an extreme. That means a bottom has not been confirmed.
| Bulls | Neutrals | Bears |
| 21.37% | 39.19% | 39.44% |
| Thurs. 12 am CT close to poll | ||
2. U.S. Small Caps Market Timing (IWM):
Bouncing from the low of the recent range. If earnings season is bumpy, they could suffer further declines. I’d say from here it could be a trade, but no more until growth in GDP accelerates again. Then buy them.
Russell 2000 U.S. Small Cap Index (click chart to enlarge; IWM, RUT):
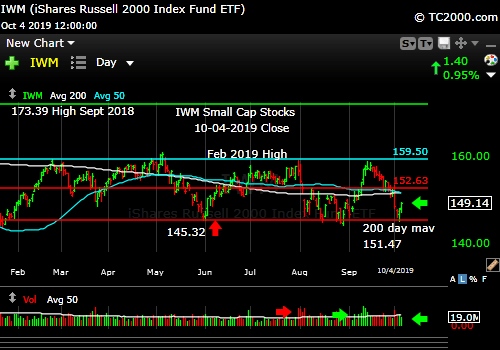
Small caps bounce off low of recent range.
3. Gold Market Timing (GLD):
I’ll stand by this for now:
“This is not yet the time to pivot out of gold trades in my view. As long as the Federal Reserve is still lowering interest rates, gold/gold stocks will do well. When inflation starts to rise again, we [MAY] have to sell our trading positions in gold.”
The above actually depends on the Fed’s reaction time as inflation rises, as I’ll get too soon.
I said last week: “The G*LD trend will be negative below 139.35.” It tested to 137.80 and then bounced. There is a debate in the market concerning the direction of inflation from here. The bond market seems assured of even lower rates. The rally in rates into mid-September has been crushed. If inflation accelerates a bit (data supports a mild rise over the next few months vs. the prior year), and the Fed is still lowering rates, gold will do very well. They lower rates due to GDP slowing, remember. If that causes inflation to accelerate we have ta-da, stagflation, which gold likes. If the Fed stimulates some growth, gold will not like that, as stocks beat gold in the setting of rising GDP growth and rising inflation.
When the Fed starts raising rates again, gold will take an even bigger hit IF they get out ahead of inflation from GDP growth. But that is for the future. The worst condition for gold is strong GDP acceleration, because of the competition. Stagflation? Gold loves it. When the Fed lets inflation run wild, as in the late 70’s, gold flies.
The Gold ETF (click chart to enlarge the chart; GLD):

Gold has retrace tested a breakout and now must move up in a definitive way.
4. Interest Rate Market Timing (10 Year Treasury Yield; TNX, IEF, TLT):
From last week: “We got to 1.903% last week and have been sliding down the 50 day mav since. It’s unusual to see any investment slide down a mav like that and not fall further, so my money is on lower rates and higher gold/gold stocks.”
That’s what happened. Rates slid and gold bounced.
Now what TNX does is key. IF TNX skids further than it has, particularly to a new all time low, that means the bond market expects a U.S. recession, and a U.S. stock market crash (even if it happened slowly in a cascading fashion) could occur, particularly if there was a rapid “Negative Rate Shock” as defined at the base of this report. It also would imply the bond market felt the Fed was doing too little, lowering rates too slowly, and was risking deflation. Powell’s “Good Place” as he calls our economy’s state may transform in time to a “Bad Place.” “Good” is not “Excellent”!
Answer? Sometimes Trump is right. The Federal Reserve per the sick game they play is “behind.” I say that because they seek to control the economy rather than allow the economy to ebb and flow. Excesses are built up due to their tinkering. Lower rates will hurt the U.S. dollar, and drive up U.S. inflation for consumers. Is that good or is it bad when your money is worth less and less? It’s an ongoing debate, yes…
Check out the “Market Signal Summary” below – after you review the following chart…
U.S. 10 Year Treasury Note Yield (click chart to enlarge; TNX, IEF, TYX, TLT, TBF):
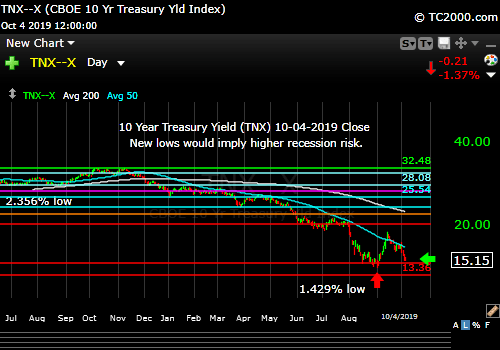
A brand new lower low would imply higher recession risk.
Now let’s review three key market timing signals together….
Do not use these signals as a trading plan. They are rough guidelines. I currently share my BUYS and SELLS in as timely a way as possible on social media (links above).
MY MARKET SIGNAL AND TREND SUMMARY for a Further U.S. Stock Market Rally with Real GDP Growth (“Real” means above inflation):
Stock Signal YELLOW for a further U.S. stock market rally with a NEUTRAL SP500 Index trend. More progress is needed before flipping the trend signal to Bullish for the SP500 Index. The stock signal is based on small caps, as they often lead the market down. They are bouncing, but only within a range.
The V*IX (which relates to SPX volatility; * added to symbol to throw off the webcrawlers!) These are the targets: 13.31, 14.04-14.08, 15.04, the “fulcrum” range = [15.94-15.95 to 16.09], 17.06, 17.27, and 17.89. The bonus target, #8, I am no longer keeping in the main score tabulation. The Bears have 3 (barely) of 7 targets at a VIX of 17.04 (Friday close).
The ‘Bull Nirvana Target’ is 13.31.” (That is target #7 for the Bulls.)
Gold Signal YELLOW for a further U.S. stock market rally with a NEUTRAL Gold Trend. What gold does mostly as I’ve written HERE is follow real interest rates.
From before: “Remember GLD is being used as an indicator for the ECONOMY here.” If gold continues to rise, it means the market believes real rates will fall, which in the current context means the global economy is slowing. That will ultimately hurt U.S. stocks.
Rate Signal RED for a further stock market rally with a long term BEARISH and short term Bearish 10 Year Yield Trend. (Remember: lower rates mean higher bond and Treasury prices) We are back testing the prior low on the daily chart. Not good if you expect a strong economy to emerge anytime soon. (See above comments.)
I’ll add this reminder from 9-20-2019’s issue cited above: “Remember, FOUR Fed cuts will NOT be a “mid-cycle adjustment” and would be taken badly by the market ironically, considering the market’s addiction to lower rates. ***A fourth cut means the Federal Reserve is seeing recession risk as significantly high.***”
Also for Reference: “Rates usually RISE slowly in a strong recovery and the stock market rally continues as they rise, as I’ve repeated multiple times on social media and here. Empirically though, rates that are “lower” (than 3.11%) and are NOT rising rapidly have allowed the market to climb back above the prior all time high (ATH).”
I said weeks ago, “Watch the oil price too. Higher oil tends to mean higher rates.” It closed at 52.81 vs. 55.91 last week, and is coming off the low of the range. Still holds: If it rises above 58.82 and then 60.94, oil and oil stocks will be off to the races. 63.38 would be the next target.
Just a reminder: If TNX bounces too quickly and too high, this will give rise to Rate Shock III… As said before: “Watch the rate at which TNX climbs if the current trend reverses. If it shoots up very fast, stocks will correct.” In the Sept. 28th issue: “A rapid push higher in rates would mean trouble for stocks, as occurred in early 2018. That’s what I called ‘Rate Shock.'” The period of rising rates in early October I called #RateShockII.
The risk lately has been “Negative Rate Shocks.” (Not negative rates in the U.S. yet! “Negative” refers to the direction of the shock.) First we had “Negative Rate Shock I” in December 2018 (because rates FELL while the Fed raised the Fed Funds rate 0.25% in mid-December, in what was perceived as a policy error by critics), “Negative Rate Shock II” in May, and “Negative Rate Shock III” in August, which is on pause and awaiting the next pivot. Note that rates are again FALLING.
Thank you for reading. Would you please leave your comments below where it says “Leave a Reply”… or ask a question or report a typo…
Pay it forward by sending the link to MarketTiming.Blog (that link will immediately connect them to this webpage) to a relative or friend. Thanks for doing that.
Be sure to visit the website for more general investing knowledge at:
Standard Disclaimer: It’s your money and your decision as to how to invest it.
I thank Worden Brothers for the charting system I use to post these charts. If you want to know more about the charting system I use every day, contact me. It makes it much easier to follow along with me if you can see the charts and manipulate them on your own computer. It’s a great investment to have an excellent charting system.
Note: I’ve updated my criteria for the equity signal for a further U.S. stock market rally to the following: GREEN = Bullish, YELLOW = Neutral, RED = Bearish. In other words, the colors tell you whether the signal supports the stock rally or not, while the Bullish, Neutral, and Bearish designations are about the trend.
A BEARISH trend signal does not mean we should not buy. A BULLISH trend signal does not mean you cannot sell some exposure. It depends on what is going on in the economy and how oversold/overbought the market is at a given point whether the Bearish signal is to be sold or bought, sold on the next bounce, etc. and whether a Bullish signal is to be bought or if profits should be taken. A NEUTRAL trend signal does not mean the end of the Bull or Bear. It means to wait and look for possible subsequent entry points within the existing trend, Bull or Bear, but preserve capital if the entry fails. Our strong intention is to buy low and sell high. By the way, I will keep showing the prior orange “Trigger lines” in the IWM and GLD charts for now as reference points only; they have historical value for us from the post-2016 election period.
Copyright © 2019 By Wall Street Sun and Storm Report, LLC All rights reserved.
