A Market Timing Report based on the October 11, 2019 Close, published Saturday, October 12th, 2019…
I deliver focused comments on market timing once a week. These are supplemented with daily “Tweets/StockTwits” (see links below) and comments in the “markettiming” room on StockTwits.
I provide quite a bit of intraweek commentary, and if you don’t see it, you will miss out on quite a bit of context, so please click on the social media links below and have a read… Thank you as always for being loyal readers and interacting on social media with your questions and comments!
1. SP500 Index Market Timing (S&P 500 Index®; SPY, SPX):
We are headed into earnings season in earnest in the coming weeks starting on Tuesday. (Monday banks are closed; equity market is open, but no earnings releases appear to be scheduled.) The data out so far is worse than what is expected for the SP500 Index as a whole, and we will need to wait for the flood of earnings that is now upon us. This week alone, as you’ll see in the “Earnings Risk/Opportunity” section, analyst earnings estimates for Q3 dropped 22%. That number will be refined over and over until we get the final result for Q3.
Earnings Season will entail individual risk to some companies, which will result in sudden bursts of volatility and downside for their stocks, while others will be volatile to the upside. That is the usual, and the violence inflicted upon the companies trading at Price:Sales of 10-20 times or more will be particularly harsh. You had better be sure those companies will hit their numbers, and not be caught holding them if at all possible.
In chart terms we are at about 57%ish from the base to the top of the channel defined by the two yellow trend lines in the chart below. That’s not a great place to add. Even with the so called “Partial Trade Deal” with China, we are only 0.61% above the close of the previous Friday.
Per the prior Bull argument, the Fed is coming to the rescue of the U.S. from global GDP slowing, but the China trade issue is one thing that is making it easier for the Federal Reserve to lower rates, so what if that goes away? Does the Fed have to cut rates as much? Probably not, BUT the global economy was already slowing before the tariffs made it all worse, so the Fed will likely continue to cut at least one more time.
What is happening “Under the Hood” this week?
1. Even this week, utilities (XLU) continued to outperform every other sector since the Aug. 5th low on up. That is even with a significant bump up in rates since Weds. Only Tech (XLK) is barely below the returns for utilities, with a lower yield of course (1.26% vs. 2.92% for Utilities XLU Ref.).
2. Still true from last week: “If you believe Utilities represent a signal, then the Fed is not done lowering rates and they may lower them more than expected. This drives more and more money into utilities until they too are overvalued, and they too fall when the entire market falls as one great sinking ship.”
Use stops on your positions. Mental stops only or set intraday stop-limit orders (set the spread wide enough to allow your sell to go off; to do that, you’ll need to see trades go off in real time. You won’t always get your fill , which is why you should also set an alert at the sell price to make sure your shares were sold! In my experience, if you set the spread right on a stop-limit, your trade will go off over 95% of the time. Check up on the stock/ETF each day if the price is close to your stop and reset the stop as needed. Limit orders that are not close to the current market price are dangerous in the case of a Flash Crash. And the other thing is your shares sit there for market makers to pick off if you enter stops into the market, and then they guide the market back up.
3. Second place? That is taken by XLRE (Real Estate) and XLP (Cons. staples), which are running neck and neck. Nothing else is working noticeably better than the SP500 Index.
4. Warning: (from last week) XLP: If inflation accelerates over the coming couple of quarters, consumer staples will have problems as their input costs rise. They only work in periods like December. Falling rates will hurt XLF, while rising rates will help them in general.
Let’s turn to the state of the market, which has made a lower high vs. the top yellow line in the SP500 Index market timing chart below…
What would satisfy me that the Bulls are serious?
The Bull Market Health Score this week is Bulls 4.0/Bears 1.0 vs. Bulls 2.0/Bears 3.0 last week.
That supports my upside call for the SP500 Index of the top yellow line on the chart below at 3052ish (and rising slowly).
For each checklist item below, I give you the points scored as Bullish or Bearish.
1. New high? Bulls 0.5 point. Answer: No. But there is a bounce, so 0.5 pt scored by the Bulls. Another issue is the weakness across the matrix (see below).
2. V*IX trend favorable? Bulls 0.5 Answer: Neutral. The VIX fell to 15.58 at the close Friday, with support at 15.51. It needs to drop below there to move into a down trend. However, the V*IX Game Score as I call it is Bulls 4/Bears 3 (7 point scale) as of the close Friday. The midpoint is the “fulcrum” and the Bulls are one point over it (details at base of report)
3. AD % Line in an Uptrend? (This is a proprietary stat; see base of report.): Bulls 1.0 point. Answer: Yes. The close was 16,686 vs. 16,649 last week. A higher low was formed, so the up trend has resumed for this indicator.
4. Higher volume on Up Moves? Lower volume on Down moves? Bulls 1.0 point. Answer: Yes. It was OK for large caps and much stronger for small caps, although the latter gave up a lot of ground, when the limited extent of the China deal was revealed, so part of that volume was “distribution” vs. real buying.
5. Is the “U.S. Index Matrix Signal,” as I call it, positive? Bulls 1.0 point. Answer : Yes. The small and mid caps did respond as they should have, with a bit less enthusiasm than expected.
Let’s check in on the context around the price action of the market by looking at the current Market Risks…
We have some new earnings data this week…
Earnings Risk/Opportunity: what is shown are the projections in the FactSet 3-15-19 report followed by the reports from 4-12-19 through 8-09-19 with a skip of two weeks until the 8-30-19 data resumes the weekly data sequence (details HERE)… The arrows “—>” indicate 3 weeks of of omitted data in order to compress the data.
For Q2 2019, analysts are projecting earnings growth of 0.1% —> -1.3% -> —> -2.1% —> -2.6% -> -2.6% -> -3.0% -> -1.9% -> -2.6%-> -1.0% -> -0.7% -> -0.4% DONE
and revenue growth of 4.6% —> 4.3% —> 4.1% —> 3.8% -> 3.8% -> 3.7% -> 3.8% ->4.0% ->4.1% -> 4.1% -> 4.0% DONE
For Q3 2019, analysts are projecting earnings growth of 1.8% —> 0.8% —> 0.3% —> -0.5% -> -0.5% -> -0.8% -> -1.4% ->-1.9% -> -2.2% -> -3.1% -> -3.5% -> -3.6% -> -3.7% -> -3.8% -> -3.7% -> -4.1% -> -4.6%
and revenue growth of 4.4% —> 4.4% —> 4.2% —> 3.8% -> 3.8% -> 3.3% -> 3.2% ->3.2% -> 3.1% -> 3.0% -> 3.1% -> 2.9% -> 2.8% -> 2.8% -> 2.8% -> 2.8% -> 2.7%
For Q4 2019, analysts are projecting earnings growth of 8.1% —> 7.5% —> 7.2% —> 6.3% -> 6.3% -> 6.0% -> 5.4% ->4.9% -> 4.5% -> 3.9% -> 3.5% -> 3.4% -> 3.2% -> 3.0% -> 2.9% ->2.6% -> 2.3%
and revenue growth of 4.8% —> 4.8% —> 4.6% —> 4.3% -> 4.3% -> 4.2% ->4.0%-> 4.0%-> 4.0% -> 4.0% -> 4.0% -> 3.8% -> 3.7% -> 3.6% -> 3.6% -> 3.6% -> 3.5%
For CY 2019, analysts are projecting earnings growth of 3.4% —> 3.2% —> 2.7% -> 2.6% -> 2.4% -> 2.3% -> 1.7% -> 1.9% -> 1.5% -> 1.5% -> 1.4% -> 1.3% -> 1.3% -> 1.3% -> 1.2% -> 1.1%
and revenue growth of 4.7% —> 4.7% —> 4.5% -> 4.4% -> 4.3% -> 4.4% ->4.4% -> 4.4% -> 4.3% -> 4.4% -> 4.3% -> 4.2% -> 4.1% -> 4.1% -> 4.1% -> 4.1%
For Q1 2020, analysts are projecting earnings growth of 10.5% -> —> 9.8% -> 9.5% ->9.2% –>9.0% -> 8.5% -> 8.2% -> 8.1% -> 7.9% -> 7.9% -> 7.8% -> 7.6% -> 7.3%
and revenue growth of 6.2% —>5.8% -> 5.9% ->5.9% -> 5.7% -> 5.6% -> 5.7% -> 5.5% -> 5.5% -> 5.4% -> 5.4% -> 5.5% -> 5.3%
For Q2 2020, analysts are projecting earnings growth of 13.3% —> 13.5% -> 12.0% ->12.6% -> 10.7 -> 9.9% -> 9.3% -> 9.2% -> 9.1% -> 9.0% -> 9.0% -> 8.7% -> 8.6%
and revenue growth of 6.8% -> —> 6.6% -> 6.7% ->6.6% -> 6.5% -> 6.4% -> 6.5% -> 6.4% -> 6.4% -> 6.3% -> 6.3% -> 6.3% -> 5.9%
For CY 2020, analysts are projecting earnings growth of 10.7% -> 10.6% -> 10.6% -> 10.6% -> 10.5% -> 10.6%
and revenue growth of 5.6% -> 5.6% -> 5.6% -> 5.6% -> 5.7% -> 5.6%
The series of projections for Q4 2019 has fallen from the first estimates from 8.1% down to 2.3% this week. It could turn negative as Q3 is already projected to be, and Q3 earnings fell another notch down this week from -4.1% to -4.6%, a 22% drop as said. That’s not the directional change you want to see at the very start of earnings. Of course, the next couple of weeks will be a far greater test.
Here’s a Brief Review of the Other Market Risks at Hand:
China Deal Risk: President Trump is going to make a partial deal, because he needs it politically, as he faces near certain impeachment. Conviction is another thing as I’ve covered in past issues.
Some of what will be agreed to supposedly:
1. Chinese buy 40-50 Billion in ag products.
2. U.S. does not raise tariffs on 250B in Chinese imports from 25% to 30%. Not exactly a “concession.”
3. Unspecified provisions governing intellectual property. We’ll see…
4. The opening of China’s financial services market. Good for our big banks. They can get even bigger!
5. A ban on using currency as a trade weapon. Not sure how that works when on one side there are increases in tariffs to match the currency weakening of the other side.
The Big Little China Trade Deal leaves out:
1. Lots of tariffs still in place on agriculture and non-ag goods.
2. Forced tech transfer, which the Chinese deny despite the facts. Apparently, it’s #FakeNews to them. 😉
3. Chinese subsidies to industries competing with the U.S.
Per the Washington Post: This Trump said is expected to be “papered” over “the next four weeks.” Trump and Chinese President Xi plan to meet in Chile at an Asian-Pacific leaders summit in mid-November. That’s where they would likely sign a “Part One U.S. China Trade Deal.”
The farmers, important to Trump’s re-election, say ““This agreement seemingly does nothing to address the crippling tariffs farmers currently face. The promise of additional ag purchases is welcome news but details on timeline, price, commodities and many other questions will have to be answered,” said Brian Kuehl, of Farmers For Free Trade.”
Fed Rate Cut Risk: Now the probability is 75.4% the Fed cuts in October by 0.25% for the 3rd time as assessed by CME Group. An additional 4th cut in Dec. has DROPPED in probability from 41.7% to 24.5% this week vs. last week.
Remember, THREE cuts is a mid-cycle adjustment. Four means they expect recession.
What about January? The odds of cut #4 or even #5 are 38.2% vs. 67% last week! What this means is the perceived risk of recession has fallen now that there is going to be some sort of limited trade deal and that further tariffs could be put off indefinitely.
What about March? The odds are 44.7% vs. 75.1% last week for 4 or more cuts. Only 10% vs 35.1% last week expect 5 or 6 cuts by then. April? 48.5% vs. 79.7% last week expect there to have been 4 or more cuts. A minority, now only 13.0% vs. 43.7% last week, expect the number of cuts to exceed four by April.
Lucky for the Bulls, the expectation that a “Recession Auguring” 4 cuts will be required from now to April has fallen below 50%. I’d say that is a sign of increasing Bullishness on the economy.
Even clearer on this today… I’ll stick to this game plan and “Roller-coaster Map”:
“As my loyal readers know, if there’s a recession, think of up to MORE than December’s decline TIMES TWO, or a “Big Bear Market” as I call it.
In sum, the market goes down further as Q3 Earnings hit the fan. Things should improve into year end and at the start of 2020, so the market then rallies. A final high is reached prior to the discounting of a recession, which brings on a ‘Big Bear Market.’ Got it? 😉 It’s a roller-coaster we’re now on. “
Punchline: As I’ve argued on sentiment terms alone (though we don’t use just one factor), we have not reached the highest high we’ll see prior to the next recession.
U.S. Iran War Risk: RISING: The Saudi’s shot missiles at an Iranian tanker. The Iranians did not immediately react, fearing a war with Trump perhaps, but just a few hours ago it was reported that Iran intends to strike back. We’ve sent more troops and weapons over in the meantime. If they endanger U.S. troops, the country of Iran will be laid to waste. That is not in anyone’s best interest. It costs a trillion dollars or two and lot of our best men and women to do it. Let’s pray that cooler heads prevail.
2020 Election Risk: Things can turn from here, but Biden is now at risk due to his swampish behavior in associating himself with an official policy to route out corruption in Ukraine. He should have recused himself, and his son should not have taken money from Ukraine for doing a job he lacked skills to do. Still, it’s legal to be a swamp creature in our country, and Trump is yet another swamp animal. He now has Fox News as his “State TV” station, having driven out Shepard Smith. Only Chris Wallace is left and he has what is referred to as a “network show.” It’s Swamp vs. Swamp! See why I want a third party? 😉
Trump Impeachment Risk: CHANGED. Censure/Admonishment of Trump seems an unlikely path now. Trump will be impeached. It’s all but certain now that the two suspicious guys connected to Ukraine with one way tickets were picked up at the airport. They were working with Rudi Giuliani to get dirt from Ukraine on the Bidens and were also funneling campaign funds from Ukraine to Trump’s re-election campaign. All illegal. Rudi was working for Trump on the Bidens. So put 2 and 2 together.
Impeachment odds are easily above 95%. And Trump deserves it (or at least formal censure for it; if repeated, he should be kicked out). What he did was dead wrong. He had zero right to target his opponent, while claiming to eliminate corruption from Ukraine. He was caught red handed and essentially on tape (on transcript), just like Richard Nixon was. But Trump still may not be convicted.
It will take connecting Trump to foreign campaign contributions to convict him. The GOP would have to convict on that basis alone. BUT if the evidence stops with the Ukraine transcript, he won’t be convicted, and he’ll use the “verdict” for his re-election campaign. The Democrats are taking a risk.
Right now the market is saying “No Conviction of Trump.” However, the market may go into fear for a while as the investigation goes on, as with Clinton.
Deficit/Debt Threat: No important change. I’ll leave this here as a monument to our monumental debt, which could threaten interest rates in the future. When rates rise, there will be “heck to pay.” The U.S. dollar remains at risk and having at least 5% gold exposure is a must in any portfolio. Some say higher, but owning stocks is also a hedge that over time would work out for solid companies, even in the face of very high inflation (not in the case of bankruptcies of course!).
Now take a look at the SP500 chart. The green line is 2940.91, the
9-21-2018 High preceding the decline ending December 24th. The upper yellow line is the next target (now at about 3073 a brand new ATH, but rises slowly over time).
SP500 Large Cap Index (click chart to enlarge; SPX, SPY):
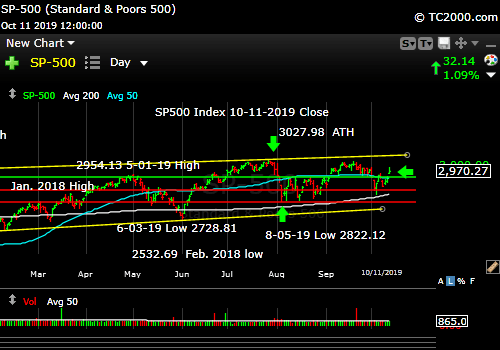
Market timing the Partial trade deal bounce!
Now let’s check in on two “Canary Signals” we’ve been following:
“Intel-igent Market Timing Signal” (Intel; I*NTC; * there to throw off the crawlers!): Neutral. Same as last week, even after the “Mini Trade Deal” 3 day bounce. Intel is above the prior key level of 50.50 at a 52.09 close, but a move above 53.50 failed previously, so a higher high than that is required for it to turn Bullish.
Bank of America (BAC) Market Timing Signal: Neutral. It is in the middle of its range for 2019. A new high is the way for the Bulls to change the picture. Target? 31.17. If the Fed is in fact lowering rates, it makes no sense to chase BAC. When they stop, and the economy is accelerating, it will be a buy.
Keep up-to-date during the week at Twitter and StockTwits (links below) where a combined 34,144 investors are following the markets with me…
Follow Me on Twitter® Follow Me on StockTwits®.
Join the Conversation in the StockTwits “MarketTiming” Room
Now let’s go on to review investor sentiment…
Survey Says!
Sentiment of individual investors (AAII.com) showed a Bull minus Bear percentage spread of -23.65% vs -18.07% last week. Still no extreme low, but as I said last week, it was already low enough to support a bounce at -18.07%.
| Bulls | Neutrals | Bears |
| 20.31% | 35.73% | 43.96% |
| Thurs. 12 am CT close to poll | ||
2. U.S. Small Caps Market Timing (IWM):
Note the failure to hold a level above 2 of 3 of the August highs. It could fail right here, but we’ll see. Large caps are stronger still, and I’ll stick with them. Specific small cap names are another thing.
Russell 2000 U.S. Small Cap Index (click chart to enlarge; IWM, RUT):

Bounce above one of three August highs.
3. Gold Market Timing (GLD):
I’ll stand by this for now:
“This is not yet the time to pivot out of gold trades in my view. As long as the Federal Reserve is still lowering interest rates, gold/gold stocks will do well. When inflation starts to rise again [and the Fed hikes rates] we MAY have to sell our trading positions in gold.”
The above actually depends on the Fed’s reaction time as inflation rises. Gold should be safe as long as inflation is ticking up while the Fed is lowering rates or holding steady. Right now “holding steady” may not be appreciated, unless inflation is rising, but if the China situation does materially improve, interest rates may start to climb and drag the Fed along, endangering the gold trade, if the Fed hikes too aggressively. So yes, you should be on edge in regard to your gold trading position. Your core gold position? My decision has been to hold it as insurance. Do what you feel is best for you.
Read last week’s post to catch up on the Gold Scenarios of stagflation (slowing GDP growth and rising inflation) and GDP growth with rising inflation, or “GrowFlation” as I’ve called it before (link to upper right).
I said two weeks ago: “The G*LD trend will be negative below 139.35.” It tested to 137.80 and then bounced.
Rate pressure on gold may not be done yet! Buy the lows, rather than chase bounces and use stops on current profits. As said, I keep a core GLD position at all times, but the trades will come and go. When things change, we change…
The Gold ETF (click chart to enlarge the chart; GLD):

Gold on pause.
4. Interest Rate Market Timing (10 Year Treasury Yield; TNX, IEF, TLT):
This week, rates rose for three days in a row into Friday, because the market believes a trade deal with China means higher GDP growth, higher inflation, and fewer Fed rate cuts. The odds cited above from CME Group on Fed rate cuts tell the same story.
I’ll leave this from last week: “IF TNX skids further than it has, particularly to a new all time low, that means the bond market expects a U.S. recession, and a U.S. stock market crash (even if it happened slowly in a cascading fashion) could occur, particularly if there were a rapid ‘Negative Rate Shock’ as defined at the base of this report. It also would imply the bond market felt the Fed was doing too little, lowering rates too slowly, and was risking deflation.“
Check out the “Market Signal Summary” below – after you review the following chart…
U.S. 10 Year Treasury Note Yield (click chart to enlarge; TNX, IEF, TYX, TLT, TBF):

Yields jump on partial trade deal.
Now let’s review three key market timing signals together….
Do not use these signals as a trading plan. They are rough guidelines. I currently share my BUYS and SELLS in as timely a way as possible on social media (links above).
MY MARKET SIGNAL AND TREND SUMMARY for a Further U.S. Stock Market Rally with Real GDP Growth (“Real” means above inflation):
Stock Signal YELLOW for a further U.S. stock market rally with a BULLISH SP500 Index trend. The stock signal is based on small caps, as they often lead the market down. The bounce is not yet enough to change the Stock Signal.
The V*IX (which relates to SPX volatility; * added to symbol to throw off the webcrawlers!) These are the targets: 13.31, 14.04-14.08, 15.04, the “fulcrum” range = [15.94-15.95 to 16.09], 17.06, 17.27, and 17.89. The bonus target, #8, I am no longer keeping in the main score tabulation. The Bears have 4 of 7 targets at a VIX of 15.58 (Friday close).
The ‘Bull Nirvana Target’ is 13.31.” (That is target #7 for the Bulls.)
Gold Signal YELLOW for a further U.S. stock market rally with a NEUTRAL Gold Trend. What gold does mostly as I’ve written HERE is follow real interest rates.
From before: “Remember GLD is being used as an indicator for the ECONOMY here.” If gold continues to rise, it means the market believes real rates will fall, which in the current context means the global economy is slowing. That will ultimately hurt U.S. stocks.
Rate Signal NEUTRAL for a further stock market rally with a long term BEARISH and short term Bearish 10 Year Yield Trend. (Remember: lower rates mean higher bond and Treasury prices) There has not been enough of a rise of rates to threaten the trends over those two time periods.
I’ll add this reminder from 9-20-2019’s issue cited above: “Remember, FOUR Fed cuts will NOT be a “mid-cycle adjustment” and would be taken badly by the market ironically, considering the market’s addiction to lower rates. ***A fourth cut means the Federal Reserve is seeing recession risk as significantly high.***”
Also for Reference: “Rates usually RISE slowly in a strong recovery and the stock market rally continues as they rise, as I’ve repeated multiple times on social media and here. Empirically though, rates that are “lower” (than 3.11%) and are NOT rising rapidly have allowed the market to climb back above the prior all time high (ATH).”
I said weeks ago, “Watch the oil price too. Higher oil tends to mean higher rates.” It closed at 54.70 vs. 52.81 last week vs. 55.91 the week before, and is barely coming off the low of the range. Still holds: If it rises above 58.82 and then 60.94, oil and oil stocks will be off to the races. 63.38 would be the next target. Since May, the price of oil almost appears to have been managed to stay between 50 and 59/barrel. I wonder why? 😉
Just a reminder: If TNX bounces too quickly and too high, this will give rise to Rate Shock III… As said before: “Watch the rate at which TNX climbs if the current trend reverses. If it shoots up very fast, stocks will correct.” In the Sept. 28th issue: “A rapid push higher in rates would mean trouble for stocks, as occurred in early 2018. That’s what I called ‘Rate Shock.'” The period of rising rates in early October I called #RateShockII.
The risk lately has been “Negative Rate Shocks.” (Not negative rates in the U.S. yet! “Negative” refers to the direction of the shock.) First we had “Negative Rate Shock I” in December 2018 (because rates FELL while the Fed raised the Fed Funds rate 0.25% in mid-December, in what was perceived as a policy error by critics), “Negative Rate Shock II” in May, and “Negative Rate Shock III” in August, which is on pause and awaiting the next pivot. The Stock Market Bulls had better hope that they don’t get more rate cuts past October.
Thank you for reading. Would you please leave your comments below where it says “Leave a Reply”… or ask a question or report a typo…
Pay it forward by sending the link to MarketTiming.Blog (that link will immediately connect them to this webpage) to a relative or friend. Thanks for doing that.
Be sure to visit the website for more general investing knowledge at:
Standard Disclaimer: It’s your money and your decision as to how to invest it.
I thank Worden Brothers for the charting system I use to post these charts. If you want to know more about the charting system I use every day, contact me. It makes it much easier to follow along with me if you can see the charts and manipulate them on your own computer. It’s a great investment to have an excellent charting system.
Note: I’ve updated my criteria for the equity signal for a further U.S. stock market rally to the following: GREEN = Bullish, YELLOW = Neutral, RED = Bearish. In other words, the colors tell you whether the signal supports the stock rally or not, while the Bullish, Neutral, and Bearish designations are about the trend.
A BEARISH trend signal does not mean we should not buy. A BULLISH trend signal does not mean you cannot sell some exposure. It depends on what is going on in the economy and how oversold/overbought the market is at a given point whether the Bearish signal is to be sold or bought, sold on the next bounce, etc. and whether a Bullish signal is to be bought or if profits should be taken. A NEUTRAL trend signal does not mean the end of the Bull or Bear. It means to wait and look for possible subsequent entry points within the existing trend, Bull or Bear, but preserve capital if the entry fails. Our strong intention is to buy low and sell high. By the way, I will keep showing the prior orange “Trigger lines” in the IWM and GLD charts for now as reference points only; they have historical value for us from the post-2016 election period.
Copyright © 2019 By Wall Street Sun and Storm Report, LLC All rights reserved.
