A Market Timing Report based on intraday chart data on January 6, 2020…
The context for the charts will be addressed on social media. I will periodically update the charts here in new posts along with the Bull Market Health Score without much comment. If you find this posting format useful, please let me know…
1-26-2020 UPDATE of Earnings Picture (see FactSet.com) for the S&P 500 Index: The data is for SPX earnings projections from Dec. 2019 up to last Friday. The order of the lines seen in the chart below are from the light blue line Q4 2019 at -1.9% last check to the yellow line which is Q2 2020 at 6.5%. The orange line is calendar year 2019 earnings which have been running nearly flat vs. 2018 at 02.% latest check. The long dark blue line near the top is calendar year 2020 Earnings and the short blue line is Q3 2020 and the short green line is Q4 2020. So you see, the earnings picture is going to becaome steadily more impressive on a year over year basis as the year goes by in comparison with the 2019 performance. This is a plus for the Bulls.

Earnings Outlook Q4 2019 and 2020
1. SP500 Index Market Timing (S&P 500 Index®; SPY, SPX):
What would satisfy me that the Bulls are serious?
The Bull Market Health Score this week is Bulls 2.5/Bears 2.5 vs. Bulls 4.0/Bears 1.0 in my mid-Dec. report. It’s a 5 point scoring system .
For each checklist item below, I give you the points scored as Bullish or Bearish.
1. New high? Bulls 1.0 Answer: Yes. Price continues to rise within the channel bounded by the red lines, although it represents a degree of stretch from the prior uptrend. That presents the risk.
2. V*IX trend favorable? Bulls 0.5 Answer: Neutral. Mixed picture. The VIX Game Score is Bulls 5/Bears 2 at a VIX of 14.24 at 1:51 pm ET. The Bulls failed to take 12.00 and hold it, so for now the trend is up. Being below the “fulcrum” (Bull target number 4 = fulcrum in the VIX Game) makes the continuation of this trend a coin flip.
3. AD % Line in an Uptrend? (This is a proprietary stat; see base of report.): Bulls 1.0 point. Answer: Yes. Has been flat for 7 trading days but in uptrend. Market has been flat as well, so there is a match.
4. Higher volume on Up Moves? Lower volume on Down moves? Bears 1.0 point. Answer: No. Volume increased on Jan. 3rd on the down move. It was not spectacular, but the Bears get this point.
5. Is the “U.S. Index Matrix Signal,” as I call it, positive? (To be positive, small and mid caps must be doing as well as large caps) Bears 1.0 point. Answer: Small caps may be putting in a lower high at this point. Remains to be seen. Midcaps are the better tell this week and now back below their 2018 high. Small caps never made it above their 2018 high.
Keep up-to-date and read my comments on the current setup during the week at Twitter and StockTwits (links below) where a combined 34,181 investors are following the markets with me…
Follow Me on Twitter® Follow Me on StockTwits®. (real time messages are on StockTwits as always and back on Twitter)
Join the Conversation in the StockTwits “MarketTiming” Room (I’ll publish comments in the room periodically)
Take a look at the SP500 chart. The long upper yellow line is now at about 3071 at the Friday close, but the current SPX value is much higher. The two short upper red lines show a narrow range in an uptrend, but rising ABOVE the prior upper yellow trend line of the longer term channel. As I warned many weeks ago, if the market keeps pushing above that top long yellow line, there will be eventual payback.
SP500 Large Cap Index (click chart to enlarge; SPX, SPY):

Trend still stretched to upside.
Now let’s review investor sentiment…
Survey Says!
Sentiment of individual investors (AAII.com) showed a Bull minus Bear percentage spread of 15.34% vs. +11.58% in mid Dec. Not impressive Bullishness, but the high Neutrals are Bullish for the market performance 6 months out.
| Bulls | Neutrals | Bears |
| 37.22% | 40.91% | 21.88% |
| Thurs. 12 am CT close to poll | ||
2. U.S. Small Caps Market Timing – Russell 2000 U.S. Small Cap Index (click chart to enlarge; IWM, RUT)
200 day moving average is now 155.02, not the number shown in the chart.

Small caps forming lower high?
3. Gold Market Timing (click chart to enlarge; GLD): Breakout (day 1)! Let’s see if it holds.
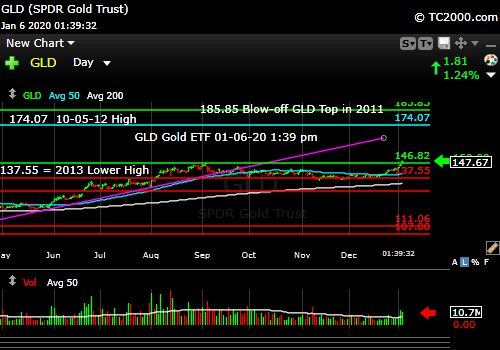
GLD breaking out (day 1).
Check out the “Market Signal Summary” below – after you review the following chart…
4. Interest Rate Market Timing (10 Year Treasury Yield; click chart to enlarge; TNX, IEF, TLT): Mixed technical picture (read more below in summary section).

Rate chart shows mixed signals over short term duration.
Now let’s review three key market timing signals together….
Do not use these signals as a trading plan. They are rough guidelines. I currently share my BUYS and SELLS in as timely a way as possible on social media (links above).
MY MARKET SIGNAL AND TREND SUMMARY for a Further U.S. Stock Market Rally with Real GDP Growth (“Real” means above inflation):
Stock Signal GREEN for a further U.S. stock market rally with a longer term Bullish and short term Bullish SP500 Index trend. The stock signal is based on small caps, as they often lead the market down. The small caps are pulling back in an uptrend, so that chart is still Bullish. As said, I don’t like the midcap action, so the Bullish designation could be argued IMO.
Gold Signal RED for a further U.S. stock market rally longer term Bullish Trend and a short term Bullish Gold Trend. I was correct about the pullback. It was temporary, but now we’re testing above a prior high (day 1), so we’ll see.
What gold does mostly as I’ve written HERE is follow real interest rates around the world (if you own “gold in dollar terms” you care about U.S. rates most of all). The rest of the world does matter however, including massive buying by central banks.
GUIDE: “Remember GLD is being used as an indicator for the ECONOMY here.” If gold continues to rise, it means the market believes real rates will fall, which in the current context means the global economy is slowing. That would ultimately hurt U.S. stocks.
Rate Signal NEUTRAL for a further stock market rally with a longer term BEARISH and short term Neutral 10 Year Yield Trend. (Remember: higher rates mean lower bond and Treasury prices). The trend is neutral short term, because rates are in a Bearish upward wedge and but are coming down from a Bullish ascending triangle. The failure to break the top of the triangle is Bearish of course, so the picture is MIXED in the short term. Lower rates at this point would be Bearish for the stock market. Financials have improved on HIGHER RATES, but are not beating SPX since the Dec. 3rd low.
Thank you for reading. Would you please leave your comments below where it says “Leave a Reply”… or ask a question if you like…
Pay it forward by sending the link to MarketTiming.Blog (that link will immediately connect them to this webpage) to a relative or friend. Thanks for doing that.
Be sure to visit the website for more general investing knowledge at:
Standard Disclaimer: It’s your money and your decision as to how to invest it.
I thank Worden Brothers for the charting system I use to post these charts. If you want to know more about the charting system I use every day, contact me. It makes it much easier to follow along with me if you can see the charts and manipulate them on your own computer. It’s a great investment to have an excellent charting system.
Note: I’ve updated my criteria for the equity signal for a further U.S. stock market rally to the following: GREEN = Bullish, YELLOW = Neutral, RED = Bearish. In other words, the colors tell you whether the signal supports the stock rally or not, while the Bullish, Neutral, and Bearish designations are about the trend.
A BEARISH trend signal does not mean we should not buy. A BULLISH trend signal does not mean you cannot sell some exposure. It depends on what is going on in the economy and how oversold/overbought the market is at a given point whether the Bearish signal is to be sold or bought, sold on the next bounce, etc. and whether a Bullish signal is to be bought or if profits should be taken. A NEUTRAL trend signal does not mean the end of the Bull or Bear. It means to wait and look for possible subsequent entry points within the existing trend, Bull or Bear, but preserve capital if the entry fails. Our strong intention is to buy low and sell high. By the way, I will keep showing the prior orange “Trigger lines” in the IWM and GLD charts for now as reference points only; they have historical value for us from the post-2016 election period.
Copyright © 2020 By Wall Street Sun and Storm Report, LLC All rights reserved.

Hey, Good to see you back… Been checking every day or Two… Thanks, Dale L…
You are welcome Dale! Good to hear from you!