A Market Timing Report based on the January 31, 2020 close…
The context for the charts will be addressed on social media during the week…be sure to read those posts as well, or you’ll miss at least half of the picture.
NOTE: For now, as part of this experiment, I will publish just after the last Friday/close of the week each month, so if the last Friday precedes the end of the month, I will publish on that corresponding weekend. (for example, posts will be on 2-29, 3-28, 4-25, 5-30 or the day after, meaning on Saturday most likely, or Sunday generally, but at the latest by the day prior to the next week’s open in the case of a holiday, which would be Sunday or Monday.) I may publish earlier each month if the market action requires it, as it did this week… A 3rd Wave began on Friday as you’ll read below…
If you want to be alerted to each post, please subscribe via WordPress, and you’ll receive an email each time I publish here… Thanks and feel free to comment or leave a question below…
1. SP500 Index Market Timing (S&P 500 Index®; SPY, SPX):
Why are we losing some of the previous stretch in the SP500 Index that I’ve been warning would happen? The Coronavirus 2019 nCoV is the excuse, not the cause of the drawdown. If governments lose control of it, it could have an important economic impact, but it will be stomped out in time, so the economic impact will be curtailed at some point. The earlier the better, but it will be stomped out despite the negative people out there subconsciously spending their energy wishing for it to spread (they will never admit that, but that is the state of their thinking).
I recommend against fear-based thinking. Look at the facts and learn how to prevent the spread of Coronavirus, and retweet my messages and you’ll help. (I don’t need your retweets, but the world clearly does… Please pay it forward.)
If you prefer negativity and doom predictions, please find another blog. 😉 We are looking for buying opportunities and places to lighten up when the markets are stretched, not trying to predict the end of the world. Hint: It’s not ending. Click my social media links below and read my posts on the virus. (here are my scientific credentials. My investing credentials are on my main page at SunandStormInvesting.com).
What would satisfy me that the Bulls are serious?
The Bull Market Health Score this week is Bulls 0.0/Bears 5.0 vs. Bulls 4.0/Bears 1.0 in my mid-Dec. report. It’s a 5 point scoring system .
For each checklist item below, I give you the points scored as Bullish or Bearish. If the number is “Bulls 0.0” that means the Bears score a point.
1. New high? (here I look at large caps alone) Bulls 0.0 Answer: No. Price has finally started to correct as I have been predicting. It’s called “Coming home to roost.” Stretched markets invariably correct and simply look for bad news to do so.
2. V*IX trend favorable? (VIX trend is either up, down or undecided and consolidating.) Bulls 0.0 Answer: No. The VIX Game Score is Bulls 0/Bears 7 at a VIX close Friday of 18.84. This level of volatility always ushers in the possibility of “much worse” volatility. Volatility is trending UP. Closing above the Dec. high is a distinct negative.
3. AD % Line in an Uptrend short term? (This is a proprietary stat; see base of report.): Bulls 0.0 point. Answer: No. I added “short term” this week, because it should be there. We are trying to capture the immediate health of the market vs. trying to time where it will be 3 months from now. The AD % Signal is at a point where stocks COULD bounce. “Could” is iffy with the VIX where it is unless the VIX immediately falls Monday.
4. Higher volume on Up Moves? Lower volume on Down moves? (Has to be true for either large caps or for both small and midcaps to be a “Yes.” If discrepant, the Score is 0.5) Bulls 0.0 point. Answer: No. We are definitively in a 3rd wave down which is the largest wave. Volume went up BIG on Friday on the down move. That was true across all “caps.”
5. Is the “U.S. Index Matrix Signal,” as I call it, positive? (To be positive, small and mid caps must be trending up with large caps; if mid and small caps are discrepant with each other the score is 0.5) Bulls 0.0 point. Answer: No. Small caps are breaking lower and leading the market lower.
Graph of the Bull Market Health Score
Note: 1000 = 1 BMHS point on the scale. SPX values are adjusted to plot them more easily on the same graph. (That means you should look at the relative changes in the SP500 Index (SPX), not read the values off the Y axis.)

Bull Market Health Score Update 1-31-2020
Note how my BMHS crashed to just 0.5 last week before the market had fallen much. Now it’s 0.0. This correction is already worse than the Dec. 3rd correction, because it’s entered a 3rd wave, so it’s not just a dip. Friday was the continuation of the 3rd wave down.
The minimum 3rd wave bottom if we go by the Fibonacci numbers would be 3127. Remember, if there are 5 waves the 5th wave can descend below the end of that 3rd wave low. The upper yellow line on the chart below, or the middle of the channel formed by the two yellow lines are also reasonable targets.
I don’t set price targets per se as many of you know. I just look to see WHERE the targets are. Then I evaluate the market after each move to decide whether it’s worth a buy. Since buys can be bounces vs. endpoints as was the case on the last move up (bounce in a downtrend), you have to be prepared to either 1. Ride out the volatility over a longer time frame OR 2. Cut some added exposure if you are too early. I did just that on Friday (see links below to social media and stay in touch during the week).
Update of Earnings Picture (see FactSet.com) for the S&P 500 Index: The data is for SPX earnings projections from Dec. 2019 up to last Friday. Some businesses will be impacted by Coronavirus over the shorter term, so those lines that have started going down will likely fall further… (see my comments on social media and on Facebook at MySchoolOfHealth). The virus (as sad as any loss of life is) is giving investors a buying opportunity, but we need to add in stages and at this point watch for signs the market is ready to bounce.

SP500 Index Earnings Data
Keep up-to-date and read my comments on the current setup during the week at Twitter and StockTwits (links below) where a combined 34,251 investors are following the markets with me…
Follow Me on Twitter® Follow Me on StockTwits®. (real time messages are on StockTwits as always and back on Twitter)
Join the Conversation in the StockTwits “MarketTiming” Room (I’ll publish comments in the room periodically)
Take a look at the SP500 chart. From before: “As I warned many weeks ago, if the market keeps pushing above that top long yellow line, there will be eventual payback.” This is the payback…
SP500 Large Cap Index (click chart to enlarge; SPX, SPY):
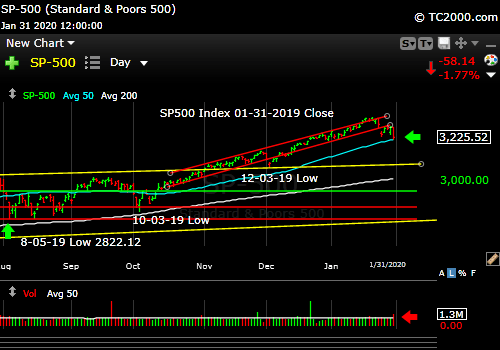
SPX is in the Third Wave down.
Now let’s review investor sentiment…
Survey Says!
Sentiment of individual investors (AAII.com) showed a Bull minus Bear percentage spread of -4.88% vs. 15.34% on 1-1-2020. This alone says there could be 1-2 weeks of downside ahead. The poll closes Weds. night, so Friday’s drop is not “in this data.” Sentiment is not all we follow here, but it says the selling may not yet be sufficient to reset the market to move higher again. But when things change, we change…
| Bulls | Neutrals | Bears |
| 31.98% | 31.17% | 36.86% |
| Thurs. 12 am CT close to poll | ||
2. U.S. Small Caps Market Timing – Russell 2000 U.S. Small Cap Index (click chart to enlarge; IWM, RUT)
You can see the 3rd wave forming here too and that my comments on social media about small caps leading the way down were predictive.

Small caps led the market down and continue to do so as usual.
3. Gold Market Timing (click chart to enlarge; GLD):
We bought on the last pullback, because of the longer term slowing in the economy that will eventually force the Fed to lower rates once again. That worked nicely…
The 1-27 high shown is the current “test” of further upside. These tests are not magical. As said, they are just spots to assess the market. The market looks good for gold for now as long as rates keep falling (see below) and the dollar weakens.

Gold up with stock markets down.
Check out the “Market Signal Summary” below – after you review the following chart…
4. Interest Rate Market Timing (10 Year Treasury Yield; click chart to enlarge; TNX, IEF, TLT): Chart shown below is for the close for the week.
Just when you thought it was safe to buy financials that depend on RISING rates, it isn’t any longer…
The Fed is now officially behind the curve. Literally! They are playing with short rates but the economy may “need” more long juice (lower rates and QE).
As is said “A broken clock is right twice a day.” “Perma Low Rate Lover” President Trump is going to be right about the Fed needing to lower rates again. Trump is ALWAYS pro-low rates because he says “I love debt.” Why? His family biz is real estate that lives or dies on rates.
Trump also seems to love “National Debt” too with soaring deficits following his tax-cut. File that under: “Tickle Down Economics ZERO of THREE attempts.”
Remember that once rates start rising again, it may (in the long term) be because the world no longer trusts us to pay our bills. When that happens, you’ll want to have a TON OF GOLD (double or triple the usual amount recommended).
Over the intermediate term: Gold loves low rates, so we’ll have to monitor the recovery of rates and take some profits at some point. The prior comments apply only to the longer term picture.
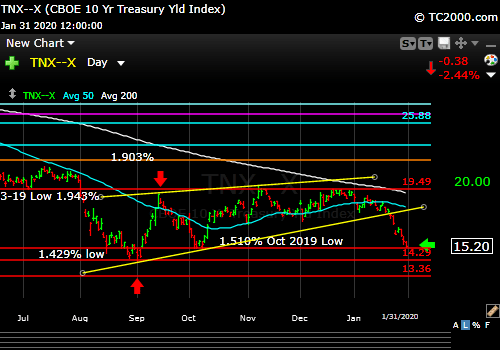
Yields falling, bonds rising!
Now let’s review three key market timing signals together….
Do not use these signals as a trading plan. They are rough guidelines. I currently share my actual BUYS and SELLS in as timely a way as possible on social media (links above).
MY MARKET SIGNAL AND TREND SUMMARY for a Further U.S. Stock Market Rally with Real GDP Growth (“Real” means above inflation):
Stock Signal RED for a further U.S. stock market rally with a short term BEARISH and longer term Bullish SP500 Index trend. The stock signal is based on small caps, as they often lead the market down. See above for more.
Gold Signal RED for a further U.S. stock market rally. The Gold Trend is short term Bullish and longer term Bullish. Add on pullbacks.
What gold does mostly as I’ve written HERE is follow real interest rates around the world (if you own “gold in dollar terms” you care about U.S. rates most of all). The rest of the world does matter however, including massive buying by central banks.
GUIDE: “Remember GLD is being used as an indicator for the ECONOMY here.” If gold continues to rise, it means the market believes real rates will fall, which in the current context means the global economy is slowing. That would ultimately hurt U.S. stocks.
Rate Signal RED for a further stock market rally with a longer term BEARISH and short term Bearish 10 Year Yield Trend. (Remember: higher rates mean lower bond and Treasury prices and vice versa).
Thank you for reading. Would you please leave your comments below where it says “Leave a Reply”… or ask a question if you like…
Pay it forward by sending the link to MarketTiming.Blog (that link will immediately connect them to this webpage) to a relative or friend. Thanks for doing that.
Be sure to visit the website for more general investing knowledge at:
Standard Disclaimer: It’s your money and your decision as to how to invest it.
I thank Worden Brothers for the charting system I use to post these charts. If you want to know more about the charting system I use every day, contact me. It makes it much easier to follow along with me if you can see the charts and manipulate them on your own computer. It’s a great investment to have an excellent charting system.
Note: I’ve updated my criteria for the equity signal for a further U.S. stock market rally to the following: GREEN = Bullish, YELLOW = Neutral, RED = Bearish. In other words, the colors tell you whether the signal supports the stock rally or not, while the Bullish, Neutral, and Bearish designations are about the trend.
A BEARISH trend signal does not mean we should not buy. A BULLISH trend signal does not mean you cannot sell some exposure. It depends on what is going on in the economy and how oversold/overbought the market is at a given point whether the Bearish signal is to be sold or bought, sold on the next bounce, etc. and whether a Bullish signal is to be bought or if profits should be taken. A NEUTRAL trend signal does not mean the end of the Bull or Bear. It means to wait and look for possible subsequent entry points within the existing trend, Bull or Bear, but preserve capital if the entry fails. Our strong intention is to buy low and sell high. By the way, I will keep showing the prior orange “Trigger lines” in the IWM and GLD charts for now as reference points only; they have historical value for us from the post-2016 election period.
Copyright © 2020 By Wall Street Sun and Storm Report, LLC All rights reserved.

Thank you! I can’t believe Wal-Street will allow the markets to correct much going into the election!
You mean Wal-Street like the formerly named Wal-mart I take it? I don’t think this correction is about the election (it’s about economic slowing and correction of a stretch in valuation as we saw in Jan. 2018), but then again, Sanders is now threatening to take the lead from Biden, and Bloomberg has a lot of ground to climb. If Sanders were to out-Trump Trump in appealing to a pocket of disaffected voters, who knows…maybe Americans will decide to throw capitalism to the dogs. I doubt the country is ready for change of that magnitude, although was the country ready for what Trump brought? Trump’s self-centered Nationalism was a reaction to Globalism. In the same way, if the Dems are not careful, they’ll elect another wave of change that will mangle our system of incentives, and put the U.S. to sleep alongside Europe. If so, the Chinese and Russians will be the big winners for decades to come.
Capitalism will do fine under a Biden or Bloomberg or Trump Term II, but it would gasp for air under a Sanders Presidency. And the markets would correct severely on the reversal of the corporate tax cuts alone, not to mention the demolition of the healthcare system and the biopharma industry. Changes are needed (balancing profits vs. fairness in pricing), don’t get me wrong, but demolition is not.