A Market Timing Report based on the December 13, 2019 Close, published Saturday, December 14th, 2019…
NOTE (12-20-19): Despite requesting feedback at the base of this report this week, there was little of it. Perhaps careful study of the markets has become irrelevant to many who see markets going up “no matter what happens in the real world.”
This has led me to re-evaluate the time spent, which is considerable each week, and for this reason, I will likely entirely suspend the newsletter’s publication going forward. (I have not entirely excluded doing a “once a month” version, but I’m leaning against it at the present time, as too much would occur between isssues.)
I will likely continue sharing Buy/Sell signals I see in the major markets on social media (links are below), when I take those actions myself, although I may/may not share further charts here with/without limited commentary. Again, I’m leaning against doing the latter and leaning towards continuing the former for now.
In the meantime, I’ll be doing the same work behind the scenes that supports my thinking. That will not stop. The time it takes to write it up and communicate it, I will be directing to other endeavors. I appreciate those of you who have followed me here for years (since 2010 in this last reincarnation) and wish you well. Stay in touch on social media…until my next writing incarnation! 😉
I deliver focused comments on market timing once a week. These are supplemented with daily “Tweets/StockTwits” (see links below) and comments in the “markettiming” room on StockTwits.
I provide quite a bit of intraweek commentary, and if you don’t see it, you will miss out on quite a bit of context, so please click on the StockTwits link below and have a read… Thank you as always for being loyal readers and interacting on social media with your questions and comments!
1. SP500 Index Market Timing (S&P 500 Index®; SPY, SPX):
This week: Trump impeachment nearly 100% certain. Trump conviction chances near zero. Fed stays pat. China deal soon. USMCA passed. Consumer weak in November. Job losses spike. Those last two are NEW RISKS to the market.
Let’s turn to the state of the market…
What would satisfy me that the Bulls are serious?
The Bull Market Health Score this week is Bulls 4.0/Bears 1.0 vs. Bulls 3.5/Bears 1.5 vs. last week. It’s a 5 point scoring system .
For each checklist item below, I give you the points scored as Bullish or Bearish.
1. New high? Bulls 1.0 Answer: Yes. Price continues to rise within the channel bounded by the red lines, although it represents a degree of stretch from the prior uptrend.
2. V*IX trend favorable? Bulls 1.0 Answer: Yes. The VIX Game Score is back to Bulls 7/Bears 0 at a VIX of 12.63 (Friday close) vs. 13.62 the prior week, which is below my “Bull Nirvana” number, the 7th VIX Game Score point. Now the Bulls need to retake 12.00 and hold it this time.
3. AD % Line in an Uptrend? (This is a proprietary stat; see base of report.): Bulls 1.0 point. Answer: Yes. The close was 16,958 vs. 16,937 last week, and was a close over the prior SPX top value of 16,954. Just over!
4. Higher volume on Up Moves? Lower volume on Down moves? Bulls 0.5 point. Answer: Neutral. Volume increased on both down then up moves.
5. Is the “U.S. Index Matrix Signal,” as I call it, positive? (To be positive, small and mid caps must be doing as well as large caps) Bulls 0.5 point. Answer: Mixed picture. The small caps had a new breakout this week, but the midcaps are back below their 11-27-19 high.
In the chart below, the Bull Market Health Score (BMHS) data are expressed as a multiple of 1000 (e.g., Score of 4 = 4000) per the scale shown on the y axis to the left, while the SPX values are adjusted in value to fit on the same linear plot. The scores are the blue line and SPX the orange line.

Bull Market Health Score Chart 12-13-2019
Prior data shows the Score tends to top out when the market itself is topping out, although you can see that recent pullbacks in the BMHS to 2.5 have not disrupted the uptrend much. So far the data says that score has to fall below 1 (1000 on the scale above) to disrupt the SP500 Index uptrend. On 7-19-19 there was a warning dip in the BMHS before a marginally higher high and then a meaningful pullback into the 8-23-19 low. The chart above is a weekly chart, because the score is determined from each end of market week close, so the ups and downs in August are smoothed out.
Another observation is that once the BMHS falls below 1 (1000 on chart), it may be already too late to sell, although I have not gone back to data from Big Bear Markets like that of 2008-2009 to see if there were clues from the score to “stay out” for a longer period of time. It’s possible that the BMHS could bob along between 0.5 and 0.0 for a while before ever coming up for air. We’ll see…
Notice also that the deeper SPX downtrends are accompanied by lower lows in the BMHS and the strong recent uptrend is accompanies by higher highs in the BMHS, which have been peaking out at 4.0 (4000 on the chart above). Any thoughts of your own? Please comment below.
Let’s check in on the context around the price action of the market by looking at the current Market Risks…
We have some new earnings data this week on Q4 2019…
Earnings Risk/Opportunity: What is shown are the projections in the FactSet 3-15-19 report followed by the reports from 4-12-19 through 8-09-19 with a skip of two weeks until the 8-30-19 data resumes the weekly data sequence followed by a skip for the week of 11-29-19 (details HERE)… The larger arrows “—>” indicate 3 weeks of of omitted data in order to compress the data.
For Q2 2019, analysts are projecting earnings growth of 0.1% —> -1.3% -> —> -2.1% —> -2.6% -> -2.6% -> -3.0% -> -1.9% -> -2.6%-> -1.0% -> -0.7% -> -0.4% DONE
and revenue growth of 4.6% —> 4.3% —> 4.1% —> 3.8% -> 3.8% -> 3.7% -> 3.8% ->4.0% ->4.1% -> 4.1% -> 4.0% DONE
For Q3 2019, analysts are projecting earnings growth of 1.8% —> 0.8% —> 0.3% —> -0.5% —> -1.9% —> -3.6% -> -3.7% -> -3.8% -> -3.7% -> -4.1% -> -4.6% -> -4.7% -> -3.7% -> -2.7% -> -2.4% -> -2.3% -> -2.2% DONE (FactSet did not say whether the numbers changed vs. their prior report on 11-22-19. Final number may not be accurate)
and revenue growth of 4.4% —> 4.4% —> 4.2% —> 3.8% —> 3.2% -> —> 2.9% -> 2.8% -> 2.8% -> 2.8% -> 2.8% -> 2.7% -> 2.6% -> 2.8% -> 3.1% -> 3.2% -> 3.1% -> 3.1% DONE (FactSet did not say whether the numbers changed vs. their prior report on 11-22-19. Final number may not be accurate)
For Q4 2019, analysts are projecting earnings growth of 8.1% —> 7.5% —> 7.2% —> 6.3% —> 4.9% —> 3.4% -> 3.2% -> 3.0% -> 2.9% ->2.6% -> 2.3% -> 1.5% -> 0.7% -> -0.4% -> -1.1% -> -1.4% -> -1.4% -> -1.5% -> -1.3%
and revenue growth of 4.8% —> 4.8% —> 4.6% —> 4.3% —> 4.0% —> 3.8% -> 3.7% -> 3.6% -> 3.6% -> 3.6% -> 3.5% -> 3.2% -> 3.0% -> 2.6% -> 2.6% -> 2.5% -> 2.5% -> 2.6% -> 2.5%
For CY 2019, analysts are projecting earnings growth of 3.4% —> 3.2% —> 2.7% —> 1.7% —> 1.4% -> 1.3% -> 1.3% -> 1.3% -> 1.2% -> 1.1% -> 0.7% -> 0.6% -> 0.3% -> 0.1% -> 0.0% -> 0.1% -> 0.2% -> 0.3%
and revenue growth of 4.7% —> 4.7% —> 4.5% —> 4.4% —> 4.3% -> 4.2% -> 4.1% -> 4.1% -> 4.1% -> 4.1% -> 4.0% > 4.0% -> 4.0% -> 4.0% -> 3.9% -> 3.8% -> 3.8% -> 3.8%
For Q1 2020, analysts are projecting earnings growth of 10.5% —> 9.8% —> 8.5% -> 8.2% -> 8.1% -> 7.9% -> 7.9% -> 7.8% -> 7.6% -> 7.3% -> 6.7% -> 6.0% -> 5.6% -> 5.3% -> 5.1% -> 5.3% -> 5.2% -> 5.4%
and revenue growth of 6.2% —>5.8% —> 5.6% -> 5.7% -> 5.5% -> 5.5% -> 5.4% -> 5.4% -> 5.5% -> 5.3% -> 4.8% -> 4.7% -> 4.5% -> 4.5% -> 4.5% -> 4.4% -> 4.4% -> 4.4%
For Q2 2020, analysts are projecting earnings growth of 13.3% —> 13.5% —> 9.9% —> 9.0% -> 9.0% -> 8.7% -> 8.6% -> 7.7% -> 7.3% -> 6.7% -> 6.6% -> 6.4% -> 6.7% -> 6.7% -> 6.9%
and revenue growth of 6.8% —> 6.6% —> 6.4% —> 6.3% -> 6.3% -> 6.3% -> 5.9% -> 5.2% -> 5.2% -> 4.9% -> 5.0% -> 4.9% -> 4.9% -> 4.9% -> 4.9%
For CY 2020, analysts are projecting earnings growth of 10.7% —> 10.5% -> 10.6% -> 10.4% -> 9.9% -> 9.8% -> 9.7% -> 9.7% -> 9.9% -> 9.8% -> 9.7% -> 9.7%
and revenue growth of 5.6% -> —> 5.7% -> 5.6% -> 5.3% -> 5.3% -> 5.3% -> 5.4% -> 5.5% -> 5.5% -> 5.5% -> 5.5% -> 5.5%
As noted last week, Q4 will be the 4th negative quarter of earnings growth in a row similar to what happened in 2015-2016, but without as much price action around that dip in earnings.
Here’s a Brief Review of the Other Market Risks at Hand:
China Deal Risk: Risk has fallen substantially. We are told in more definitive terms that the tariffs will be eased and lots and lots of soybeans will be sold to China. However, the tariffs are not going back to zero. What would really help is if China’s markets were opened up more to the U.S. to boost our GDP. Then the recovery would in fact be supported further.
Fed Rate Cut/Hike Risk: There has been a continued increase in perceived risk of another RATE CUT by September 2020. The odds are about 50:50 (just under) for the next Fed rate cut to occur in Sept. 2020.
The Fed has cut three times and said it was done unless things get worse for the economy. As I’ve said previously: “THREE cuts is a mid-cycle adjustment. Four cuts or more mean the Federal Reserve expects a recession.” A hike in rates in the near future would tank the U.S. stock market.
We look at the CME Group odds each week of rate cuts/hikes. The risk of a December hike was 0.7% last week and the Fed left rates unchanged.
What about January? The odds of cut #4 is 2.2% vs. 8.8% last week vs 67% 9 weeks ago! The odds of a HIKE in Jan. are 0.0% vs. 0.7% last week vs. 5.8% 3 weeks ago.
What about a March cut? The odds are 8.7% this week vs. 20.8% last week vs. 75.1% 9 weeks ago for 4 or more cuts in total. March hike? 0.0% vs. 5.0% 3 weeks ago.
April Cut? 18.5% vs. 34.8% 3 weeks ago vs. 52.6% 4 weeks ago vs. 79.7% 9 weeks ago expect there to be 4 or more cuts. April hike? 0.0% vs. 0.5% last week vs. 4.2% odds 3 weeks ago.
June cut? 33.6% vs. 40.0% last week vs. 56.7% 6 weeks ago expect four or more cuts by then. Probability of a hike is 0.0% vs. 0.4% last week vs. 10.2% 4 weeks ago.
July? 45.4% vs. 47.9% last week vs. 60.7% 5 weeks ago expect 4 cuts or more cuts by then. A hike? 0.0% vs. 0.4% last week vs. 9.2% 4 weeks ago.
What are the rest of the available “4 (or more) cut odds”? Sept. 2020? 49.8% vs. 56.2% last week vs. 65.2% 6 weeks ago. Sept. 2020 Hike? 0.0% vs. 0.0% last week vs. 8.1% 4 weeks ago. Nov. 2020 cut: 55.0% vs. 59.2% last week vs. 69.3% 6 weeks ago. Nov. hike? 0.0% vs. 0.0% last week vs. 7.2% 4 weeks ago. Dec. 2020 Cut: 60.6% vs. 64.7% last week vs. 73.8% 6 weeks ago. Dec. hike? 0.0% vs. 0.0% last week vs 6.3% 3 weeks ago.
At least among those in the interest rate futures markets, the perceived odds of a recession or at least Fed action by November continuing into December 2020 will be required to prevent a recession or make it more shallow is slightly LESS than it was last week. The first risk above 50% occurs in November 2020 now vs. September last week. Again, there is ZERO discounting of a recession in the stock market right now.
The Risk of a Neutral Fed: SAME. The Fed is stuck now unless the data becoming more than a little compelling. There is risk of inflation on the one hand and more slowing on the other. Prior: “Ultimately the change by the Federal Reserve in going to “Neutral” was NOT positive for the U.S. equity market, but it ignored it. It won’t ignore it if economic slowing does not reverse itself going into 2020.”
U.S. Iran War Risk: SAME. Interestingly quiet. No change for weeks. More stable after the leak of the “Iran Annihilation Plan HERE.
2020 Election Risk: See last week’s post. The entry of Bloomberg makes things more difficult for Joe Biden, but he’s still the favorite to win the Dem nomination. Losing in Iowa and New Hampshire won’t look good though, and it could bring him down in the polls.
As I shared on social media last week, the other major concern I have (concern for the market!) is the possibility that Sanders and Warren join forces, because together their numbers would lead the field (34% vs. Biden at 28.4%). That could happen at the convention. I predict they would lose to Trump with a recurrence of the Nixon/McGovern race, where Nixon won in a landslide DESPITE the Vietnam War.
Buttigieg was falling in the polls this week due to the attacks on his donor sources. He has now given back the money he got from lobbyists, but it does not look good to the Sanders/Warren purist liberals.
Not all billionaires are created equal! Steyer is still in the near death group at 1.6% (same Ref. as above), while Bloomberg has bought himself 5.2% in a hurry. He’s making the mistake of not taking individual donations, which could keep him out of upcoming debates. I have no clue why they are not accepting at least $1 donations to satisfy the debate requirements, but let me know if you’ve heard how he plans to get on the stage.
Trump Impeachment Risk: Impeachment Risk: 100% now that the articles have been passed by the House Judiciary Committee. Conviction Risk? Still near zero probably something like 0.00000000000001%. The Constitution STILL does not matter to the GOP. If it did, they would at least criticize his actions. At least GOP Rep. Will Hurd (he’s retiring) did just that while saying he would not support impeachment. He is ex-CIA and has been disturbed by the President’s obviously bad behavior. If you can at least recognize how Fox News would have FILLETED President Obama for doing any close to what Trump did, great. Removal is perhaps drastic and debatable. The wrong Trump did is NOT debatable. I wish Republicans would find a spine and say what he did was plain wrong.
Deficit/Debt Threat: No Change: Trump is now beating Obama at something! The size of his deficit! It’s bigly. Read THIS. The deficit is up 26% to $964 Billion for fiscal 2019, the HIGHEST IN 7 YEARS!
I’ll leave this here as a monument to our monumental debt, which could threaten interest rates in the future. When rates rise, there will be “heck to pay.” The U.S. dollar remains at risk and having at least 5% of your non-real estate net worth in gold exposure is a reasonable hedge in any portfolio. Some say higher, but owning stocks is also a hedge that over time would work out for solid companies, even in the face of very high inflation (after the market came back from a deep swan dive!).
Inflation Risk: The other risk is inflation ticking up. Employment is high and wages are increasing, which means costs are increasing, so if the economy slows WITH rising costs, people are fired, so companies can meet their earnings goals. Let’s see how this Christmas season turns out and in the meantime carefully watch employment, wage increases, and inflation. The market would not enjoy either seeing or anticipating a Fed rate hike anytime in 2020. No one expects it! If that comes back into the picture, Houston, we’ll have a problem. It will mean inflation has truly picked up, as hiking rates before the election in particular would be seen as endangering Trump’s re-election.
Employment Risk: There was a big spike in jobless claims this week (see my social media stream; link to chart).
Consumer Strength Risk: Retail sales were weak last month as reported this past week. The consumer has been the support under GDP this year, so if that trend continues and the job loss rate continues to spike as it did this week (see my social media feed), the stock market could start losing steam. Jobless people spend less!
Current Scenario… Unchanged this week!
Despite the extra push up above trend we are seeing (the higher channel in the chart below), the prior pattern we saw earlier in 2019 could repeat itself. A further melt-up and then a substantial correction, which could be months away and may be poll dependent. If Biden fails to gain traction for example, Trump might be considered a shoe in for a second term vs. anyone left on the Dem field.
A final high will be reached prior to the discounting of a recession, which brings on a ‘Big Bear Market.’ Whether the market moves up a bit more and drops, corrects immediately, OR rises now to a final (for the cycle) all time high, we are not yet at the all time high in my opinion. There is more upside to come, if not now, then later, before the final high.
This is also very similar to January 2018 on the chart that led to a sizable, quick dive in the market of 11.78%. We could see a similar correction between now and the end of the 1st quarter of 2020. We do not have the Fed in the way at this point. It’s just frozen in the corner as I’ve contended. China trade is going to be better not worse, at least at the margin, which could help U.S. GDP to grow faster.
Back to the charts….
Now take a look at the SP500 chart. The long upper yellow line is now at about 3065 at the Friday close. The two short upper red lines show a narrow range in a gentle up trend, rising ABOVE the prior upper yellow trend line of the longer term channel.
As I warned four weeks ago, if the market keeps pushing above that top long yellow line, there will be eventual payback.
SP500 Large Cap Index (click chart to enlarge; SPX, SPY):
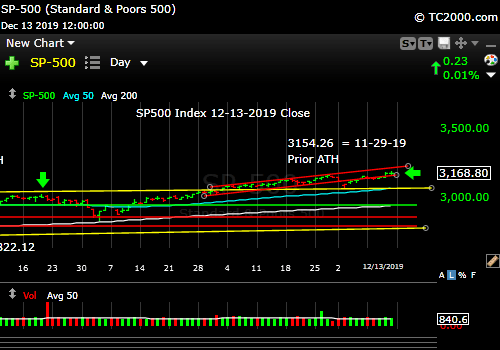
Stretched but rising.
Now let’s check in on two “Canary Signals” we’ve been following:
“Intel-igent Market Timing Signal” (Intel; I*NTC; * there to throw off the crawlers!): Neutral. SAME: “The stock is stuck below the April ATH. Why should it break out if the U.S. GDP is due to slide to below 1%? The June 4 high of 57.60 has been exceeded, and the April high of 59.59 is the next test to achieve a new all time high.”
The NY Fed says GDP for Q4 will be 0.69% and the Atlanta Fed using the exact same numbers says 2.0%. Take your pick! Following my canaries may be more productive than following GDP predictions as the latter are usually way off!
Bank of America (B*AC) Market Timing Signal: Bullish and is back above the 33.05 breakout for 8 days now. “It will only hold the breakout if, rates keep climbing. Sell a reversal at least on a close or sell on a close with a reversal on higher volume IMO.” A reversal lower with FALLING rates would be a negative prognostic sign for the economy.
Keep up-to-date during the week at Twitter and StockTwits (links below) where a combined 34,181 investors are following the markets with me…
Follow Me on Twitter® Follow Me on StockTwits®. (real time messages are on StockTwits as always and back on Twitter)
Join the Conversation in the StockTwits “MarketTiming” Room
Now let’s go on to review investor sentiment…
Survey Says!
Sentiment of individual investors (AAII.com) showed a Bull minus Bear percentage spread of +11.58 vs. +2.59% last week. Investors are becoming a bit more Bullish but it’s not an extreme spread, so more upside is possible. Investors routinely become uber-Bullish at real tops in markets, and this is not one of those. Bottom Line? Even if the market corrects, it will be a buying opportunity that will lead us to an even higher high.
This is just one signal we follow, as price ultimately beats every other signal. A future sentiment peak does not allow us to go to sleep in the Sun and Storm Investing™ World. 😉
| Bulls | Neutrals | Bears |
| 37.63% | 36.32% | 26.05% |
| Thurs. 12 am CT close to poll | ||
2. U.S. Small Caps Market Timing (IWM):
We now have a breakout, and it was sustained with a new high being reached this week. I am skeptical of this new high holding, because midcaps have NOT come along. At the same time, I cannot argue with a trade to the 173ish high. Rates must keep rising for the financial component of IWM to succeed. They’ve just turned back down in the recent range it seems.
Russell 2000 U.S. Small Cap Index (click chart to enlarge; IWM, RUT):

.Breakout maintained…so far.
3. Gold Market Timing (GLD):
No change. In fact this week, GLD is back above that upper red line in the chart below!
SAME MAJOR POINT: IF the Fed lags inflation, gold wins, but if it front runs inflation, gold loses on a relative basis. Follow the chart though, not the noise from talking heads. Higher inflation (absent continued slowing of GDP) is probable given the “Fed Stuck in Neutral” place we are in. Gold wins! If the next Fed move is a CUT, gold wins too.
SAME Technicals: If it breaks lower and GDX breaks, I’ll likely be lowering my exposure to gold. That means holding above that 2013 lower high on the chart.
The Gold ETF (click chart to enlarge; GLD): That top red line is 137.80. The market “has my number” as I say. When the market changes, we change.
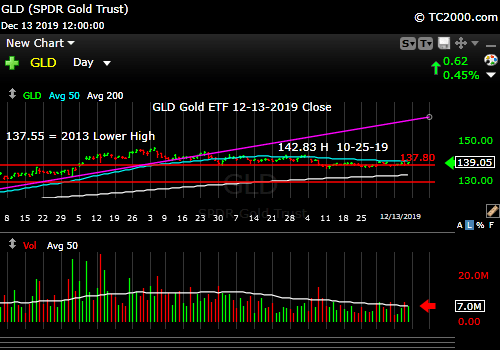
Gold will likely win with a neutral Fed.
4. Interest Rate Market Timing (10 Year Treasury Yield; TNX, IEF, TLT):
Still true despite the Friday drop: The drop in rates on Friday may create a lower high, but until proven otherwise with a breach of the November lows (which would be bad for banks!), rates are in an ascending triangle on an intermediate term basis. That is Bullish for rates. I added TIPs (first add and the yield is not great, so I’m buying with the expectation of a capital gain in a retirement account and that I’ll trade it, not buy and hold) on the Friday pop in rates after the Fed left rates unchanged and indicated it was taking 2020 off. 😉 The dollar is weakening, which makes imports more expensive and adds to inflation.
It could be that rates trade within a range, so if you don’t trade, you’ll just make the low coupon available, which will be less than the REAL inflation rate. You are paying to hold treasuries/bonds in that case!
Speaking of the REAL inflation rate, I had a little back and forth discussion with former Dallas Fed analyst/advisor Danielle DiMartino Booth on Twitter this past week noted HERE. She was a Fed advisor before she wrote her book “Fed Up: An Insider’s Take on Why the Federal Reserve is Bad for America.”
I recommend you do what I suggested to her could be a more useful calculation of inflation for an individual investor to use in financial planning, that is to calculate your personal rate of inflation (you’ll have to throw out exceptional items and consider the cost of money, if you have equity in your house, etc.), but it could give you a better idea than the CPI does or even the “UGI full measure” Danielle cited for how much of a return in percentage terms YOU will have to make to stay ahead of inflation before and in retirement. In retirement you’ll still need money, but after retirement you won’t have to worry about money. 😉 The goal is to have enough money in life, so the only thinking you do about money is for the fun of the game and/or about how you plan to spend and share your wealth with others.
BEFORE YOU GO… I am assessing the value of this work to my readers in a year end review. If you find it valuable, please communicate to me WHY it is valuable to you via email through my contact page HERE (or click the “Contact Me” tab at the top). Thank you.
Check out the “Market Signal Summary” below – after you review the following chart…
U.S. 10 Year Treasury Note Yield (click chart to enlarge; TNX, IEF, TYX, TLT, TBF):
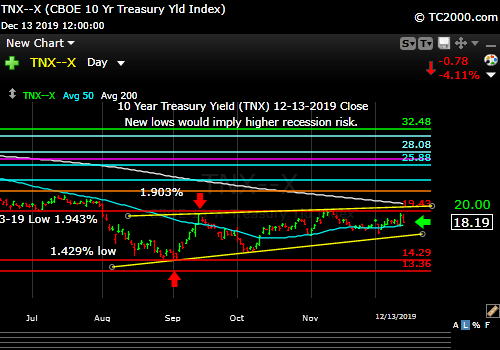
Rates moving lower again?
Now let’s review three key market timing signals together….
Do not use these signals as a trading plan. They are rough guidelines. I currently share my BUYS and SELLS in as timely a way as possible on social media (links above).
MY MARKET SIGNAL AND TREND SUMMARY for a Further U.S. Stock Market Rally with Real GDP Growth (“Real” means above inflation):
Stock Signal GREEN for a further U.S. stock market rally with a longer term Bullish and short term Bullish SP500 Index trend. The stock signal is based on small caps, as they often lead the market down. The small caps have broken out and that breakout MUST be preserved and further extended. This week was confirmation of that prior breakout, although I did not like seeing the midcaps lose ground.
Gold Signal YELLOW for a further U.S. stock market rally longer term Bullish Trend and a short term NEUTRAL Gold Trend. This still looks like a correction vs. a breakdown until it does not! The chart looks like a crouching tiger! 😉
What gold does mostly as I’ve written HERE is follow real interest rates around the world (if you own “gold in dollar terms” you care about U.S. rates most of all). The rest of the world does matter however, including massive buying by central banks.
Remember, gold may be down but not yet out, because if the Fed lags inflation, gold will win. Since I am predicting a “Federal Reserve Stuck In Neutral” into the 2020 Election, inflation will win, and gold and oil will win.
GUIDE: “Remember GLD is being used as an indicator for the ECONOMY here.” If gold continues to rise, it means the market believes real rates will fall, which in the current context means the global economy is slowing. That would ultimately hurt U.S. stocks.
Rate Signal GREEN for a further stock market rally with a longer term BEARISH and short term Bullish 10 Year Yield Trend. (Remember: higher rates mean lower bond and Treasury prices). Whether the short term trend should be called Neutral vs. Bullish is arguable at this time, but it’s not Bearish yet. There is actually an even longer term view that says rates have been in a neutral trading pattern since 2011, but the above two views are more practical on a trading/intermediate term investing basis.
I’ll leave this reminder from 9-20-2019’s issue: “Remember, FOUR Fed cuts will NOT be a “mid-cycle adjustment” and would be taken badly by the market ironically, considering the market’s addiction to lower rates. A fourth cut means the Federal Reserve is seeing recession risk as significantly high.”
Also for Reference: “Rates usually RISE slowly in a strong recovery and the stock market rally continues as they rise, as I’ve repeated multiple times on social media and here. Empirically though, rates that are “lower” (than 3.11%) and are NOT rising rapidly have allowed the market to rise.”
I said weeks ago, “Watch the oil price too. Higher oil tends to mean higher rates.” It closed at 60.07 vs. 59.20 last week. Still holds: If it rises above 58.82 (YES) and then 60.94 (NOT YET), oil and oil stocks will be off to the races. 63.38 would be the next target.
Just a reminder: If TNX bounces too quickly and too high, this will give rise to Rate Shock III… As said before: “Watch the rate at which TNX climbs if the current trend reverses. If it shoots up very fast, stocks will correct.” In the Sept. 28th issue: “A rapid push higher in rates would mean trouble for stocks, as occurred in early 2018. That’s what I called ‘Rate Shock.'” I called the period of rising rates in early October #RateShockII.
Another Reminder On Falling Rates: “The risk lately has been ‘Falling Rate Shocks.’ (I changed the term from “Negative Rate Shocks” because there are in fact negative rates in a lot of countries now. First we had ‘Falling Rate Shock I’ in December 2018 (because rates FELL while the Fed raised the Fed Funds rate 0.25% in mid-December, in what was perceived as a policy error by critics), ‘Falling Rate Shock II’ in May 2019, and ‘Falling Rate Shock III’ in August 2019. The Stock Market Bulls had better hope that they don’t get more rate cuts past October.
Thank you for reading. Would you please leave your comments below where it says “Leave a Reply”… or ask a question or report a typo…
Pay it forward by sending the link to MarketTiming.Blog (that link will immediately connect them to this webpage) to a relative or friend. Thanks for doing that.
Be sure to visit the website for more general investing knowledge at:
Standard Disclaimer: It’s your money and your decision as to how to invest it.
I thank Worden Brothers for the charting system I use to post these charts. If you want to know more about the charting system I use every day, contact me. It makes it much easier to follow along with me if you can see the charts and manipulate them on your own computer. It’s a great investment to have an excellent charting system.
Note: I’ve updated my criteria for the equity signal for a further U.S. stock market rally to the following: GREEN = Bullish, YELLOW = Neutral, RED = Bearish. In other words, the colors tell you whether the signal supports the stock rally or not, while the Bullish, Neutral, and Bearish designations are about the trend.
A BEARISH trend signal does not mean we should not buy. A BULLISH trend signal does not mean you cannot sell some exposure. It depends on what is going on in the economy and how oversold/overbought the market is at a given point whether the Bearish signal is to be sold or bought, sold on the next bounce, etc. and whether a Bullish signal is to be bought or if profits should be taken. A NEUTRAL trend signal does not mean the end of the Bull or Bear. It means to wait and look for possible subsequent entry points within the existing trend, Bull or Bear, but preserve capital if the entry fails. Our strong intention is to buy low and sell high. By the way, I will keep showing the prior orange “Trigger lines” in the IWM and GLD charts for now as reference points only; they have historical value for us from the post-2016 election period.
Copyright © 2019 By Wall Street Sun and Storm Report, LLC All rights reserved.

Thank you
You are welcome Charles!