A Market Timing Report based on the October 28, 2022 close…
First, how has my “Big Red Wave” level worked out? We came down to SP500 Index of 3491.68 on 10-13-2022 vs. my level of 3461.
That means we came to within 2.25% of the distance from the all time high of 4818.62 and my Big Red Wave Level of 3461. A miss of just 30.68 points out of 1357.62 from top to bottom. That’s even more accurate than it was in 2018 when my comments were featured on MarketWatch.com. This time, they did not pay attention. Their loss! 😉 To be fair, the exact numbers are not as important and predictive as the wave pattern.
The single mandate Fed will continue to hike this week on Nov. 2nd by 0.75% or 75 basis points. I predicted prior to Gov. Daley of the Fed of the San Francisco Fed saying it, that the Fed would have to indicate they might go a bit lighter on rate hikes as in 0.50% vs. 0.75% the previous times AND/OR scale back the rate of balance sheet runoff. The Fed balance sheet was massively increased in size to save the economy during the COVID-19 Pandemic. The chief blame for the current inflation is the Fed, not Biden or Trump, though BOTH contributed to it by issuing unneeded checks (some needed them; many did not), and through Trump’s misguided tax cuts for the very wealthy that are STILL adding to our federal deficit.
Biden is making the political error of not blaming the Fed when the Fed itself has said it’s to blame. As the economy is driving this election, which translated is NOT “Jobs,” but rather “Inflation,” the GOP stands to recapture the House of Representatives and possibly also the Senate, although the pollsters say it’s too close to call the Senate at 50:50. As I’ve explained, it’s because we are at a 40 year low in unemployment that we have this level of inflation.
This election will give us a Congress unable to pass much of anything except emergency funding for disasters (unless your name was DeSantis when Sandy hit the Northeast; he voted against hurricane relief funds and now is begging for them for my state of Florida! And he’s getting the money of course.). The markets like gridlock, since tax policy won’t change further. Corporations were only hit with a 1% tax on buybacks, which is entirely fair as the buyback trick was invented to duck regular capital gains rates on dividend payments by companies, as well as a 15% minimum tax on the profits of large companies.
Normally the pattern prior to an election is that it falls into it and then rises just before and after it occurs. This time, the market knows the outcome for the House, so it is frontrunning the election outcome in my view. It won’t matter, except for judicial appointment confirmations in the Senate.
The markets are bouncing, and on Oct. 21st I messaged on social media HERE and HERE that the equity market and even the bond market could enter a sustainable bounce given the horrific investor sentiment in part.
What’s are the “catches”? The economic slowing and earnings recession the Federal Reserve is creating through their interest rate hikes along with the elevation of the US dollar that is further aggravating global growth and shrinking the earnings in dollar terms of our multinational companies. Apple was saved by its strong orders for iPhone 14, but the CFO pointed out a 10% dollar headwind, which could get even worse if the Fed keeps raising rates.
The market assumes Fed hikes will stop at a top (terminal) Fed Funds rate of 4.75%, but who is to say that will be enough? I believe they’ll have to slow down a bit due to liquidity issues they are going to be generating for municipalities among others. But will they stop? No one can tell you. No one. So please be aware that the pressure on tech COULD pick up again if inflation does not descend as fast as the Fed wants. Even if they drop the hike sizes, they may do 0.50% hikes for multiple meetings, not just enough hikes to get them to 4.75%.
There is precedent for that warning, because if you look at a chart of Fed funds rates vs. CPI inflation, in several bouts of inflation, when the Fed Funds Rate was raised to contain inflation, rates had to rise ABOVE the CPI inflation rate to bring inflation down as the chart shows HERE.
Now look at where CPI was on the last reading by the BLS. The headline CPI was 8.2% Year/Year (red bar on left).

Year Over Year Change in U.S. Inflation
Now the Fed may not have to go all the way to above 8.2% to lower inflation, because it is also running off its balance sheet, which will also act to bring down inflation, but it may have to go higher than the market currently thinks. In addition, it’s going to be hard to add another 8% to the 8% inflation of this year. Inflation goes to zero when prices remain high, as long as prices stop going up. Actual deflation, vs. a falling rate of inflation or disinflation, would lower prices if the Fed overdoes the rate hikes.
If the Fed has to hike above 4.75%, those even higher rates will further pressure economic growth, earnings and stock prices during a period in which the CEO of Intel, Pat Gelsinger, says the chip industry (chips run virtually everything) faces a year of slower growth.
Slower growth means lower stock prices. As growth then picks up again, stock prices will rise, and they will likely rise in anticipation of that by 3-6 months, but if it’s a year off, we can likely assume the current gains being achieved in the market will slip away once again. It’s a tradable bounce, not very likely a sustainable bounce, despite the fact that a growth oriented newsletter writer I know declared the Bear market over on Friday. He may not be right in terms of “back to usual” but… there is a “However”!
However… I have to say that in terms of the overall wave pattern, we may have made the final low of this Bear Market. The final fifth wave may exceed the length of the fourth wave as it has, so that’s OK, but it does allow for yet another lower low in the SP500 Index. But what if the wave pattern IS actually complete? The market could just bounce up and down from the June low to the August high until 2023 becomes clearer and perhaps improves in terms of expectations.
My point? I would not listen to anyone who says the market MUST make a new low. It doesn’t IMO…
IF the market does break the June low again, the risk of a breach of the Oct. low clearly becomes real. And by that, I mean a BIG breach! If the October low is breached, we will be entering another major leg down into a Big Bear market as I’ve defined it with my “New Rules” (link above).
Why cover both possibilities? Because I will significantly lower my stock exposure further than I have should those breaches occur.
Now we’ll look at the current charts…
Be sure to…
Follow Me on Twitter® Follow Me on StockTwits®. (real time messages are on StockTwits as always and back on Twitter)
Keep up-to-date and read my comments on the current setup during the week at Twitter and StockTwits at the above links) where a combined 35,452 investors are following the markets with me…
1. SP500 Index Market Timing (S&P 500 Index®; SPY, SPX):
Even though we are in a sustainable bounce as said above, it’s just a bounce for now. Earnings will be weak for Q4 2022 into the 3rd Q of 2023.
And if this becomes a big recession as opposed to a shallow one, the market will sell off significantly more than the 25% or so it reached in the October skid to a new low (SP500 Index).
I explain this along with my rules for naming small to huge pullbacks in the market, known as my “New Rules,” they are HERE (scroll to “New Rules” in blue type).
Click the chart to see the details… (the RED arrow marks the May low)

Bounce under way.
The SP500 Index’s next stop? It has to rise above that late June high and extend the bounce to the 200 day moving average (the downward curving white line). It has already risen above the 50 day moving average (mav), but one day above is not a confirmation of strength. That won’t happen IMO if rates climb further after the Fed meets this week.
I think it’s likely this bounce goes to the early June high, which will be above the 200 day mav, which contained the August bounce as you see above. That will suck in the last of the buyers.
The market stopped right at that white line (200 day mav) in August. That would be the lowest extent of this bounce most likely.
Could it make it all the way to the August high? Of course, although the fact that the last bounce to that high failed completely with a total give back of all the gains indicates to me that it won’t get that high unless the Fed changes it’s stance dramatically, which should not be in the immediate cards. Bear market bounces routinely challenge the Bears, many of whom have never learned to trade these bounces. Buy and hold does not work for Bulls or Bears, at least those who want to beat the market.
I’ll be reporting on my indicators on social media (links above) during this bounce and let you know what I see at each of these levels. The given level itself is not predictive, but where the indicators end up once we arrive at a given level is in my experience.
Now let’s review investor sentiment…
Survey Says!
I covered recent Bearish sentiment in the posts with links above (if you did not click them, you’ve missed a lot!), and my comment on this week’s follow through on the prior extreme Bearishness is HERE. The negative spread was less this week, but has plenty of room to fall toward zero from here, which is Bullish by itself. The spread is -19.1 (Bulls – Bears).
| Bulls | Neutrals | Bears |
| 26.6% | 27.7% | 45.7% |
| Thurs. 12 am CT close to poll | ||
Now let’s look at the small caps, gold, and interest rates…
2. U.S. Small Caps Market Timing – Russell 2000 U.S. Small Cap Index (click chart to enlarge; IWM, RUT)
I said last time, “the trend does not change until the June high (June 7th in this case) is exceeded.” That’s still the case. The 200 day mav is the first hurdle followed by the Sept. and June highs. Then the August high comes into play, which seems a stretch, but this is a crazy market that generated a huge return off the June low only to give it all back. The pattern of rising to falling moving averages is typical of Bear markets across the world…

Bounce across all caps!
Gold is next…
3. Gold Market Timing (click chart to enlarge; GLD):
Gold has long been broken and is only an “insurance play” on the dollar resuming its long term decline. The strongest variable is real interest rates (Google “When Does Gold Shine and When Does it Decline” if you want to read them all). When they are rising or very high, gold is unattractive as an investment. Rising rates also cause the dollar to strengthen as foreign money chases after the USD. That hurts gold prices in dollars too.
The trend is down until interest rates reverse their steep climb.

In a downtrend.
Check out the “Market Signal Summary” below – after you review the following chart…
4. Interest Rate Market Timing (10 Year Treasury Yield; click chart to enlarge; TNX, IEF, TLT):
The trend is still up in rates. Recently the 10 Year Treasury Yield broke above the Sept. high of 3.992%. This past week it fell to retest it, but closed above it. That’s the most important marker now as we head into a Fed meeting. If you see TNX rise further after the Fed meeting, stocks will likely take a hit and could resume their downtrend.
Federal Reserve Chair Powell has a tough job in the next few months. If he indicates they are stuck on a 75 basis point hike indefinitely, the stock market could certainly give back its recent gains. If they moderate their talk a bit at the Fed, specifically if Power does, you’ll see stocks rise further. I spelled out what could do that in the introduction at the top…
There is a Bullish tilt to the current rise in TNX as charted below. You can see there is an upward wedge, which is Bearish for rates, Bullish for Treasuries, as such wedges tend to break to the downside. You now know what to look for this week…
Here’s the current chart…
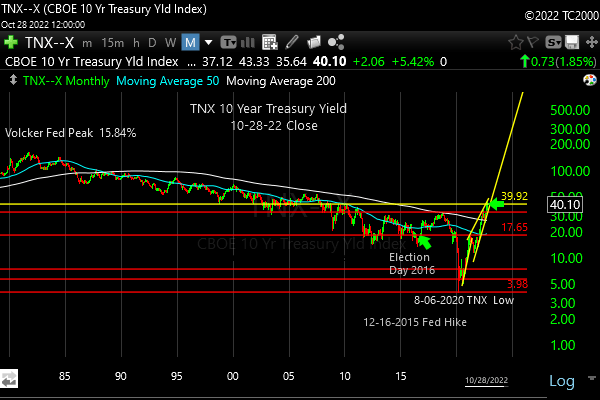
10 Year Yield is still in an uptrend.
Now let’s review three key market timing signals together….
Do not use these signals as a trading plan. They are rough guidelines. I currently share my actual BUYS and SELLS in as timely a way as possible on social media (links above).
MY MARKET SIGNAL AND TREND SUMMARY for a Further U.S. Stock Market Rally with Real GDP Growth (“Real” means above inflation):
Stock Signal Bullish for a further U.S. stock market rally with a short term Bullish and longer term Bearish SP500 Index trend. The small caps determine the stock signal in this section of the report. Small caps are bouncing, which is why the signal is Bullish short term.
Gold Signal Bearish for a further U.S. stock market rally. It indicates real rates are still rising. I’m labeling the Gold Signal as “Bearish” due to the current context. The Gold Trend is short term Bearish and longer term Bearish. The Fed raising rates is a problem for gold until the economy starts slowing or until the market starts anticipating that happening.
Gold will take off again to the upside IF/WHEN 1. Rates start falling at the long end. 2. The economy slows 3. Earnings fall for stocks, which reduces the overall yield on stocks. Gold likes weak competition!
As said before, “If real rates rise as the Fed acts, gold will be hurt, but in the short term, the Fed is hiking into economic slowing Y/Y, so that means rising short rates can LOWER long rates, which could help gold by depressing long term real rates.”
Kept for Reference: “Gold can RISE with stocks when real rates are FALLING, and the dollar is falling. The dollar has been stronger of late, due to the Fed’s planned pivot. Gold could rise WITH the dollar if the economy slows and real long rates fall.
These are thing gold doesn’t like: 1. Rising real rates (bonds/Treasuries become a threat to gold which pays nothing; banks and other companies make more money with rising rates) and 2. Economic recovery with higher corporate earnings. Earnings drive stock prices higher. Stocks pay dividends that compete with bonds, and companies use cash to buy back stock, which drives up stock prices, while gold pays nothing.
In liquidity crunches (which the Fed is supposed to prevent) gold can drop with everything else but the US dollar.”
What gold does mostly as I’ve written HERE is follow real interest rates around the world (if you own “gold in dollar terms” you care about U.S. rates most of all). The rest of the world does matter however, including massive buying by central banks. Real interest rates have been rising around the globe. Bad for gold.
GUIDE: “Remember GLD is being used as an indicator for the ECONOMY here.” If gold continues to rise again, it means the market believes real rates are going to fall or stay negative for a period of time.
Rate Signal: At this point Bearish for a further U.S. stock market rally, as rates have risen too quickly. The 10 Year Yield trend is short term Bullish, and intermediate term Bullish.
(Remember: higher rates mean lower bond and Treasury prices and vice versa). We want slowly rising rates in a recovering economy. That’s what happens normally. The Fed raises rates slowly as the economy continues to grow until it doesn’t. What we don’t want is rapidly rising OR rapidly falling rates, both of which I call “Rate Shocks.” We are currently experiencing a “Rate Shock” due to the Fed 1. Hiking Fed Funds rates and 2. Reducing the Balance Sheet.
Thank you for reading. Would you please leave your comments below where it says “Leave a reply”… or ask a question if you like…
Pay it forward by sending the link to MarketTiming.Blog (that link will immediately connect them to this webpage) to a relative or friend. Thanks for doing that.
Be sure to visit the website for more general investing knowledge at:
Standard Disclaimer: It’s your money and your decision as to how to invest it.
I thank Worden Brothers for the charting system I use to post these charts. If you want to know more about the charting system I use every day, contact me for any questions, or click HERE. Please use that link when you sign up as I am an affiliate (I don’t make much, but it may help to pay for some of my website expenses). It makes it much easier to follow along with me if you can see the charts and manipulate them on your own computer. It’s a great investment to have an excellent charting system.
Note: I’ve updated my criteria for the equity signal for a further U.S. stock market rally to the following: GREEN = Bullish, YELLOW = Neutral, RED = Bearish. In other words, the colors tell you whether the signal supports the stock rally or not, while the Bullish, Neutral, and Bearish designations are about the trend.
A BEARISH trend signal does not mean we should not buy. A BULLISH trend signal does not mean you cannot sell some exposure. It depends on what is going on in the economy and how oversold/overbought the market is at a given point whether the Bearish signal is to be sold or bought, sold on the next bounce, etc. and whether a Bullish signal is to be bought or if profits should be taken. A NEUTRAL trend signal does not mean the end of the Bull or Bear. It means to wait and look for possible subsequent entry points within the existing trend, Bull or Bear, but preserve capital if the entry fails. Our strong intention is to buy low and sell high. By the way, I will keep showing the prior orange “Trigger lines” in the IWM and GLD charts for now as reference points only; they have historical value for us from the post-2016 election period.
Copyright © 2022 By Wall Street Sun and Storm Report, LLC All rights reserved.

Thank you David
The DOW has broken above the 200 DMA. SPY and SPX are lagging. If the DOW remains above the 200 DMA and continues higher after the Fed on Wednesday, this bear market bounce is a 20% or higher move up from the recent low!