A Market Timing Report based on the July 08, 2022 close…
The Fed has just ONE mandate now: Get Inflation Lower, as I said in my last issue. The Fed has egg on its face for letting inflation run to 40 year highs. They are fortunate that the blame is being placed on the Biden Administration (both the GOP/Trump and Dems/Biden have made contributions to current inflation as covered in my prior post as well; click the second link down to the upper right).
There is nothing in the Fed’s mandate that says they are supposed to keep rates low for too long if the administration is engaging in fiscal spending. They are supposed to be an independent body. What the Fed has FINALLY done is prioritize inflation over employment, the former of which in the end hurts more poor people than it helps, while getting the rest of the electorate upset while pumping their gas.
What is happening in response the the Fed’s last 75 basis point hike (0.75%)? Initially, the U.S. stock market fell and then recovered most recently above the May low, which is the first step in reversing the downtrend. At this point, among SPX SPY (Large caps), QQQ (Large Caps heavy in Tech), IJH (Midcaps), and IWM (small caps), only IJH closed on Friday below its May low. It is the least manipulated index as traders tend to gravitate toward the two ends of the spectrum, large and small caps. For that reason, it is a “tell” in my book and speaks some caution as long as it doesn’t recover with the rest.
What may be holding U.S. stocks back? Earnings and recession risk. The year over year (Y/Y) earnings slowdown for Q2 about to be reported this week in earnest is the most dramatic in a long time, because we are comparing the 2nd quarter of this year to that of last year, when the increase over the pandemic shutdown was being measured. The “growth” vs shutdown was huge, so companies cannot possibly match that relative performance.
You may be thinking, “Hasn’t the market taken that into account already?” Probably not. Bob Pisani @CNBC recently reported on July 1st that earnings estimates for both Q3 and Q4 of this year had GONE UP from 10.6% to 11.1% and from 104% to 10.6% vs. April 1st. One would think those estimates would have fallen.
The Fed can only slow inflation by slowing the economy, so the risk of at least a shallow recession is high according to many market observers including me.
And now you may be thinking, “We had a shallow recession in 1990 (GDP decline of 1.5%), and the SP500 Index was down 20%, and since we’ve already been at -20% and a bit already, couldn’t the downside be done?” Doubtful. The Fed has just begun to raise rates and has to get to at least a Fed Funds rate of 3.0% to 3.4%, which may be inadequate, although they won’t say that part out loud.
In 1990, the market was not as stretched as this one had gotten at its peak. This market became more overvalued than even the 2000 market by some measures, and the recession after the 2000 pullback started was how deep exactly? There was just a 0.3% GDP drop in the March 2001 to November 2001 Recession per Investopedia.
The depth of recession is not well correlated with the depth of a market drawdown. Recessions ARE associated with the largest drawdowns, but the depth is not as important as the slowing itself.
Another important fact (covered at the above link) is that the current inflation rate of a CPI of 8.6% Y/Y was higher than the inflation rate Fed Chair Volcker had when he started in Aug. 1979. It was “only” 7% in January 1979, and it rose to 11.1% by the 4th Quarter of 1980 despite a Fed Funds rate of a whopping 10.5% when he was appointed, which was raised to 17.5% by April 1980.
That led to a recession at which point Volcker relented, dropping the rate to 9.5%, at which point inflation rose again to 11.1% in Q4 1980, pushing Volcker to hike rates to 19% by July 1981. By Q4 1982 inflation had been beaten back to 5%, while unemployment remained above 10% until mid-1983. The double dip recession part 2 ended in Nov. 1982 despite the high unemployment rate.
What’s the lesson? Despite sky high Fed Funds rates, inflation kept rising until Fed Funds were raised to what now seem ridiculous levels. The retrospectoscope often says Volcker did the right thing. But history (and the media) often fails to mention that Volcker FAILED on his first try to tame inflation despite a very high Fed Funds rate at the time.
TIME at those high rates was needed to cure the economy of its excesses, and the current Fed and investors may have next to no clue as to the job that lies ahead of the Fed in controlling inflation. I am not saying all the numbers will end up matching the inflation of the late 1970s, but the Fed may have to be much more aggressive than is currently thought. They think they’ll push Fed Funds to 3.0-3.4% and stop. Maybe that won’t be enough…
In the late ’70s investors were losing money in the stock market, WHILE STOCKS WERE RISING, due to the impact of that high inflation. Investors only started making a REAL return above inflation starting in Q4 1982.
Now we’ll look at the current charts…
Follow Me on Twitter® Follow Me on StockTwits®. (real time messages are on StockTwits as always and back on Twitter)
Keep up-to-date and read my comments on the current setup during the week at Twitter and StockTwits at the above links) where a combined 35,452 investors are following the markets with me…
1. SP500 Index Market Timing (S&P 500 Index®; SPY, SPX):
The SP500 Index has finally risen above the May low (again!). That is the first step in the recovery process, but just as with alcoholism recovery, there are further steps required for a full recovery to a Bull market trend. Technically, the first point one could say the trend had changed to Bullish would be a rise above the June high. Even if it gets there, it could just roll over at the 200 day moving average of course.
But first things first. After the reversal we’ve seen, the level of which was retested by a drop below by the way, a rise above the 50 day moving average (mav) is now required, a move that failed in early June. Success in the near future above the 50 day mav would be a positive sign.
The prior rally into the end of March matched the February high. That sent us into the third wave down as I predicted, and that wave may not be over yet. Why? Because we just made a new lower low. That means the downtrend is still intact until, as said above, we see a higher high of significance (meaning above the early June high, and not just above the little blip up in later June).
If you don’t know my market naming “Rules,” they are HERE (scroll to “New Rules” in blue type).
Click the chart to see the details… (the RED arrow marks the May low)
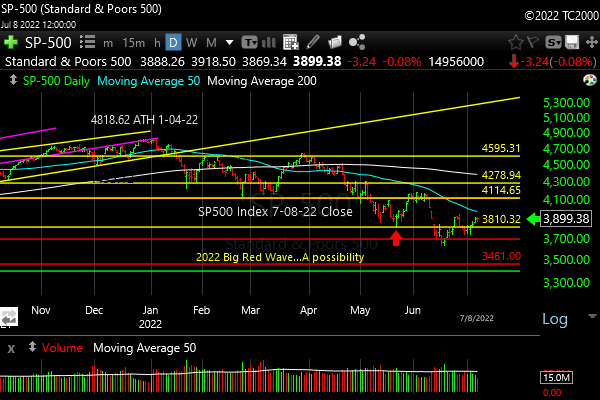
First step in recovery. More progress needed!
Now let’s review investor sentiment…
Survey Says!
Sentiment of individual investors (AAII.com) showed a Bull minus Bear percentage spread of -33.4%. That is a Bearish spread, but not maximally so as it reached -41.1% on 6-22-22 and -42.9% on 4-27-22. The SP500 Index rose after the June sentiment low and sold off after the April low. Chronically Bearish readings, which is a period we’re in now, can be misleading. Investors can be turned off to investing enough that they virtually fall asleep on the markets. That happened as recently as the COVID Crash. AAII investors stayed Bearish even as markets started recovering and continued to be Bearish for many weeks…
I would be more impressed to see investors become overly Bullish at this point. That could indicate a good place to “sell more.”
If you look at the last issue, I said I expected the SP500 Index to reach the “magical” (it’s not) -20% level. And we did…
Whether we get a bounce here or not, there is likely more downside to go, given the above discussion about inflation and the Fed and the earnings slowdown. The “Big Red Wave” (see prior issue and the lowest red line on the SP500 Index chart) continues…
| Bulls | Neutrals | Bears |
| 19.4% | 27.8% | 52.8% |
| Thurs. 12 am CT close to poll | ||
Now let’s look at the small caps, gold, and interest rates…
2. U.S. Small Caps Market Timing – Russell 2000 U.S. Small Cap Index (click chart to enlarge; IWM, RUT)
Small caps have managed to pull off “Step 1 of Recovery” (moved above the May low). The above discussion about the SP500 Index applies here as well. The trend does not change until the June high (June 7th in this case) is exceeded.
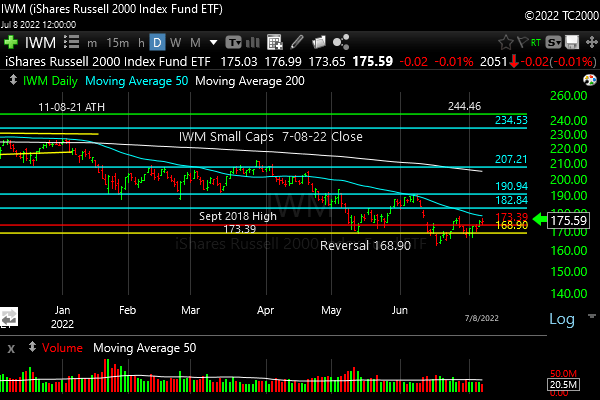
Small caps are above the May low. More buyers are needed!
Gold is next…
3. Gold Market Timing (click chart to enlarge; GLD):
Back at the end of April I wrote: “The March lows COULD yet save GLD from that sort of fall, but I believe it will sell off with everything else if the stock indexes break down further…” They did, and it did. Gold having broken that triangle you see (yellow lines) continued down and has been sucked into the generalized commodity selling.
The rebound in May never made it back to the March lows. Gold could recover with lower rates (TNX, covered below, is close to re-topping) even if inflation falls. Falling real yields is the top ranked factor in gold pricing. Economic slowing tends to favor gold for that reason.
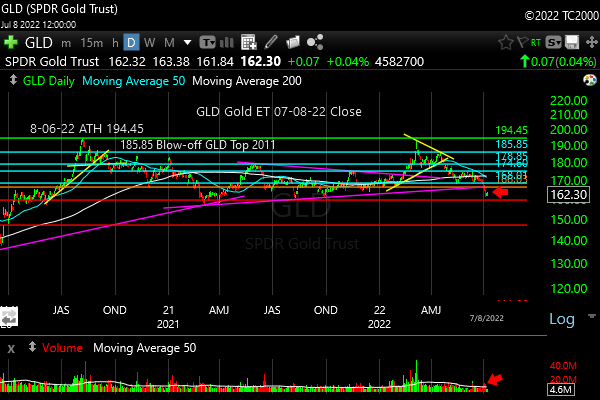
Gold broke the triangle and gave up all gains going back to Oct. 2021.
Check out the “Market Signal Summary” below – after you review the following chart…
4. Interest Rate Market Timing (10 Year Treasury Yield; click chart to enlarge; TNX, IEF, TLT):
We had the first step in a reversal for TLT (above 112.62, the May low) the other day, and yet as of Friday’s close, we are back below it for Day 1 at least.
As before, the key is to wait for the trend to change. We need a closing high with follow through for a couple of days above the May high in TLT to add to the position (preferably on a pullback after the breakout).
In the last issue I said, “Note that on high magnification you would see the current 10 Year Yield is ABOVE the top yellow line, which means it’s back to being STRETCHED to the upside and vulnerable to correction. The trend is still UP for now however….”
Here’s the current chart…
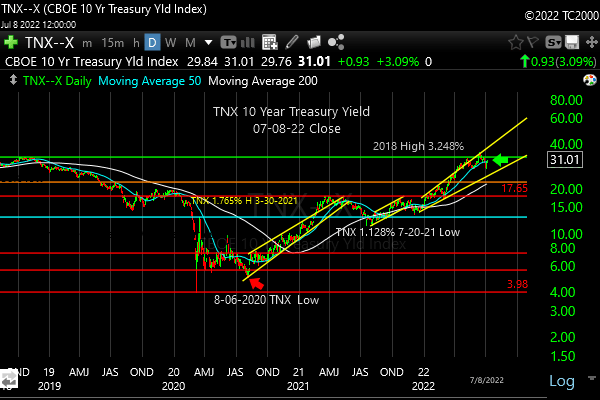
Consolidating since early May despite a slight correction.
Up TNX means down TLT, as many of you know.
The trend has been corrected a bit, but over the past 3 days, TNX has bounced back somewhat. The May and June highs are goals for the Rate Bulls.
With the Fed hiking at the short end, barring any chickening out as even Fed Chair Volcker did in the early 1980s, I expect rates to moderate at the long end to the benefit of the TLT trade. We have to have proof in price terms though! The 10 Year Yield (TNX) trend over the past two months is sideways.
Now let’s review three key market timing signals together….
Do not use these signals as a trading plan. They are rough guidelines. I currently share my actual BUYS and SELLS in as timely a way as possible on social media (links above).
MY MARKET SIGNAL AND TREND SUMMARY for a Further U.S. Stock Market Rally with Real GDP Growth (“Real” means above inflation):
Stock Signal Bearish for a further U.S. stock market rally with a short term NEUTRAL and longer term Bearish SP500 Index trend. The small caps determine the stock signal in this section of the report.
Gold Signal Bearish for a further U.S. stock market rally. I’m labeling the Gold Signal as “Bearish” due to the current context. The Gold Trend is short term Bearish and longer term Bearish. The Fed raising rates is a problem for gold until the economy starts slowing or until the market starts anticipating that happening.
As said before, “If real rates rise as the Fed acts, gold will be hurt, but in the short term, the Fed is hiking into economic slowing Y/Y, so that means rising short rates can LOWER long rates, which could help gold by depressing long term real rates.”
Kept for Reference: “Gold can RISE with stocks when real rates are FALLING, and the dollar is falling. The dollar has been stronger of late, due to the Fed’s planned pivot. Gold could rise WITH the dollar if the economy slows and real long rates fall.
These are thing gold doesn’t like: 1. Rising real rates (bonds/Treasuries become a threat to gold which pays nothing; banks and other companies make more money with rising rates) and 2. Economic recovery with higher corporate earnings. Earnings drive stock prices higher. Stocks pay dividends that compete with bonds, and companies use cash to buy back stock, which drives up stock prices, while gold pays nothing.
In liquidity crunches (which the Fed is supposed to prevent) gold can drop with everything else but the US dollar.”
What gold does mostly as I’ve written HERE is follow real interest rates around the world (if you own “gold in dollar terms” you care about U.S. rates most of all). The rest of the world does matter however, including massive buying by central banks. Real interest rates have been rising around the globe. Bad for gold.
GUIDE: “Remember GLD is being used as an indicator for the ECONOMY here.” If gold continues to rise again, it means the market believes real rates are going to fall or stay negative for a period of time.
Rate Signal: At this point Bearish for a further U.S. stock market rally, as rates have risen too quickly. The 10 Year Yield trend is short term NEUTRAL, and intermediate term Bullish.
(Remember: higher rates mean lower bond and Treasury prices and vice versa). We want slowly rising rates in a recovering economy. That’s what happens normally. The Fed raises rates slowly as the economy continues to grow until it doesn’t. What we don’t want is rapidly rising OR rapidly falling rates, both of which I call “Rate Shocks.” We are currently experiencing a “Rate Shock” due to the Fed 1. Hiking Fed Funds rates and 2. Reducing the Balance Sheet.
Thank you for reading. Would you please leave your comments below where it says “Leave a reply”… or ask a question if you like…
Pay it forward by sending the link to MarketTiming.Blog (that link will immediately connect them to this webpage) to a relative or friend. Thanks for doing that.
Be sure to visit the website for more general investing knowledge at:
Standard Disclaimer: It’s your money and your decision as to how to invest it.
I thank Worden Brothers for the charting system I use to post these charts. If you want to know more about the charting system I use every day, contact me for any questions, or click HERE. Please use that link when you sign up as I am an affiliate (I don’t make much, but it may help to pay for some of my website expenses). It makes it much easier to follow along with me if you can see the charts and manipulate them on your own computer. It’s a great investment to have an excellent charting system.
Note: I’ve updated my criteria for the equity signal for a further U.S. stock market rally to the following: GREEN = Bullish, YELLOW = Neutral, RED = Bearish. In other words, the colors tell you whether the signal supports the stock rally or not, while the Bullish, Neutral, and Bearish designations are about the trend.
A BEARISH trend signal does not mean we should not buy. A BULLISH trend signal does not mean you cannot sell some exposure. It depends on what is going on in the economy and how oversold/overbought the market is at a given point whether the Bearish signal is to be sold or bought, sold on the next bounce, etc. and whether a Bullish signal is to be bought or if profits should be taken. A NEUTRAL trend signal does not mean the end of the Bull or Bear. It means to wait and look for possible subsequent entry points within the existing trend, Bull or Bear, but preserve capital if the entry fails. Our strong intention is to buy low and sell high. By the way, I will keep showing the prior orange “Trigger lines” in the IWM and GLD charts for now as reference points only; they have historical value for us from the post-2016 election period.
Copyright © 2022 By Wall Street Sun and Storm Report, LLC All rights reserved.

Thank you David