Market Timing Brief for the SP500 Index Close on 1-24-2014: First Sell Signal

A Market Timing Report based on the 1-24-2014 Close published Sunday January 26th, 2014

The SP500 Index (SPX, SPY) has broken 1st support, and for aggressive traders, it’s a sell signal.  The chart below shows you where next support is.  On the access page notes tonight, I’ll spell out my personal spot to sell the SP500 Index.

SP500 Index Chart:

sp500-index-market-timing-chart-2014-01-24-closeAs mentioned over the past few weeks, investor sentiment is starting to flash caution signs.  I covered my thoughts on investor sentiment for free subscribers by posting it last Thursday.  Be sure to read it.  You can access my thoughts after getting the password here: Free Subscription to My Newsletter and access to my latest comments  I’ll send you back the password to the access page and the monthly newsletter in the same email.

Standard Disclaimer: It’s your money and your decision as to how to invest it.

I also comment regularly on Twitter: Follow Me on Twitter

I thank Worden Brothers for the chart system I use to post these charts.  If you want to know more about the charting system I use every day, go to my “Other Resources” page here:  Other Resources   It makes it much easier to follow along with me if you can see the charts and manipulate them on your own computer, so it’s a great investment to have an excellent charting system.

Look for updates on the main chart tracking pages this week as I feel they are needed and comments via Twitter.

Copyright © 2014 By Wall Street Sun and Storm Report, LLC All rights reserved.

Posted in investment, large cap stocks | Tagged , , , | Leave a comment

Market Timing Brief for the Gold ETF (GLD) Close On 1-24-2014: Gold Continues to Rally

A Market Timing Report based on the 1-24-2014 Close published Sunday January 26th, 2014

Gold made more progress as the stock markets of the world sold off this past week.  Stay on board this up trend and add slowly as we go higher if you are under-invested in the metals.  And follow the 10 Year Treasury as well ( link to upper right).  It is what is energizing/confirming this gold rally.

The chart below shows that GLD must make it through some immediate resistance (aqua and yellow lines).

Here’s the chart:

gld-gold-etf-market-timing-chart-2014-01-24-close-HP

Gold rally continues.

To keep up with my latest thoughts on gold on my access page, you’ll need the password, which you can get here:

Free Subscription to My Newsletter Out Sunday Night

Standard Disclaimer: It’s your money and your decision as to how to invest it.

Follow Me on Twitter Here

I thank Worden Brothers for the chart system I use to post these charts.  If you want to know more about the charting system I use every day, go to my “Other Resources” page here:  Other Resources   It makes it much easier to follow along with me if you can see the charts and manipulate them on your own computer, so it’s a great investment to have an excellent charting system.

Look for updates on the main chart tracking pages this week as I feel they are needed and comments via Twitter.

Copyright © 2014 By Wall Street Sun and Storm Report, LLC All rights reserved.

Posted in gold, investment, metals | Tagged , , | Leave a comment

Market Timing Brief for the 10 Year Treasury Note Yield (TNX) Close on 1-24-2014: The Drop Came!

A Market Timing Report based on the 1-24-2014 Close published Sunday January 26th, 2014

The 10 Year Treasury yield is falling again, having broken support near the 50 day moving average.  This break is supporting the metal rallies we’ve seen (note GLD chart update).  The pullback has been enough to support a bounce, but further pain in the emerging markets will likely bring yields down to one of the lower red lines in the chart below.  Check out the chart of the emerging markets ETF VWO via the link to the upper right.

The interest rate chart for the 10 Year Treasury Note:

tnx-10-year-treasury-note-market-timing-chart-2014-01-24-close

10 Year Treasury Note is rallying as stocks sell off. This is supporting gold and silver prices (see update!).

Please keep up with my latest thoughts about the markets on the access page on the main website.  Get the password here: Free Subscription to My Newsletter

Standard Disclaimer: It’s your money and your decision as to how to invest it.

Follow me on Twitter here:  Follow Me on Twitter

I thank Worden Brothers for the chart system I use to post these charts.  If you want to know more about the charting system I use every day, go to my “Other Resources” page here:  Other Resources   It makes it much easier to follow along with me if you can see the charts and manipulate them on your own computer, so it’s a great investment to have an excellent charting system.

Look for updates on Twitter: @SunAndStormInv

Copyright © 2014 By Wall Street Sun and Storm Report, LLC All rights reserved.

Posted in Bonds, investment, Treasuries | Tagged , , | Leave a comment

Market Timing Brief for the Foreign Index Closes (VGK, VPL, VWO) on 1-24-2014: Damaged

A Market Timing Report based on the 1-24-2014 Close published Sunday January 26th, 2014

Let’s start with Europe (VGK), which fell to around the 50 day moving average.  We are told things have been improving both in terms of credit and the economy in Europe, and if that is in fact true, we’d expect reasonable support to hold in this pullback and the rally to continue.  If the 50 day moving average area does not hold, look for a fall to the first red line below (chart just below).  You’ll note that the last test at about the 50 day moving average did hold, although the last test was a bit deeper.

The VGK European ETF Chart:

vgk-europe-etf-market-timing-chart-2014-01-24-close

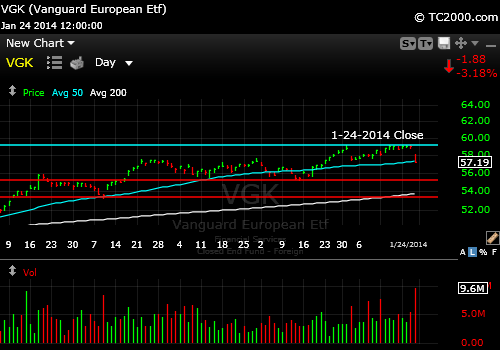
Europe hit 1st support this week.

The Pacific Rim (VPL) has suffered significant new damage over the two day period ending this Friday.  The Japanese yen has been rallying which hurts the biggest component of the Pacific Rim index.  The market topped out in mid-November and has since attempted a rally from the top HORIZONTAL aqua line (chart below), but it failed over the past two days.  Note the rally back to the curved aqua line representing the 50 day moving average on 1-02-2014, followed by the failure.

The Pacific Rim ETF Chart (VPL)

vpl-pacific-rim-etf-market-timing-chart-2014-01-24-close

The Pacific Rim is selling off and in danger of falling to next support.

What about the Emerging Markets?  We lightened up again on the emerging markets a while back when the rally weakened.  You can see in the chart below that the index ETF looks like it’s dropping to one of the two red lines below the current price.  If that does not hold, the US markets will be selling off in a big way in my opinion.  The emerging markets must eventually move up with the developed markets or it says the world economy is in trouble.  The emerging markets have gone sideways for years now as the developed markets have charged ahead.

Who are our new customers in the developed markets?  They are in the emerging markets.  We must now rally together sometime soon.  That may be days, weeks or a few months away, but if it’s a year or more off, you can forget seeing any decent returns in the developed indexes for months to come.  In my opinion this failure of VWO is a negative prognostic sign for all markets.

The chart of the Emerging Markets (VWO):

vwo-emerging-markets-etf-market-timing-chart-2014-01-24-close

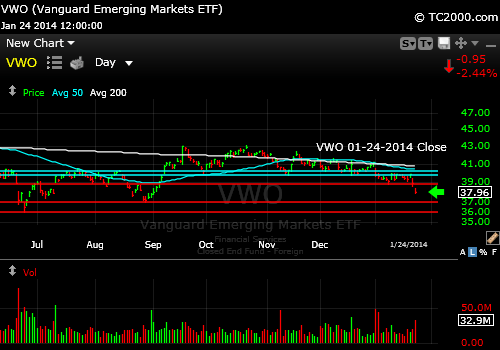
Emerging markets slipping, again.

As mentioned, investor sentiment is starting to flash caution signs.  I covered the latest sentiment report this past week.  Be sure to read it.  You can access my thoughts after getting the password here: Free Subscription to My Newsletter and access to my latest comments  I’ll send you back the password to the access page and the monthly newsletter in the same email.

I will also publish my BUY/SELL signals later today for the 6 major indices we invest in, including those discussed above.  You can access all of it on the WSSSR access page referred to in the email you’ll get when you sign up at the above link.   All the best in your investing and trading.

Standard Disclaimer: It’s your money and your decision as to how to invest it.

I also comment regularly on Twitter: Follow Me on Twitter

I thank Worden Brothers for the chart system I use to post these charts.  If you want to know more about the charting system I use every day, go to my “Other Resources” page here:  Other Resources   It makes it much easier to follow along with me if you can see the charts and manipulate them on your own computer, so it’s a great investment to have an excellent charting system.

Look for updates on the main chart tracking pages this week as I feel they are needed and comments via Twitter.

Copyright © 2014 By Wall Street Sun and Storm Report, LLC All rights reserved.

Posted in emerging markets, European Stocks, investment, Pacific Rim | Tagged , , , | Leave a comment

Market Timing Brief for the SP500 Index Close on 1-17-2014: Failed Breakout

A Market Timing Report based on the 1-17-2014 Close published Monday January 20th, 2014

The SP500 Index (SPX, SPY) has not broken down yet, but it did fail at a double top at the end of the week.  If 1823.73 holds it on the pullback (1-06 low), we’ll have a reverse head and shoulders set-up for a further rally. 

Another logical place for a pullback would be 1815.52, the 1-13-2014 low.  By the time it reaches that point, we’ll also be flirting with the 50 day moving average, which COULD provide support.   There ARE buyers left in this market still as evidenced by Intel’s (INTC) action this past week.  It could have easily fallen to it’s 50 day moving average but did not after a very soft forecast for the coming year.  It fell and then bounced.

SP500 Index Chart:

sp500-index-market-timing-chart-2014-01-17-close

SP500 Index has not broken down yet, but did double top last week.

As mentioned last week, investor sentiment is starting to flash caution signs.  I will cover my thoughts on investor sentiment for free subscribers by posting it tomorrow morning.  Be sure to read it.  You can access my thoughts after getting the password here: Free Subscription to My Newsletter and access to my latest comments  I’ll send you back the password to the access page and the monthly newsletter in the same email.

Standard Disclaimer: It’s your money and your decision as to how to invest it.

I also comment regularly on Twitter: Follow Me on Twitter

I thank Worden Brothers for the chart system I use to post these charts.  If you want to know more about the charting system I use every day, go to my “Other Resources” page here:  Other Resources   It makes it much easier to follow along with me if you can see the charts and manipulate them on your own computer, so it’s a great investment to have an excellent charting system.

Look for updates on the main chart tracking pages this week as I feel they are needed and comments via Twitter.

Copyright © 2014 By Wall Street Sun and Storm Report, LLC All rights reserved.

Posted in investment, large cap stocks | Tagged , , , | Leave a comment

Market Timing Brief for the Gold ETF (GLD) Close On 1-17-2014: Gold Acting Well

A Market Timing Report based on the 1-17-2014 Close published Monday January 20th, 2014

Gold is still in rally mode.  Hang on for the ride, and if interest rates fall another notch (see chart link to Treasury Yield to right), buy more gold (GLD).  Silver (SLV) and gold stocks (GDX) should do even better just as they did worse on the way down, so consider buying the pullbacks in GDX and diversifying into silver (SLV).  Use a stop.  There are still lots and lots of people betting against the metals.  They’ve been right for a long time and the metals must now prove themselves.

Here’s the chart:

gld-gold-etf-market-timing-chart-2014-01-17-close-HP

Gold still in rally mode.

To keep up with my latest thoughts on gold on my access page, you’ll need the password, which you can get here:

Free Subscription to My Newsletter Out Sunday Night

Standard Disclaimer: It’s your money and your decision as to how to invest it.

Follow Me on Twitter Here

I thank Worden Brothers for the chart system I use to post these charts.  If you want to know more about the charting system I use every day, go to my “Other Resources” page here:  Other Resources   It makes it much easier to follow along with me if you can see the charts and manipulate them on your own computer, so it’s a great investment to have an excellent charting system.

Look for updates on the main chart tracking pages this week as I feel they are needed and comments via Twitter.

Copyright © 2014 By Wall Street Sun and Storm Report, LLC All rights reserved.

Posted in gold, investment, metals | Tagged , , | Leave a comment

Market Timing Brief for the 10 Year Treasury Note Yield (TNX) Close on 1-17-2014: Another Drop in Rates to Come?

A Market Timing Report based on the 1-17-2014 Close published Monday January 20th, 2014

The 10 Year Treasury yield attempted a rebound from support around the 50 day moving average and has since fallen back for another test.  The close on Friday was below the 50 day moving average so the next support is 2.819% at the 1-13-2014 low.  A breach there should be celebrated by the metals, housing, and REITs.

The market has been believing that the economy is recovering in which case rates should be RISING, not falling, unless they stay somewhat range bound at levels toward the upper end of the 2013 range.  Remember that the Fed has powder it is still expending in buying Treasuries and mortgage backed securities to keep rates artificially low.

The interest rate chart for the 10 Year Treasury Note:

tnx-10-year-treasury-note-market-timing-chart-2014-01-17-close

Retest of support.

Please keep up with my latest thoughts about the markets on the access page on the main website.  Get the password here: Free Subscription to My Newsletter

Standard Disclaimer: It’s your money and your decision as to how to invest it.

Follow me on Twitter here:  Follow Me on Twitter

I thank Worden Brothers for the chart system I use to post these charts.  If you want to know more about the charting system I use every day, go to my “Other Resources” page here:  Other Resources   It makes it much easier to follow along with me if you can see the charts and manipulate them on your own computer, so it’s a great investment to have an excellent charting system.

Look for updates on Twitter: @SunAndStormInv

Copyright © 2014 By Wall Street Sun and Storm Report, LLC All rights reserved.

Posted in Bonds, investment, Treasuries | Tagged , , | Leave a comment

Market Timing Brief for the SP500 Index Close on 1-10-2014: Finally Made It Back Up Over “My Number”

A Market Timing Report based on the 1-10-2014 Close published Sunday January 12th, 2014

The SP500 Index (SPX, SPY) hit my first major target and pulled back, but it has not broken down badly yet.  This week it danced around an important resistance number (which I affectionately refer to as “my number” of the day), which was 1828.24 this past week, the high on 1-03-2014.  I did not have to look up that number to type it, because it had the market under a spell for not just one day, but for several days.  For 3 days, it closed below it after trading around it each day, and on Friday, the market was finally able to close above it, which is Bullish.  I now expect the market can either hit that white line again or at least re-top at the prior high of 1849.44 or so.

sp500-index-market-timing-chart-2014-01-10-close

SP500 Index hit one of my targets, pulled back gently and is now SLOWLY rising.

As mentioned last week, investor sentiment is starting to flash caution signs.  I covered my thoughts on investor sentiment for free subscribers on Thursday, and why there may be one more push up before a significant correction, so be sure to read it.  You can access my thoughts after getting the password here: Free Subscription to My Newsletter and access to my latest comments  I’ll send you back the password to the access page and the monthly newsletter in the same email.

Standard Disclaimer: It’s your money and your decision as to how to invest it.

I also comment regularly on Twitter: Follow Me on Twitter

I thank Worden Brothers for the chart system I use to post these charts.  If you want to know more about the charting system I use every day, go to my “Other Resources” page here:  Other Resources   It makes it much easier to follow along with me if you can see the charts and manipulate them on your own computer, so it’s a great investment to have an excellent charting system.

Look for updates on the main chart tracking pages this week as I feel they are needed and comments via Twitter.

Copyright © 2014 By Wall Street Sun and Storm Report, LLC All rights reserved.

Posted in investment, large cap stocks | Tagged , , , | Leave a comment

Market Timing Brief for the Gold ETF (GLD) Close On 1-10-2014: The Rally Continues

A Market Timing Report based on the 1-10-2014 Close published Sunday January 12th, 2014

Gold responded well to the fall in the 10 Year Treasury yield as employment disappointed this past Friday.  Note though that it has merely risen to the 50 day moving average which acted as resistance.  The progress is good and verifies our trading buy last week, although the momentum needs to continue into the coming week.  Remember this is only a trade and it requires a reasonable nearby stop to protect capital. 

When any asset is in a Bear market, I trade it, I don’t invest unless I think the asset is cheap after selling off.  Is gold truly cheap?  No one can really tell you other than the fact that the prevailing belief is that mines will shut down on gold under 1200 or so.  That is what this floor is about they say.  We’ll believe what they say if the chart respects what they say and sell when it doesn’t.  That’s my plan.  Have a plan that suits you.  If you merely hold gold as insurance against fiat currencies, fine; keep buying it no matter what the price is.

Here’s the chart:

gld-gold-etf-market-timing-chart-2014-01-10-close

Gold rising from critical support.

To keep up with my latest thoughts on gold on my access page, you’ll need the password, which you can get here:

Free Subscription to My Newsletter Out Sunday Night

Standard Disclaimer: It’s your money and your decision as to how to invest it.

Follow Me on Twitter Here

I thank Worden Brothers for the chart system I use to post these charts.  If you want to know more about the charting system I use every day, go to my “Other Resources” page here:  Other Resources   It makes it much easier to follow along with me if you can see the charts and manipulate them on your own computer, so it’s a great investment to have an excellent charting system.

Look for updates on the main chart tracking pages this week as I feel they are needed and comments via Twitter.

Copyright © 2014 By Wall Street Sun and Storm Report, LLC All rights reserved.

Posted in gold, investment, metals | Tagged , , | Leave a comment

Market Timing Brief for the 10 Year Treasury Note Yield (TNX) Close on 1-10-2014: Bad Employment Report Sends Yields Lower

A Market Timing Report based on the 1-10-2014 Close published Sunday January 12th, 2014

The 10 Year Treasury yield is back below 3% and below the 2.984% breakout point based on the poor employment report out on Friday.  The truth the government would rather bury is that many workers are simply giving up on finding a job, resulting in the lowest labor participation rate in decades.  This is all good news for gold (be sure to check out the chart link to the upper right) and silver, but conveys the sense that the economy could disappoint investors in regard to earnings this year.

The interest rate chart for the 10 Year Treasury Note:

tnx-10-year-treasury-note-market-timing-chart-2014-01-10-close

Rates vacillating with reports of economic strength and then weakness.

Please keep up with my latest thoughts about the markets on the access page on the main website.  Get the password here: Free Subscription to My Newsletter

Standard Disclaimer: It’s your money and your decision as to how to invest it.

Follow me on Twitter here:  Follow Me on Twitter

I thank Worden Brothers for the chart system I use to post these charts.  If you want to know more about the charting system I use every day, go to my “Other Resources” page here:  Other Resources   It makes it much easier to follow along with me if you can see the charts and manipulate them on your own computer, so it’s a great investment to have an excellent charting system.

Look for updates on Twitter: @SunAndStormInv

Copyright © 2014 By Wall Street Sun and Storm Report, LLC All rights reserved.

Posted in Bonds, investment, Treasuries | Tagged , , | Leave a comment