Market Timing Brief for the 10 Year Treasury Note Yield (TNX) Close on 1-10-2014: Bad Employment Report Sends Yields Lower

A Market Timing Report based on the 1-10-2014 Close published Sunday January 12th, 2014

The 10 Year Treasury yield is back below 3% and below the 2.984% breakout point based on the poor employment report out on Friday.  The truth the government would rather bury is that many workers are simply giving up on finding a job, resulting in the lowest labor participation rate in decades.  This is all good news for gold (be sure to check out the chart link to the upper right) and silver, but conveys the sense that the economy could disappoint investors in regard to earnings this year.

The interest rate chart for the 10 Year Treasury Note:

tnx-10-year-treasury-note-market-timing-chart-2014-01-10-close

Rates vacillating with reports of economic strength and then weakness.

Please keep up with my latest thoughts about the markets on the access page on the main website.  Get the password here: Free Subscription to My Newsletter

Standard Disclaimer: It’s your money and your decision as to how to invest it.

Follow me on Twitter here:  Follow Me on Twitter

I thank Worden Brothers for the chart system I use to post these charts.  If you want to know more about the charting system I use every day, go to my “Other Resources” page here:  Other Resources   It makes it much easier to follow along with me if you can see the charts and manipulate them on your own computer, so it’s a great investment to have an excellent charting system.

Look for updates on Twitter: @SunAndStormInv

Copyright © 2014 By Wall Street Sun and Storm Report, LLC All rights reserved.

Posted in Bonds, investment, Treasuries | Tagged , , | Leave a comment

Market Timing Brief for the SP500 Index Close on 1-03-2014: Hit a Resistance Line

A Market Timing Report based on the 1-03-2014 Close published Sunday January5th, 2014

The SP500 Index (SPX, SPY) finally rose to my first target and pulled back a bit.  So far, it’s just a dip, but dips can turn into more substantial corrections as explained in this month’s newsletter.  Subscribe at no charge below.

sp500-index-market-timing-chart-2014-01-03-close

SP500 Index falling from resistance line

Sentiment is starting to flash caution signs and it’s once again a must read this week, as the predicted losses occurred this past week.  I covered my thoughts on investor sentiment for free subscribers on Thursday, so be sure to read them.  You can access them after getting the password here: Free Subscription to My Newsletter and access to my latest comments  I’ll send you back the password to the access page and the monthly newsletter in the same email.

Standard Disclaimer: It’s your money and your decision as to how to invest it.

I also comment regularly on Twitter: Follow Me on Twitter

I thank Worden Brothers for the chart system I use to post these charts.  If you want to know more about the charting system I use every day, go to my “Other Resources” page here:  Other Resources   It makes it much easier to follow along with me if you can see the charts and manipulate them on your own computer, so it’s a great investment to have an excellent charting system.

Look for updates on the main chart tracking pages this week as I feel they are needed and comments via Twitter.

Copyright © 2014 By Wall Street Sun and Storm Report, LLC All rights reserved.

Posted in investment, large cap stocks | Tagged , , , | Leave a comment

Market Timing Brief for the Gold ETF (GLD) Close On 1-03-2014: Rally from the Basement?

A Market Timing Report based on the 1-03-2014 Close published Sunday January5th, 2014

Gold held the prior low and is bouncing.   I called a trading buy last week and have spelled out the risks and benefits of owning gold in this month’s free newsletter out tonight (link below).  Silver has also been rising nicely (SLV).

Here’s the chart:

gld-gold-etf-market-timing-chart-2014-01-03-close

Gold rising from the ashes?

To keep up with my latest thoughts on gold on my access page, you’ll need the password, which you can get here:

Free Subscription to My Newsletter Out Sunday Night

Standard Disclaimer: It’s your money and your decision as to how to invest it.

Follow Me on Twitter Here

I thank Worden Brothers for the chart system I use to post these charts.  If you want to know more about the charting system I use every day, go to my “Other Resources” page here:  Other Resources   It makes it much easier to follow along with me if you can see the charts and manipulate them on your own computer, so it’s a great investment to have an excellent charting system.

Look for updates on the main chart tracking pages this week as I feel they are needed and comments via Twitter.

Copyright © 2014 By Wall Street Sun and Storm Report, LLC All rights reserved.

Posted in gold, investment, metals | Tagged , , | Leave a comment

Market Timing Brief for the 10 Year Treasury Note Yield (TNX) Close on 1-03-2014: Rates Still Above Last Breakout

A Market Timing Report based on the 1-03-2014 Close published Sunday January5th, 2014

The 10 Year Treasury yield is back slightly below 3%, but above the breakout point noted last week and in the chart below.  The Fed is lowering QE (Quantitative Easing) slowly, so rates should rise slowly.  If they speed up their climb, stocks will take a hit, especially interest rate sensitive ones.  Gold will likely fail to hold support as well (see GLD chart link to right).

The interest rate chart for the 10 Year Treasury Note:

tnx-10-year-treasury-note-market-timing-chart-2014-01-03-close

Rates still rising but pulled below 3%.

Please keep up with my latest thoughts about the markets on the access page on the main website.  Get the password here: Free Subscription to My Newsletter

Standard Disclaimer: It’s your money and your decision as to how to invest it.

Follow me on Twitter here:  Follow Me on Twitter

I thank Worden Brothers for the chart system I use to post these charts.  If you want to know more about the charting system I use every day, go to my “Other Resources” page here:  Other Resources   It makes it much easier to follow along with me if you can see the charts and manipulate them on your own computer, so it’s a great investment to have an excellent charting system.

Look for updates on Twitter: @SunAndStormInv

Copyright © 2014 By Wall Street Sun and Storm Report, LLC All rights reserved.

Posted in Bonds, investment, Treasuries | Tagged , , | Leave a comment

Market Timing Brief for the SP500 Index Close on 12-27-2013: Hitting Resistance Lines

A Market Timing Report based on the 12-27-2013 Close published Sunday December 29th, 2013

The SP500 Index (SPX, SPY) has met my first upside target, the white line on the chart below.  The next target is in play for the Bulls, but it’s going to likely require some earnings reports that please the street.  As explained in my 10 Year Treasury discussion (see link to upper right), stocks now have some growing competition depending on how fast rates rise.  If they rise very quickly, expect the SPX to suffer along with most the rest of the world’s stock markets.  If earnings rise faster than rates, further highs become possible.  2014 needs to be the year for impressive earnings.

sp500-index-market-timing-chart-2013-12-27-close

SP500 Index met my first major target.

Sentiment is starting to flash caution signs and it’s a must read this week.  I covered my thoughts on investor sentiment for free subscribers on Thursday, so be sure to read them.  You can access them after getting the password here: Free Subscription to My Newsletter and access to my latest comments  I’ll send you back the password to the access page and the monthly newsletter in the same email.

Standard Disclaimer: It’s your money and your decision as to how to invest it.

I also comment regularly on Twitter: Follow Me on Twitter

I thank Worden Brothers for the chart system I use to post these charts.  If you want to know more about the charting system I use every day, go to my “Other Resources” page here:  Other Resources   It makes it much easier to follow along with me if you can see the charts and manipulate them on your own computer, so it’s a great investment to have an excellent charting system.

Look for updates on the main chart tracking pages this week as I feel they are needed and comments via Twitter.

Copyright © 2013 By Wall Street Sun and Storm Report, LLC All rights reserved.

Posted in investment, large cap stocks | Tagged , , , | Leave a comment

Market Timing Brief for the Gold ETF (GLD) Close On 12-27-2013: Rising from the Bottom

A Market Timing Report based on the 12-27-2013 Close published Sunday December 29th, 2013

Gold has moved up this past week in the face of rising interest rates.  This could be due to several factors.  First, gold selling has been going on for months, so sellers may finally be exhausted.  Second, the cost of the marginal ounce of gold produced is somewhere around the low of 1190, so supply will fall below there.  It then becomes a support level.  Third, inflation is actually picking up in places like Japan, which is highly unusual for that country, hitting 1.2% after years of deflationary pressure.

The Japanese government is attempting to stimulate growth by forcing assets into equities, just as our Fed has done, as well as cheapening the yen which makes Japanese companies more competitive worldwide.  If the Japanese government keeps rates very low while inflation increases, real interest rates fall and gold becomes more attractive.

There is another important issue in the U.S.  The Fed’s taper turned out to be a mini-taper, which meant to the gold market that there is the distinct possibility that inflation could kick up prior to sufficient Fed tapering of the QE program.  There are only two ways to get to higher gold prices, but they both end up in the bottom line of LOW real interest rates.

Remember that we’ll follow the chart in the end and no theory will prevent us from taking action and selling should gold break down to new lows.  That is my plan.  Decide what works for you.  If you have no gold, it is a buy here with a stop below the 1190 London spot price.

Here’s the chart:

gld-gold-etf-market-timing-chart-2013-12-27-close

Gold rising in the face of rising interest rates this week.

To keep up with my latest thoughts on gold on my access page, you’ll need the password, which you can get here:

Free Subscription to My Newsletter

Standard Disclaimer: It’s your money and your decision as to how to invest it.

Follow Me on Twitter Here

I thank Worden Brothers for the chart system I use to post these charts.  If you want to know more about the charting system I use every day, go to my “Other Resources” page here:  Other Resources   It makes it much easier to follow along with me if you can see the charts and manipulate them on your own computer, so it’s a great investment to have an excellent charting system.

Look for updates on the main chart tracking pages this week as I feel they are needed and comments via Twitter.

Copyright © 2013 By Wall Street Sun and Storm Report, LLC All rights reserved.

Posted in gold, investment, metals | Tagged , , | Leave a comment

Market Timing Brief for the 10 Year Treasury Note Yield (TNX) Close on 12-27-2013: Over the Top!

A Market Timing Report based on the 12-27-2013 Close published Sunday December 29th, 2013

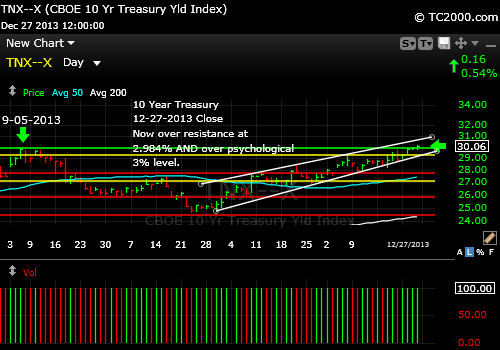
The 10 Year Treasury yield has now risen above 3%.  If the yield continues to rise slowly, the stock market and even housing stocks could be OK, but if yields rise rapidly within a week or two to 3.5% for example, the stock markets of the world may react to that move in a negative way, and so would housing and metals.  There is always competition between earnings yields on stocks and yields in Treasuries and bonds.  A slow rise in rates is expected by the market, as I’ve been saying, if the economy is in fact improving.

This means that if corporate earnings are soft for Q4 in the second week of January, stocks could sell off if rates continue higher despite those sluggish earnings.  In the end, we need to follow the markets and not make assumptions, but the above is a general guide to the next few weeks on rates and earnings.  Stocks will have to show rising earnings in the face of rising rates for the stock market rally to continue.

Rising rates did NOT hurt the gold ETF, GLD, this past week.  I’ll tell you why in my new post to the upper right.

Here is the interest rate chart for the 10 Year Treasury Note:

tnx-10-year-treasury-note-market-timing-chart-2013-12-27-close

Rates now above prior high and also above 3%.

Please keep up with my latest thoughts about the markets on the access page on the main website.  Get the password here: Free Subscription to My Newsletter

Standard Disclaimer: It’s your money and your decision as to how to invest it.

Follow me on Twitter here:  Follow Me on Twitter

I thank Worden Brothers for the chart system I use to post these charts.  If you want to know more about the charting system I use every day, go to my “Other Resources” page here:  Other Resources   It makes it much easier to follow along with me if you can see the charts and manipulate them on your own computer, so it’s a great investment to have an excellent charting system.

Look for updates on the main chart tracking pages this week as I feel they are needed and comments via Twitter.

Copyright © 2013 By Wall Street Sun and Storm Report, LLC All rights reserved.

Posted in Bonds, investment, Treasuries | Tagged , , | Leave a comment

Market Timing Brief for the SP500 Index Close on 12-20-2013: Bounce to an All Time High

A Market Timing Report based on the 12-20-2013 Close published Sunday December 22nd, 2013

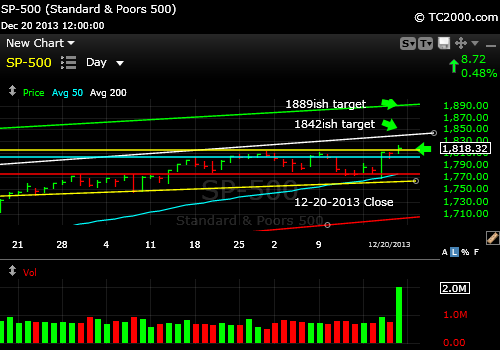
The SP500 Index bounced well beyond initial resistance to close the first day above the prior intraday all time high.  We need a couple of daily closes up here to verify the move, but the pre-holiday period is often strong on a seasonal basis.  Tis’ the season!

We were fully invested going into this move, not shaken out by the last pullback, which has worked so far.  Now we see if it sticks.  Note the new targets on the chart below, 1842 or even 1889.  I’ll be following sentiment as usual for clues as to when the next pullback might be.

Note the big spike in volume on Friday?  It is due to option expiration and does not have the meaning of high volume on other days.  Of course the fact that the market broke out to a new high on such a day is still positive.

sp500-index-market-timing-chart-2013-12-20-close

SP500 Index at a New All Time High

I covered my thoughts on investor sentiment for free subscribers on Thursday, so be sure to read them.  You can access them after getting the password here: Free Subscription to My Newsletter and access to my latest comments  I’ll send you back the password to the access page and the monthly newsletter in the same email.

Standard Disclaimer: It’s your money and your decision as to how to invest it.

I also comment regularly on Twitter: Follow Me on Twitter

I thank Worden Brothers for the chart system I use to post these charts.  If you want to know more about the charting system I use every day, go to my “Other Resources” page here:  Other Resources   It makes it much easier to follow along with me if you can see the charts and manipulate them on your own computer, so it’s a great investment to have an excellent charting system.

Look for updates on the main chart tracking pages this week as I feel they are needed and comments via Twitter.

Copyright © 2013 By Wall Street Sun and Storm Report, LLC All rights reserved.
Posted in investment, large cap stocks | Tagged , , , | Leave a comment

Market Timing Brief for the Gold ETF (GLD) Close On 12-20-2013: Tested the Major Low.

A Market Timing Report based on the 12-20-2013 Close published Sunday December 22nd, 2013

Gold tested the prior major low and bounced slightly, which is only a start.  The response of the 10 Year Treasury Yield was to initially rise to test the 3% area, but the close as the chart shows (link to right), there was a pullback that followed back down to near the Weds. close.  If the 10 Year Yield stays near 3%, gold will have a chance to rally from here, but if Treasury yields continue to fall this week, gold may break down to a significant new low.  If you buy here, please strongly consider using a stop.  The fall below support could be damaging.

Here’s the chart:

gld-gold-etf-market-timing-chart-2013-12-20-close

Gold tested the major low and bounced a little. More work to do to prove a double bottom is forming.

To keep up with my latest thoughts on gold on my access page, you’ll need the password, which you can get here:

Free Subscription to My Newsletter

Standard Disclaimer: It’s your money and your decision as to how to invest it.

Follow Me on Twitter Here

I thank Worden Brothers for the chart system I use to post these charts.  If you want to know more about the charting system I use every day, go to my “Other Resources” page here:  Other Resources   It makes it much easier to follow along with me if you can see the charts and manipulate them on your own computer, so it’s a great investment to have an excellent charting system.

Look for updates on the main chart tracking pages this week as I feel they are needed and comments via Twitter.

Copyright © 2013 By Wall Street Sun and Storm Report, LLC All rights reserved.
Posted in gold, investment, metals | Tagged , , | Leave a comment

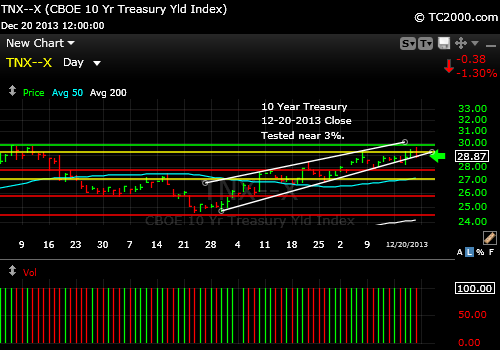
Market Timing Brief for the 10 Year Treasury Note Yield (TNX) Close on 12-20-2013: Tested the Top

A Market Timing Report based on the 12-20-2013 Close published Sunday December 22nd, 2013

The 10 Year Treasury yield tested the prior high in the 3% area after the Fed announcement that their dollar busting Quantitative Easing program will be scaled back by 10 billion of the current 85 billion US dollars in January.  Few expected it.  It does displace the full blame for the “QE Taper” from the incoming Chair of the Fed, Dr. Janet Yellen.

This caused rates to rise to test the 3% area, but by Friday they were back down near the Weds. close the day of the Fed announcement.  The Fed did taper QE, yes, but not dramatically, so rates could still experience enough downward pressure to satisfy the bond market.  A rise to a new yield high would negate this notion, so continue to follow the 10 year Treasury yield with me.

Rising rates hurt the gold ETF, GLD, this past week once again as you can see at the link to the right.

Here is the interest rate chart for the 10 Year Treasury Note:

tnx-10-year-treasury-note-market-timing-chart-2013-12-20-close

Test of 3% area and followed by a pullback.

Please keep up with my latest thoughts about the markets on the access page on the main website.  Get the password here: Free Subscription to My Newsletter

Standard Disclaimer: It’s your money and your decision as to how to invest it.

Follow me on Twitter here:  Follow Me on Twitter

I thank Worden Brothers for the chart system I use to post these charts.  If you want to know more about the charting system I use every day, go to my “Other Resources” page here:  Other Resources   It makes it much easier to follow along with me if you can see the charts and manipulate them on your own computer, so it’s a great investment to have an excellent charting system.

Look for updates on the main chart tracking pages this week as I feel they are needed and comments via Twitter.

Copyright © 2013 By Wall Street Sun and Storm Report, LLC All rights reserved.

Posted in Bonds, investment, Treasuries | Tagged , , | Leave a comment