Market Timing Brief for the Gold ETF (GLD) Close on 12-13-2013: Momentum Lost, but Major Low Not Violated

A Market Timing Report based on the 12-13-2013 Close published Sunday December 15th, 2013

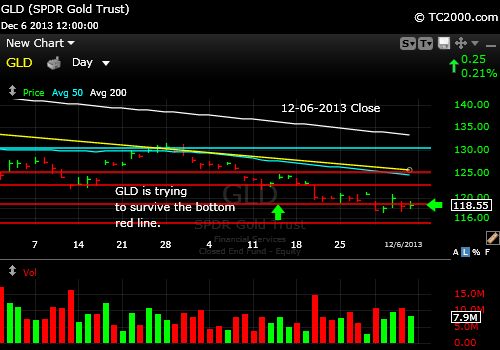
Gold attempted a rally this week which mostly failed, although we ended the week above the 11-25 low of 119.13, which is a slight positive.

The fact that we have to squint to find good things going on with gold is no shocker.  Gold plays off of the real interest rate (return above inflation) and needs a weak currency and/or significant inflation and/or a panic to rally.  We have no panic, and the Fed is threatening to cut back QE which would both strengthen the dollar and allow rates to edge up.  The dollar is likely to strengthen in the absence of QE infinity, which makes gold weaker all things being equal.  Stronger dollars buy more gold.

Read last week’s post on GLD by clicking on the link to the right, if you have not read it.  You need to protect your gold profits at some level.

Here’s the chart:

gld-gold-etf-market-timing-chart-2013-12-13-close

GLD is languishing near major support. It MUST hold.

To keep up with my latest thoughts on gold on my access page, you’ll need the password, which you can get here:

Free Subscription to My Newsletter

Standard Disclaimer: It’s your money and your decision as to how to invest it.

Follow Me on Twitter Here

I thank Worden Brothers for the chart system I use to post these charts.  If you want to know more about the charting system I use every day, go to my “Other Resources” page here:  Other Resources   It makes it much easier to follow along with me if you can see the charts and manipulate them on your own computer, so it’s a great investment to have an excellent charting system.

Look for updates on the main chart tracking pages this week as I feel they are needed and comments via Twitter.

Copyright © 2013 By Wall Street Sun and Storm Report, LLC All rights reserved.

Posted in gold, investment, metals | Tagged , , | Leave a comment

Market Timing Brief for the 10 Year Treasury Note Yield (TNX) Close on 12-13-2013: Rates Still Climbing

A Market Timing Report based on the 12-13-2013 Close published Sunday December 15th, 2013

The 10 Year Treasury yield is still up this past week.  There is a lot of nervousness about what the Fed may do in December (their meeting is this Tues and Weds. with a press conference Weds.).  Pulling the plug on the markets in December would seem to be counterproductive, because significant losses in the stock market will not support buying before Christmas, which is the economy’s most important period to book revenues and profits.

So many are betting against a move prior to next year, perhaps in March.  Producer prices were quite low on last report, so that may keep the U.S. dollar helicopters flying through New Years Eve at least.

Rising rates hurt the recovery that had started in GLD this past week as you can see at the link to the right.

Here is the interest rate chart for the 10 Year Treasury Note showing an intact upward channel on a collision course with 2.984% (about 3%):

tnx-10-year-treasury-note-market-timing-chart-2013-12-13-close

Rates are still rising.

Please keep up with my latest thoughts about the markets on the access page on the main website.  Get the password here: Free Subscription to My Newsletter

Standard Disclaimer: It’s your money and your decision as to how to invest it.

Follow me on Twitter here:  Follow Me on Twitter

I thank Worden Brothers for the chart system I use to post these charts.  If you want to know more about the charting system I use every day, go to my “Other Resources” page here:  Other Resources   It makes it much easier to follow along with me if you can see the charts and manipulate them on your own computer, so it’s a great investment to have an excellent charting system.

Look for updates on the main chart tracking pages this week as I feel they are needed and comments via Twitter.

Copyright © 2013 By Wall Street Sun and Storm Report, LLC All rights reserved.

Posted in Bonds, investment, Treasuries | Tagged , , | Leave a comment

Market Timing Brief for the Emerging Market ETF (VWO) Close on 12-06-2013: The Best Choice for 2014?

A Market Timing Report based on the 1-2013 Close published Sunday December 8th, 2013

The Emerging Markets have at least for now made a bottom and are moving up.  Decent valuation with a higher dividend yield are there too if you compare VWO vs. the SP500 Index.  I’m fully invested in the emerging markets now, actually with a 25% overexposure vs. my usual maximum exposure.

On the chart below, you can see that VWO did NOT make it through resistance the last two times it has tried, and even formed a lower high in the prior move, but I believe the 3rd time may work, because there have been two higher lows since the last major low shown.  It paused at the 50 day moving average on Friday, so it could turn down from that resistance on negative news.

The risks?  If growth slows more than was thought or if interest rates rise too fast, emerging markets may underperform the US markets.  But if the US employment rate is improving (to 7% this past month from 7.3%), it means more people shopping for emerging market goods in the United States, which means E’s will rise for emerging markets into 2014.

Despite the risks, my money is where my mouth is.  You can decide for yourself.

The VWO Close on 12-06-2013

vwo-emerging-markets-etf-market-timing-chart-2013-12-06-close

Emerging markets represent value bouncing from the prior low.

For some other useful information…I covered my thoughts on investor sentiment for free subscribers, which you can access after getting the password here: Free Subscription to My Newsletter and access to my latest comments  I’ll send you back the password to the access page and the monthly newsletter in the same email.  

Standard Disclaimer: It’s your money and your decision as to how to invest it.

I also comment regularly on Twitter: Follow Me on Twitter

I thank Worden Brothers for the chart system I use to post these charts.  If you want to know more about the charting system I use every day, go to my “Other Resources” page here:  Other Resources   It makes it much easier to follow along with me if you can see the charts and manipulate them on your own computer, so it’s a great investment to have an excellent charting system.

Look for updates on the main chart tracking pages this week as I feel they are needed and comments via Twitter.

Copyright © 2013 By Wall Street Sun and Storm Report, LLC All rights reserved.

Posted in investment, large cap stocks | Tagged , , | Leave a comment

Market Timing Brief for the SP500 Index Close on 12-06-2013: More Upside?

A Market Timing Report based on the 12-06-2013 Close published Sunday December 8th, 2013

The SP500 Index could decide to pull back from right here, but my sentiment analysis (go to access page after getting free password via the subscription link below) says otherwise.

The next upside SP500 targets are 1831 (top white line below) or 1883 (green line below) if it really stretches on the money flows from discouraged bond investors.  They aren’t used to losing money on their investments, especially when they’re told their money is safe.

sp500-index-market-timing-chart-2013-12-06-close

The SP500 Index is hitting the top red line but may make it to one of the upper two channel lines.

I covered my thoughts on investor sentiment for free subscribers, which you can access after getting the password here: Free Subscription to My Newsletter and access to my latest comments  I’ll send you back the password to the access page and the monthly newsletter in the same email.  

Standard Disclaimer: It’s your money and your decision as to how to invest it.

I also comment regularly on Twitter: Follow Me on Twitter

I thank Worden Brothers for the chart system I use to post these charts.  If you want to know more about the charting system I use every day, go to my “Other Resources” page here:  Other Resources   It makes it much easier to follow along with me if you can see the charts and manipulate them on your own computer, so it’s a great investment to have an excellent charting system.

Look for updates on the main chart tracking pages this week as I feel they are needed and comments via Twitter.

Copyright © 2013 By Wall Street Sun and Storm Report, LLC All rights reserved.

Posted in investment, large cap stocks | Tagged , , , | Leave a comment

Market Timing Brief for the Gold ETF (GLD) Close on 12-06-2013: Gold Fell Again and Is Still Not Rallying

A Market Timing Report based on the 12-06-2013 Close published Sunday December 8th, 2013

Gold fell again this past week and failed to rally.  A potential short term reversal on Wednesday failed by Thursday which is not saying much.    The gold ETF (GLD) seems like it’s pushing to test the prior major low at the lowest red line on the chart below.  And the only reason it may hold is that most everyone hates gold now.  After a bounce from that low, if the Bulls are lucky, gold will hold onto its gains.  Some big firms are predicting major news lows for gold, so there are still Bears roaming the metal fields.

Consider taking out all your profits as I did (at 1370 months ago), especially if the prior major low does not hold.  Sometimes a break is quick and then there’s a reversal, so you might want to sell in steps.  It’s your money, so do what you feel is best.  Eventually, the US dollar will get into trouble on the QE policy of the Fed in my opinion and gold will rebound once again, but don’t give up all your profit waiting for that to happen.

Here’s the chart:

gld-gold-etf-market-timing-chart-2013-12-06-close

Gold did not fall for a few days, but that is not good enough. No bottom yet, but the lowest red line on the chart is where it could land and test support.

To keep up with my latest thoughts on gold on my access page, you’ll need the password, which you can get here:

Free Subscription to My Newsletter

Standard Disclaimer: It’s your money and your decision as to how to invest it.

Follow Me on Twitter Here

I thank Worden Brothers for the chart system I use to post these charts.  If you want to know more about the charting system I use every day, go to my “Other Resources” page here:  Other Resources   It makes it much easier to follow along with me if you can see the charts and manipulate them on your own computer, so it’s a great investment to have an excellent charting system.

Look for updates on the main chart tracking pages this week as I feel they are needed and comments via Twitter.

Copyright © 2013 By Wall Street Sun and Storm Report, LLC All rights reserved.

Posted in gold, investment, metals | Tagged , , | Leave a comment

Market Timing Brief for the 10 Year Treasury Note Yield (TNX) Close on 12-06-2013: Will Rates Push Up to 3% Again Soon?

A Market Timing Report based on the 12-06-2013 Close published Sunday December 8th, 2013

The 10 Year Treasury yield tested the top of the yellow channel we’ve been following for months and failed to go further.  Despite this failure at resistance, the yield trend is still UP until proven otherwise.  This should have pressured interest rate sensitive stocks at the end of last week, but instead they moved up.  Find out what I’ve been buying on my Twitter feed, which always has the most up to date info during the week.  This rate game could shift quickly if the Fed surprises the market with a QE reduction in December.  Most are not expecting it until perhaps March of next year.  I can’t see it happening prior to Christmas.  The Fed would be shooting itself in the foot.

The chart below will determine the direction of gold in the near future (see gold chart link to the upper right).

Here is the interest rate chart for the 10 Year Treasury Note:

tnx-10-year-treasury-note-market-timing-chart-2013-12-06-close

Rates locked in a range, but tested the upper end. Will they rise further and break through?

Please keep up with my latest thoughts about the markets on the access page on the main website.  Get the password here: Free Subscription to My Newsletter

Standard Disclaimer: It’s your money and your decision as to how to invest it.

Follow me on Twitter here:  Follow Me on Twitter

I thank Worden Brothers for the chart system I use to post these charts.  If you want to know more about the charting system I use every day, go to my “Other Resources” page here:  Other Resources   It makes it much easier to follow along with me if you can see the charts and manipulate them on your own computer, so it’s a great investment to have an excellent charting system.

Look for updates on the main chart tracking pages this week as I feel they are needed and comments via Twitter.

Copyright © 2013 By Wall Street Sun and Storm Report, LLC All rights reserved.

Posted in Bonds, investment, Treasuries | Tagged , , | Leave a comment

Market Timing Brief for the SP500 Index Close on 11-29-2013: Where the Bull May Hit the Wall

A Market Timing Report based on the 11-29-2013 Close published Sunday December 1st, 2013

The SP500 Index is still rising toward my original target trend line which places the “lid” at 1827 or so (the line is rising over time).  

But there is another long term trend line (green line) based on lows back in 2010 and 2011 vs. the white line that connects 2012 and 2013 highs.  That top green line measures out to about 1878 as of the close Friday.  These projections can be off a bit due to the limitations of the software, but these two lines are the major upside targets for the Bull that seems not ready to quit just yet.  The market has been rising slowly, which is helpful to the Bulls and frustrates those who choose to be permanently Bearish. 

The money flows from bonds to stocks are what is making this market go to extremes.  

sp500-index-market-timing-chart-2013-11-29-close

S&P 500 Index still a Bull Market.

I will be covering my thoughts on investor sentiment for free subscribers, but through the monthly update this time (out by late Sun. night), which you can subscribe to here: Free Subscription to My Newsletter and access to my latest comments  I’ll send you back the password to the access page in the same email.  In this monthly report, I review ALL 35 markets and their Bull vs. Bear status.  Please stay away from the Bears!

Standard Disclaimer: It’s your money and your decision as to how to invest it.

I also comment regularly on Twitter: Follow Me on Twitter

I thank Worden Brothers for the chart system I use to post these charts.  If you want to know more about the charting system I use every day, go to my “Other Resources” page here:  Other Resources   It makes it much easier to follow along with me if you can see the charts and manipulate them on your own computer, so it’s a great investment to have an excellent charting system.

Look for updates on the main chart tracking pages this week as I feel they are needed and comments via Twitter.

Copyright © 2013 By Wall Street Sun and Storm Report, LLC All rights reserved.

Posted in investment, large cap stocks | Tagged , , , | Leave a comment

Market Timing Brief for the Gold ETF (GLD) Close on 11-29-2013: Gold Low Beckons

A Market Timing Report based on the 11-29-2013 Close published Sunday December 1st, 2013

Gold went sideways this week, because rates went down just a bit.  Follow the 10 year if you want to know if gold will hold this short term support level of the past seven market days.  If it fails again, we’ll be forming a double bottom at the prior major low and Treasury yields will likely determine whether that holds as well.

Rising rates pressure gold because there is little inflation at the moment and rapidly rising rates would reduce inflationary fires even further.  Inflation is gold’s friend.  Deflation is its enemy.

Here’s the chart:

gld-gold-etf-market-timing-chart-2013-11-29-close

Gold holds new support, but prior major low beckons.

To keep up with my latest thoughts on gold on my access page, you’ll need the password, which you can get here:

Free Subscription to My Newsletter

Standard Disclaimer: It’s your money and your decision as to how to invest it.

Follow Me on Twitter Here

I thank Worden Brothers for the chart system I use to post these charts.  If you want to know more about the charting system I use every day, go to my “Other Resources” page here:  Other Resources   It makes it much easier to follow along with me if you can see the charts and manipulate them on your own computer, so it’s a great investment to have an excellent charting system.

Look for updates on the main chart tracking pages this week as I feel they are needed and comments via Twitter.

Copyright © 2013 By Wall Street Sun and Storm Report, LLC All rights reserved.

Posted in gold, investment, metals | Tagged , , | Leave a comment

Market Timing Brief for the 10 Year Treasury Note Yield (TNX) Close on 11-29-2013: Watch This Number

A Market Timing Report based on the 11-29-2013 Close published Sunday December 1, 2013

The 10 Year Treasury yield playing with a specific number on the chart and that is the 10-16-13 yield high of 2.757%.  Above there and rates are technically rising and below there, which we are at the moment, rates certainly have a chance to fall.  After all Santa Ben is there with his big bag of US dollars.  A QE taper in December would shock the markets by the way, if you are looking for a reason for a sharp correction in stocks.

The chart below will determine the direction of gold in the near future (see gold chart link to the upper right).

Here is the interest rate chart for the 10 Year Treasury Note:

tnx-10-year-treasury-note-market-timing-chart-2013-11-29-close

Rates on the cusp. The number to follow is 2.757% for the next few days.

Please keep up with my latest thoughts about the markets on the access page on the main website.  Get the password here: Free Subscription to My Newsletter

Standard Disclaimer: It’s your money and your decision as to how to invest it.

Follow me on Twitter here:  Follow Me on Twitter

I thank Worden Brothers for the chart system I use to post these charts.  If you want to know more about the charting system I use every day, go to my “Other Resources” page here:  Other Resources   It makes it much easier to follow along with me if you can see the charts and manipulate them on your own computer, so it’s a great investment to have an excellent charting system.

Look for updates on the main chart tracking pages this week as I feel they are needed and comments via Twitter.

Copyright © 2013 By Wall Street Sun and Storm Report, LLC All rights reserved.

Posted in Bonds, investment, Treasuries | Tagged , , | Leave a comment

Market Timing Brief for the SP500 Index Close on 11-22-2013: Still a Bull. And Where It Could Stop

A Market Timing Report based on the 11-22-2013 Close published Sunday November 24th, 2013

The SP500 Index is moving up to the white long term trend line that I pointed out as the next target some time ago.  My initial selling was early.  Too early as I discuss in this week’s note to free subscribers (see below).

sp500-index-market-timing-chart-2013-11-22-close

SP500 Index Bull still roaming new territory.

I covered my thoughts on investor sentiment on the WSSSR Access page on the main site this past Thursday, which you can subscribe to here: Free Subscription to My Newsletter and access to my latest comments  I’ll send you back the password to the access page in the same email.  And my post sitting right there from tonight will tell you which of the markets we focus on are Bulls and which are Bears.  Please stay away from the Bears!

Standard Disclaimer: It’s your money and your decision as to how to invest it.

I also comment regularly on Twitter: Follow Me on Twitter

I thank Worden Brothers for the chart system I use to post these charts.  If you want to know more about the charting system I use every day, go to my “Other Resources” page here:  Other Resources   It makes it much easier to follow along with me if you can see the charts and manipulate them on your own computer, so it’s a great investment to have an excellent charting system.

Look for updates on the main chart tracking pages this week as I feel they are needed and comments via Twitter.

Copyright © 2013 By Wall Street Sun and Storm Report, LLC All rights reserved.

Posted in investment, large cap stocks | Tagged , , , | Leave a comment