Market Timing Brief for the 10 Year Treasury Note Yield (TNX) Close on 11-01-2013: Moving On Up Again

A Market Timing Report based on the 11-01-2013 Close published Sunday November 3, 2013

The 10 Year Treasury yield is moving up again.  See the reversal back above the red line now just below the current price?  This will once again pressure bonds and interest rates sensitive stocks like housing stocks and REITs.  My first target in this move is the yellow line just above the current price in the chart below which is at about a yield of 2.737% (divide the number on the chart by 10).  Read my take on the SP500 Index and Gold as well (link to right – will be updated on Sunday, Nov. 3rd).

tnx-10-year-treasury-note-market-timing-chart-2013-11-01-close

Rates rising once again

Please keep up with my latest thoughts about the markets on the access page on the main website.  Get the password here: Free Subscription to My Newsletter

Standard Disclaimer: It’s your money and your decision as to how to invest it.

Follow me on Twitter here:  Follow Me on Twitter

I thank Worden Brothers for the chart system I use to post these charts.  If you want to know more about the charting system I use every day, go to my “Other Resources” page here:  Other Resources   It makes it much easier to follow along with me if you can see the charts and manipulate them on your own computer, so it’s a great investment to have an excellent charting system.

Look for updates on the main chart tracking pages this week as I feel they are needed and comments via Twitter.

Copyright © 2013 By Wall Street Sun and Storm Report, LLC All rights reserved.

Posted in Bonds, investment, Treasuries | Tagged , , | Leave a comment

Market Timing Brief for the SP500 Index Close on 10-25-2013: Just 0.44 Above Prior High

A Market Timing Report based on the 10-25-2013 Close published Sunday October 27, 2013

The SP500 Index has made yet another high, but by only 0.44 points.  Certainly, the Bulls have the ball to lose, but the failure to better the prior high by more than 0.44 points at the Friday close is not entirely positive.  If we move up one more notch, especially if we rapidly reach that upper white trend line on the chart below, this move will probably be about over.  Getting out of markets at highs is a tricky business, so I’ve hedged my position somewhat by reducing my long equity position.  How much?  I cover my thoughts on my access page, which you can subscribe to here: Free Subscription to My Newsletter  (I’ll send you back the password)

Here’s the chart:

sp500-index-market-timing-chart-2013-10-25-close

SP500 makes a new high, but barely.

Standard Disclaimer: It’s your money and your decision as to how to invest it.

Follow me on Twitter here:  Follow Me on Twitter

I thank Worden Brothers for the chart system I use to post these charts.  If you want to know more about the charting system I use every day, go to my “Other Resources” page here:  Other Resources   It makes it much easier to follow along with me if you can see the charts and manipulate them on your own computer, so it’s a great investment to have an excellent charting system.

Look for updates on the main chart tracking pages this week as I feel they are needed and comments via Twitter.

Copyright © 2013 By Wall Street Sun and Storm Report, LLC All rights reserved.

Posted in investment, large cap stocks | Tagged , , , | Leave a comment

Market Timing Brief for the Gold ETF (GLD) Close on 10-25-2013: It Will Rally If It Makes It Through THIS Resistance

A Market Timing Report based on the 10-25-2013 Close published Sunday October 27, 2013

GLD (now @ 130.46) has made it through 2 of the 3 resistance points shown in the chart, including the yellow down trend line and the 50 day moving average, but the 4-15-2013 Tax Day point low of 130.51 remains at the aqua resistance line in the chart below.  If interest rates rise from here, gold will be under pressure with the rest of the metals, so be sure to review this week’s 10 Year Treasury Chart (link to upper right).  And to keep up with my latest thoughts on my access page, you’ll need the password, which you can get here:

Free Subscription to My Newsletter

Here’s the chart:

gld-gold-etf-market-timing-chart-2013-10-25-close

GLD meeting immediate resistance, but has made progress

Standard Disclaimer: It’s your money and your decision as to how to invest it.

Follow Me on Twitter Here

I thank Worden Brothers for the chart system I use to post these charts.  If you want to know more about the charting system I use every day, go to my “Other Resources” page here:  Other Resources   It makes it much easier to follow along with me if you can see the charts and manipulate them on your own computer, so it’s a great investment to have an excellent charting system.

Look for updates on the main chart tracking pages this week as I feel they are needed and comments via Twitter.

Copyright © 2013 By Wall Street Sun and Storm Report, LLC All rights reserved.

Posted in investment, metals | Tagged , , | Leave a comment

Market Timing Brief for the 10 Year Treasury Note Yield (TNX) Close on 10-25-2013: Rates Lower Still? Would be a Negative.

A Market Timing Report based on the 10-25-2013 Close published Sunday October 27, 2013

The yield on the 10 Year Treasury Note is down to another lower level of support this week.  Will it hold?  If it does not, it is a very negative sign for the economy as it says that the Fed has failed with its massive Quantitative Easing program to stimulate economic growth.  The stock market is vulnerable to a correction based on not meeting current estimates this quarter.  It may have one more push left in it.  We’ll probably know by Monday or Tuesday at the latest.  Please read my latest thoughts about the markets on the access page on the main website.  Get the password here: Free Subscription to My Newsletter

Here’s the chart:

tnx-10-year-treasury-note-market-timing-chart-2013-10-25-close

Through one support level this past week and testing another.

Standard Disclaimer: It’s your money and your decision as to how to invest it.

Follow me on Twitter here:  Follow Me on Twitter

I thank Worden Brothers for the chart system I use to post these charts.  If you want to know more about the charting system I use every day, go to my “Other Resources” page here:  Other Resources   It makes it much easier to follow along with me if you can see the charts and manipulate them on your own computer, so it’s a great investment to have an excellent charting system.

Look for updates on the main chart tracking pages this week as I feel they are needed and comments via Twitter.

Copyright © 2013 By Wall Street Sun and Storm Report, LLC All rights reserved.

Posted in Bonds, investment, Treasuries | Tagged , , | Leave a comment

Market Timing Brief for the SP500 Index Close on 10-18-2013: New All Time High

A Market Timing Report based on the 10-18-2013 Close published Sunday October 20, 2013

The SP500 Index has made yet another all time high.  I cover my thoughts on this chart along with gold and interest rates in the notes on my access page.  You can subscribe here: Free Subscription to My Newsletter

Here’s the chart:

sp500-index-market-timing-chart-2013-10-18-close

New SP500 Highs

Standard Disclaimer: It’s your money and your decision as to how to invest it.

Follow me on Twitter here:  Follow Me on Twitter

I thank Worden Brothers for the chart system I use to post these charts.  If you want to know more about the charting system I use every day, go to my “Other Resources” page here:  Other Resources   It makes it much easier to follow along with me if you can see the charts and manipulate them on your own computer, so it’s a great investment to have an excellent charting system.

Look for updates on the main chart tracking pages this week as I feel they are needed and comments via Twitter.

Copyright © 2013 By Wall Street Sun and Storm Report, LLC All rights reserved.

Posted in investment, large cap stocks, S&P 500 Index | Tagged , , , | Leave a comment

Market Timing Brief for the Gold ETF (GLD) Close on 10-18-2013: It’s a Start

A Market Timing Report based on the 10-18-2013 Close published Sunday October 20, 2013

GLD has attained new life by closing above a bullish wedge as seen in the chart.  There is a lot of resistance just above the close on Friday.  I cover my thoughts on all of the charts from this week in the notes on my access page.  Subscribe here: Free Subscription to My Newsletter

Here’s the chart:

gld-gold-etf-market-timing-chart-2012-10-18-close

GLD showing some new life above the wedge

Standard Disclaimer: It’s your money and your decision as to how to invest it.

Follow me on Twitter here:  Follow Me on Twitter

I thank Worden Brothers for the chart system I use to post these charts.  If you want to know more about the charting system I use every day, go to my “Other Resources” page here:  Other Resources   It makes it much easier to follow along with me if you can see the charts and manipulate them on your own computer, so it’s a great investment to have an excellent charting system.

Look for updates on the main chart tracking pages this week as I feel they are needed and comments via Twitter.

Copyright © 2013 By Wall Street Sun and Storm Report, LLC All rights reserved.

Posted in investment, metals | Tagged , , | Leave a comment

Market Timing Brief for the 10 Year Treasury Note Yield (TNX) Close on 10-18-2013: Ready to Rise?

A Market Timing Report based on the 10-18-2013 Close published Sunday October 20, 2013

The yield on the 10 Year Treasury Note is right on support.  Will it hold?  My thoughts on this chart, stocks and gold are on my access page, which you can access here: Free Subscription to My Newsletter

Here’s the chart:

tnx-10-year-treasury-note-market-timing-chart-2013-10-18-close

10 Year Yields Rising Again Now?

Standard Disclaimer: It’s your money and your decision as to how to invest it.

Follow me on Twitter here:  Follow Me on Twitter

I thank Worden Brothers for the chart system I use to post these charts.  If you want to know more about the charting system I use every day, go to my “Other Resources” page here:  Other Resources   It makes it much easier to follow along with me if you can see the charts and manipulate them on your own computer, so it’s a great investment to have an excellent charting system.

Look for updates on the main chart tracking pages this week as I feel they are needed and comments via Twitter.

Copyright © 2013 By Wall Street Sun and Storm Report, LLC All rights reserved.

Posted in Bonds, investment, Treasuries | Tagged , , | Leave a comment

Market Timing Brief for the GLD Gold ETF and TNX (10 Year Treasury) Closes on 9-27-2013: A Higher Low for Gold as Interest Rates Fall

A Market Timing Report based on the 9-27-2013 Close published Sunday September 29th, 2013

UPDATE on 10-07-2013: Go to the chart tab at the top of the page to see the most recent charts on GLD, TNX, and the SP500 Index.

UPDATE @9:55 a.m. on 9-30-2013: Gold and silver are down this morning as rates are down only a little, 0.15% to a 10 Year Treasury rate of 2.614%.  Perhaps the metals wanted a strong Treasury rally and did not get it (I make that point in regard to falling rates below.)  Regardless, my “strength test” noted in the first paragraph below still applies, and gold is NOT a buy here unless you plan on using a nearby stop.

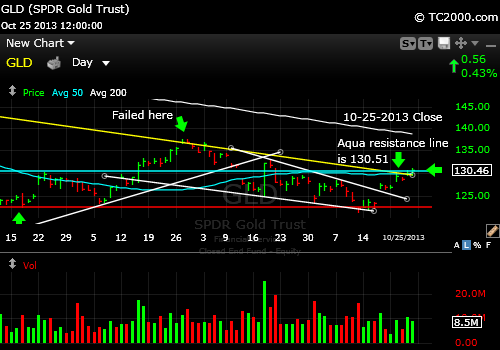
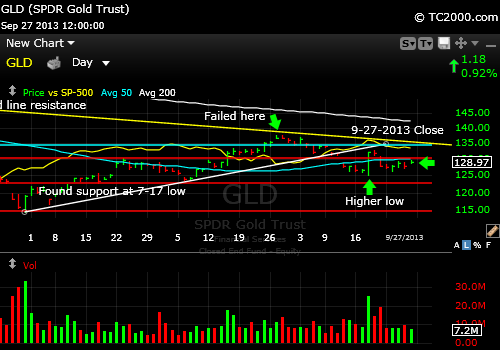
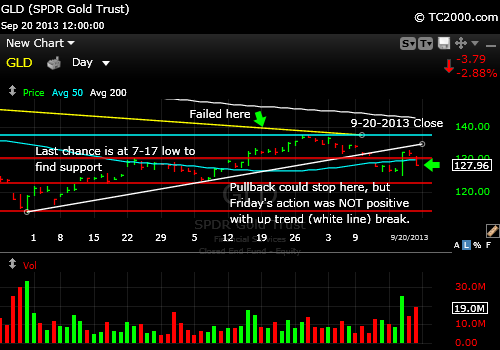
The GLD gold ETF has formed a higher low and is outperforming the SP500 Index as mentioned on Twitter in a Vine Tweet last week (see Twitter feed to right and the curved yellow line in the chart).  But there is also a lower high that has been put in.  So what we have is an ETF caught between support and resistance.   That means that to be a clear buy, GLD has to rise above the prior market timing high on the daily chart of 132.78 – that would be a show of strength.  This will happen provided ONE THING happens, which I’ll show in the second chart below.

gld-gold-etf-market-timing-chart-2012-09-27-close

GLD bouncing from higher low after being turned back from yellow resistance line.

Again, note the yellow line which is the SP500 Index.  It has been falling about since gold bottomed.

The one thing GLD needs badly is for interest rates to continue moving down as they have recently.  Here’s the chart for the U.S. 10 Year Note:

tnx-10-year-treasury-note-market-timing-chart-2013-09-27-close

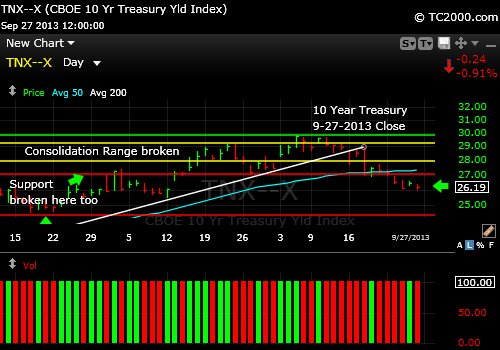
Rates are falling still. Interest rates that is, because of Fed policy to continue QE at least until October.

Yet Fed Governor Bullard said they could lower the amount of monthly QE as early as October, so rates may NOT continue falling and may keep gold range-bound as a result.  If you buy gold, you must also follow interest rates.  If the Fed overdoes easing, gold will win.  If the Fed overdoes tightening of QE and then tightens the Fed interest rates directly (it is though that the latter is a long way off in time), gold will weaken.  That is what the market is watching most closely in regard to its bets on the metals.

Also check out the SP500 Index chart (separate post just before this one).

Standard Disclaimer: It’s your money and your decision as to how to invest it.

Follow me on Twitter here:  Follow Me on Twitter

I thank Worden Brothers for the chart system I use to post these charts.  If you want to know more about the charting system I use every day, go to my “Other Resources” page here:  Other Resources   It makes it much easier to follow along with me if you can see the charts and manipulate them on your own computer, so it’s a great investment to have an excellent charting system.

To receive future reports and reminders that charts are ready to be viewed, subscribe for free here:

Free Subscription to My Newsletter

Look for updates on the main chart tracking pages this week as I feel they are needed and comments via Twitter.

Copyright © 2013 By Wall Street Sun and Storm Report, LLC All rights reserved.

Posted in Bonds, federal reserve, gold, investment, Treasuries | Tagged , , , , | Leave a comment

Market Timing Brief for the SP500 Index Close on 9-27-2013: Falling to Support

A Market Timing Report based on the 9-27-2013 Close published Sunday September 29th, 2013

UPDATE on 10-07-2013: Go to the chart tab at the top of the page to see the most recent charts on the SP500 index, GLD, and interest rates (TNX).

UPDATE for 9-30-2013 @ 8:41 a.m.: With the looming shutdown, I now expect the SP500 Index to fall to the first support line at a minimum or to the second, but it could bounce between 1646-1653.  Remember that if the shutdown of the US government is avoided, markets could immediately make back all the losses showing up in the futures this morning, so trading this could be very tricky.  Selling quite a bit of our holdings earlier is putting us in a much better position today.  Be sure to subscribe to the newsletter (see below) to have access to the private page where I often share some important details.

The SP500 Index is falling to support, but slowly.  The 50 day moving average at the aqua line in the chart could provide initial support, but that looks a bit too easy.  The up trend line denoted by the white line looks like a more likely place for the first bounce to occur.   Futures are down as I type this to 1675.75, down 9 points per CNBC at 11:44 pm.

Interest rates are falling (see that chart which I’ll post with the gold chart most likely), but not for good reasons.  They are falling because of the Fed’s insistence on continuing QE past where it is either needed and some argue has utility.  Letting interest rates rise slowly and containing the upside a bit would work better in my opinion.

See the GLD gold ETF post as well, which will be published by the morning.  NOTE: The date on the chart below is 9-27-2013.

sp500-index-market-timing-chart-2013-09-27-close

SP500 Index falling to support. Chart is for the 9-27 close.

Standard Disclaimer: It’s your money and your decision as to how to invest it.

Follow me on Twitter here:  Follow Me on Twitter

I thank Worden Brothers for the chart system I use to post these charts.  If you want to know more about the charting system I use every day, go to my “Other Resources” page here:  Other Resources   It makes it much easier to follow along with me if you can see the charts and manipulate them on your own computer, so it’s a great investment to have an excellent charting system.

To receive future reports and reminders that charts are ready to be viewed, subscribe for free here:

Free Subscription to My Newsletter

Look for updates on the main chart tracking pages this week as I feel they are needed and comments via Twitter.

Copyright © 2013 By Wall Street Sun and Storm Report, LLC All rights reserved.

Posted in federal reserve, investment, large cap stocks, S&P 500 Index, Treasuries | Tagged , , , | Leave a comment

Market Timing Brief for the GLD Gold ETF Close on 9-20-2013: Smacked Around By the Fed

A Market Timing Report based on the 9-20-2013 Close published Sunday September 22th, 2013

Please read the prior post on the SP500 and the 10 Year Treasury first and come back to this one.  I give the blow by blow on the Fed blabbing last week in that prior post.

Gold was battered in the same direction as the stock markets when the Fed first said “No QE reduction” and then said “but probably we’ll lower QE in October.”  So on Wednesday, the metal and SPX shorts were slammed, and then by Friday, a large portion of the losses had been returned to them.  Here’s where we are:

gld-gold-etf-market-timing-chart-2013-09-20-close

Gold volatility increases with the Fed “Transparency Program”!

GLD must hold that 7-17-2013 low (second red line from the bottom) at the worst or you’ll see spot gold back testing 1200/oz.  Gold is very much exposed still to Fed action, so an October QE reduction could cause any profits accrued from the last bottom to be wiped out.  Expect a new major low in gold if the Fed acts too quickly to end QE.

What does this mean?  It means gold is a trade, not a great investment unless you are simply using it as a long term dollar hedge and don’t care if it drops by another 25%, which it easily could.  If you have major gains in gold since 2001, you should preserve your entire principle at some point as I have and “ride the profits.” You might then sell a second time to protect 100% profits (sell the principle then once again sell the amount of your entire principle).  If you believe the Fed will cause hyperinflation, you should sell nothing at all and be adding to your gold position at every lower low.  Make your own judgement and then act on it with a stop loss in case you are wrong.

If and when you take money out of gold, it should likely be deployed into real estate (a house) or into stocks (not quite yet though) until the Fed drives interest rates back up above 4-5% over the very long term.  I’d consider getting a  house now if you know where you want to be or where you want to invest, before rates move back up, and I’d add to stocks on the next pullback and then hold them through the next rally, which will end when the Fed either causes inflation or does too little to support the economy by ending QE too rapidly with interest rates running well above 3%.

My Sentiment Survey, Survey Says! report is out on the private page.  Be sure to read my private comments on the main site, SunAndStorm.com, by subscribing at no charge below.

Standard Disclaimer: It’s your money and your decision as to how to invest it.

Follow me on Twitter here:  Follow Me on Twitter

I thank Worden Brothers for the chart system I use to post these charts.  If you want to know more about the charting system I use every day, go to my “Other Resources” page here:  Other Resources   It makes it much easier to follow along with me if you can see the charts and manipulate them on your own computer, so it’s a great investment to have an excellent charting system.

To receive future reports and reminders that charts are ready to be viewed, subscribe for free here:

Free Subscription to My Newsletter

Copyright © 2013 By Wall Street Sun and Storm Report, LLC All rights reserved.

Posted in federal reserve, gold, investment, Treasuries | Tagged , , | Leave a comment