A Market Timing Report based on the 12-12-2014 Close, published Saturday December 13, 2014
12-18-2014 UPDATE ON OIL STOCKS VS. OIL (XOI vs. XOIL [WTI OIL])
Note that oil is dropping much faster than the stocks. That means one or the other must converge. If you are buying oil stocks here, you need oil to rally very soon.
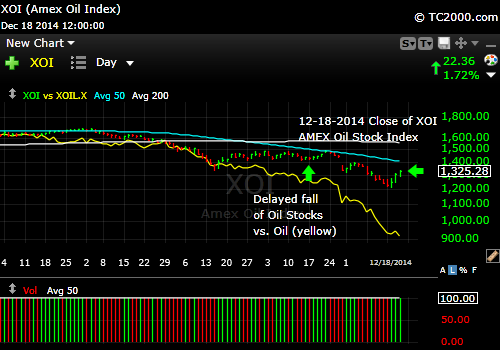
Oil stocks OR oil will have to meet at some point again. My guess? Oil will decline some more and drag down oil stocks.
12-16-2014 UPDATE ON SMALL CAP CHART (RUT, IWM):

Small caps seek support.
And now for this past week’s issue:
The SP500 Index will fall to about 1908-1950ish if this level of support does not hold. Monday could bring one more “flush” lower followed by a bounce. That final bit of selling dislodges those that see the 50 day “moving monkey average” as some disdainfully call it as a hugely important support level. Markets almost always test at least a bit below important support and any attempt to set tight stops around them most often fails. I was correct that the small cap weakness I saw and reported to you last week predicted the doom of the large cap rally.
SP500 Index (SPX, SPY; click the chart to enlarge it):

Where Will the Pullback Stop?
I am not showing the chart this week, but it turned out that the resistance level I plotted (see last week’s post) for the Chinese ETF FXI did hold back a further rally.
To find out what I’m doing, including buys and sells, please follow me here: Follow Me on Twitter®. Follow Me on StockTwits® You don’t have to make comments yourself to read my messages.
What about small caps? They failed at the same resistance level they tested three times. The only support below the yellow up trend line and 200 day moving average is the 50 day moving average. If the small caps break support, watch for the SP500 Index to break as well.
The U.S. Small Caps (RUT, IWM): Russell 2000 U.S. Small Cap Chart (click the chart to enlarge it):
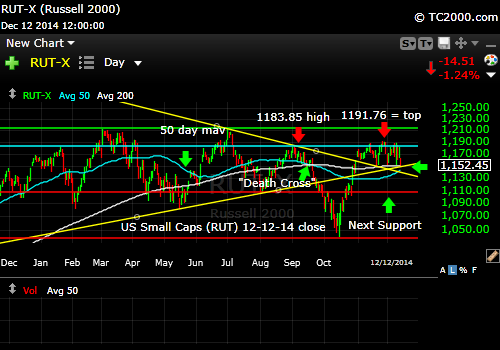
Small cap stocks fail where they were expected to fail.
Gold is still rallying. What’s very encouraging is the increase in volume with each price increase. Lower and lower rates are good for gold, because there is still some inflation and if rates head lower much faster than the world deflates, real interest rates can turn negative. There is nothing better than that for gold and other precious metal pricing.
What’s the risk? The opposite. If rates move up because the U.S. Fed raises rates in March let’s say, that would help to ward off inflation while raising returns resulting in positive real interest rates, bad for gold. Remember gold makes us nothing. The other factor that could help would be having the dollar weaken and it has been doing so. Still, it’s hard to see how the dollar could become that weak giving how moribund the Eurozone and Japanese economies are.
The Gold ETF Chart (GLD; click to enlarge the chart):

Gold Rally is Intact
The 10 Year Treasury interest rate (TNX, tracked by TLT if Bullish; TBT if Bearish): Rates are indeed plumbing the prior lows which was my original thesis. Despite that, I exited prematurely it turns out, but I think there is risk now with the Fed statement coming out this next week on Wednesday followed by a live news conference. Dr. Yellen has an opportunity to speak a lot, which could get her and the markets in trouble. The world is slowing dramatically, which gives her cover though. If she fails to take cover, however, rates will rise fast and TLT will sell off hard.
Please Click the TNX Chart to enlarge it:

Rates fall, but will they re-bottom completely?
Note that the newsletter is now closed to new subscriptions, but you can join the wait list for Loyal Subscribers Only: Join the Wait List to Join the Newsletter as a Loyal Subscriber, Opening Just Before January 1, 2015 for a few days. If you join and don’t read the newsletter, you will be deleted. Sorry, but I don’t publish to non-readers as other newsletters do. Stay tuned here in the meantime and follow all the action via the Twitter® and StockTwits® links above.
Be sure to visit the website at: Sun and Storm Investing™
Standard Disclaimer: It’s your money and your decision as to how to invest it.
I thank Worden Brothers for the charting system I use to post these charts. If you want to know more about the charting system I use every day, go to my “Other Resources” page here: Other Resources It makes it much easier to follow along with me if you can see the charts and manipulate them on your own computer. It’s a great investment to have an excellent charting system. Check it out with a free trial at the link above.
Copyright © 2014 By Wall Street Sun and Storm Report, LLC All rights reserved.
