A Market Timing Report based on the 12-19-2014 Close, published Sunday December 21, 2014
If you have not seen the update of last week’s post, you really should look at it before continuing (chart at top of last week’s post that was added later in the week). Oil stocks have not yet caught up to the oil price on the decline on the chart, so one of two things will happen of course. Oil stocks will fall further or oil will rally. Without a breakout of WTI crude above 59 for the near month futures price (that is the price quoted by CNBC for WTI Oil), there will be no continued rally in the oil stocks. They can’t go too much farther at any rate.
The Fed kept the “considerable time” phrase in the FOMC statement, but added enough wiggle room to suggest that rates could stay the same for a long time OR rise. It’s data dependent, as they like to say. Of note was the fact that in the press conference Dr. Yellen also said that 3 of the FOMC voting members objected to the conclusions of the meeting and at least one (Fisher) would like to see a rate increase by the 3rd Fed meeting (after a “couple of meanings” later clarified as 2 meetings, which brings us to the June meeting at the earliest for the first rate hike. (the statement, which you can click on a link to below, explains why each member objected)
Some suggest that the hikes could come in 0.125% increments so as not to shock the markets as much. Savers have been waiting forever for rates to rise, but they have not done so. Given the slow growth around the world and the declining GDP growth of the U.S. as well, rates are likely to continue to fall after a brief counter-rally. That means a bit more of a pullback in TLT before I’m willing to buy it again. I did buy municipal bonds last week, because some of the closed end funds are at very good value. If rates remain relatively low, which I believe they will despite the counter-rallies, owning munis should pay off as investors chase higher yields for another year or two.
The SP500 Index rallied extremely hard for three days after the Fed announcement and essentially re-topped, but as the chart shows there is room above, if the Bulls are there to buy. That yellow channel line could be the next Bull target prior to a pullback IF oil hold the current level.
SP500 Index (SPX, SPY; click the chart to enlarge it): Note that the big volume spike Friday is misleading as it always occurs with options expirations.

SP500 Index Re-Topped and there is room above as long as oil does not collapse on Monday.
I suspect that if oil does not maintain the current consolidation (see the charts I posted to Twitter®), and falls, the stock market will pull back a bit. Just today the Saudis said they won’t step in to support prices yet: Saudis Just Say No. Against that is the highly positive seasonality prior to holidays such as Christmas. I believe the pullback should be bought, and others do as well apparently, and that is probably why the market rose so fast over the past few days. Better to buy low than high. The market was catching up on the Santa Claus Rally, which has about 80% odds in favor of a gain in the last half of December.
Reports on retail sales should be strong through Christmas, because Consumer Sentiment was extremely high in the last report (see Bloomberg data). There is all that gas and oil money to spend on “stuff”!
The 3rd Revision of Q3 GDP comes out Tuesday. The market expects 4.5% vs. 3.9% prior.
| Gross Domestic Product, 3rd quarter 2014 (third estimate); Corporate Profits, 3rd quarter 2014 (revised estimate) | December 23 | 8:30 am |
I prefer this for checking the economic calendar:
Bloomberg’s data pages/calendar.
To find out what I’m doing, including buys and sells, please follow me here: Follow Me on Twitter®. Follow Me on StockTwits® You don’t have to make comments yourself to read my messages.
What about small caps? They reached a new high above the prior lower wide range they were in for months. That means they will likely re-top, which gives the SP500 room as well to rise higher. If we see small caps REVERSE from here, the large cap rally may follow suit and at least test lower again.
The U.S. Small Caps (RUT, IWM): Russell 2000 U.S. Small Cap Chart (click the chart to enlarge it):
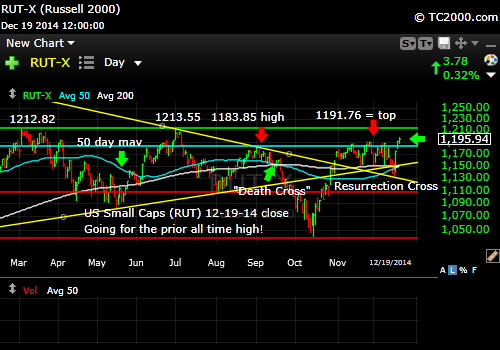
Small caps finally reach a new high and will likely run to the all time high.
Gold pulled back prior to the Fed FOMC statement release and is a bit lower now. Fortunately, the pullbacks have not been on increasing volume. Remember that declines don’t have to have much volume and can still be quite serious. A lack of buyers can drive the commodity down if sellers show up relatively unopposed. In a way, gold gave us the heads up that the Fed would overall be interpreted as being more HAWKISH on the margin vs. the more dovish stance some had expected.
The Fed in its history has often been stubborn about changing directions in policy once it gets started in a new direction. Of course, they SAY they won’t rush to raise rates if the data don’t support it, but some say that right now, that the data definitely don’t support it, and some Fed members wanted to raise rates sooner than the others (10 voted this time and 12 are normally represented). Here is the Fed Statement.
To keep this rally going in gold, we need a strong up day with a volume boost early in the week. Watch for it, but really you have to place your bet that it will rally ahead of time if that is what you believe, because gold has given back some gains each time it has rallied lately. You can see that GLD is sitting on critical support, which provides a guide for a stop below that. A close below the 2nd red line from the bottom would not go well!
The Gold ETF Chart (GLD; click to enlarge the chart):

Gold “knew” that the Fed would sound marginally more hawkish on Weds.
The 10 Year Treasury interest rate (TNX, tracked by TLT if Bullish; TBT if Bearish): Rates did rise after the FOMC statement, as I told you they would based on a marginally more hawkish Fed. They are likely to continue to rise a bit more to about 2.3% and then we will see if more can be sustained. Stay tuned on Twitter®/StockTwits® for my Buys and Sells.
Please Click the TNX Chart to enlarge it:
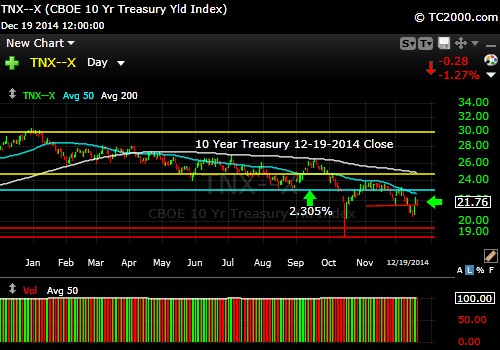
Rates are likely going to keep rising for a bit and then resume their decline.
Note that the newsletter is now closed to new subscriptions, but you can join the wait list for Loyal Subscribers Only: Join the Wait List to Join the Newsletter as a Loyal Subscriber, Opening Just Before January 1, 2015 for a few days. If you join and don’t read the newsletter, you will be deleted. Sorry, but I don’t publish to non-readers as other newsletters do. Stay tuned here in the meantime and follow all the action via the Twitter® and StockTwits® links above.
Be sure to visit the website at: Sun and Storm Investing™
Standard Disclaimer: It’s your money and your decision as to how to invest it.
I thank Worden Brothers for the charting system I use to post these charts. If you want to know more about the charting system I use every day, go to my “Other Resources” page here: Other Resources It makes it much easier to follow along with me if you can see the charts and manipulate them on your own computer. It’s a great investment to have an excellent charting system. Check it out with a free trial at the link above.
Copyright © 2014 By Wall Street Sun and Storm Report, LLC All rights reserved.
