A Market Timing Report based on the 8-07-2015 Close, published Sunday August 9, 2015
UPDATE 8-17-2015 SP500 Testing Immediate Support
2064-2068 is next support. Then 2044ish.

Retest!
I deliver focused comments on the markets. These are supplemented with “Tweets/StockTwits” (see links below).
1. The SP500 Index hesitated before last week’s report, and fell after I pointed out the weakness. Thanks for playing along with the storyline, Mr. Market. The market does not always respond to my cues. ; ) Let’s look at where we are now and then I’d like to take a lower power view:
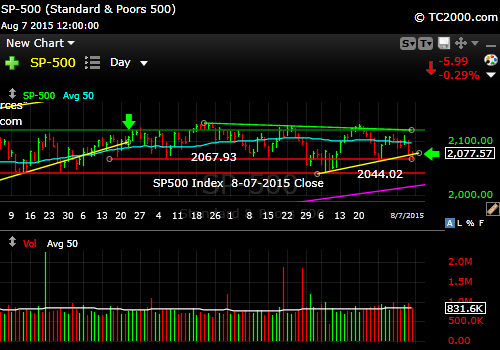
SP500 drops to next support level.
The above chart screams of failure and note that green line with the green arrow on it, and then look below to the graphic detail on the next chart:

Four failures at an important high.
Note that there are fully SIX failures to make a new high and keep it after the first high occurred on Feb. 25th. There were four failed breakouts but also two addtional lower highs on the daily chart. Could the market still find support here and bounce? Yes, of course; however, it’s very hard to make a prediction when we’re in the middle of a trading range (the recent range goes to 2044). I’d say that it’s a coin flip whether we rally from here a bit, but I believe we will test lower regardless of such a bounce. Then I would favor a drop to 2044 as a minimum downside target. It’s a very obvious number, so don’t count on it holding. That’s why it’s best to stay in touch via social media during the week using these links:
(See my messages on Twitter® Follow Me on Twitter®. Follow Me on StockTwits®).
2. Small caps found support prior to last week’s report, but they broke lower than the SP500 this week after forming a second lower high. Not good for them and not a good sign for the overall stock market. Have some cash on hand for purchases at lower prices. You may want to switch out of some higher beta small caps (trade some of them for large caps and leave some cash) during this decline and re-buy them lower. The stated beta of IWM for the past 3 years is only 1.1 per Yahoo Finance but some of your small caps may have much higher beta values (volatility vs. SPX with SPX beta defined as 1.0). Small caps are in a serious decline, again, not good for the market as a whole. Look at the next step down for small caps (1151-1153ish) on the chart:
Russell 2000 U.S. Small Cap Index (RUT, IWM; click to enlarge):

Small caps do worse than large this week.
3. Gold’s Bullish engulfing day from two weeks ago has done nothing for gold for another week. Yet the stock markets are lower, so there’s relative outperformance of gold.
Gold ETF (GLD):

Gold is still stuck though outperforming in relative terms.
4. Treasury yields
U.S. 10 Year Treasury Note (TNX,TYX,TLT,TBF): The 10 year Treasury has fallen below the 2nd yellow line from the top of the chart below:

U.S. Treasuries Beat U.S. Stocks
Treasuries have been outperforming stocks, despite the back-test this prior week, for a period of 19 market days. Rates will fall lower. Corporate bonds did not get you that return by the way. LQD (corporate bonds) did not bounce much. TLT is up 7.48% since 7-13-2015 and LQD is only up 0.93%. They had recent dividends of 0.2674 and 0.3295, respectively, or 0.23% and 0.29% (vs. 7-13 lows). As you see, TLT wins by a huge margin. This means investors see more risk in high grade corporate bonds than in Treasuries. That’s not a great sign either for the stock market.
Unless the Federal Reserve stimulates a rally by stating something publically that a Sept. rate hike is off the table (they’ve been stating the opposite), fastening your seat belts for a deeper correction would make sense. My favorite saying is “Buy fear, sell greed.” In the current context that means: Sell higher on rallies, re-buy lower on the correction. But a second guideline is not to spend all your cash at once.
Be sure to visit the website at: Sun and Storm Investing™
Standard Disclaimer: It’s your money and your decision as to how to invest it.
Note that the newsletter is now CLOSED to new subscriptions: Join the Wait List to Join the Newsletter as a Loyal Subscriber, Opening again for the October 4th issue. If you join and don’t read the newsletter, you will be deleted. Why? I don’t publish to non-readers as other newsletters do. I surround myself with committed people who value what we are doing. Stay tuned here in the meantime and follow all the action via the Twitter® and StockTwits® links above.
I thank Worden Brothers for the charting system I use to post these charts. If you want to know more about the charting system I use every day, go to my “Other Resources” page here: Other Resources It makes it much easier to follow along with me if you can see the charts and manipulate them on your own computer. It’s a great investment to have an excellent charting system. Check it out with a free trial at the link above.
Copyright © 2015 By Wall Street Sun and Storm Report, LLC All rights reserved.
