A Market Timing Report based on the 8-21-2015 Close, published Sunday August 23rd, 2015
I deliver focused comments on the markets. These are supplemented with “Tweets/StockTwits” (see links below).
1. The SP500 Index is falling in the futures markets tonight. Support has been broken yet again. The 1821 October 2014 low is a potential target, although the market is already very oversold and a bounce could happen sooner than that. The Fed may make some sort of definitive comment about holding off with rate increases due to the slowing world economic data. The implied open per CNBC is at a nasty 1932 (it’s even lower as I am finishing this post…but once a market is oversold it becomes hypersensitive to good news, so this is not where you start shorting a market).

Falling, oversold, looking for support and a bounce.
(See my messages on Twitter® Follow Me on Twitter®. Follow Me on StockTwits®).
2. Small caps are down about 2% in the futures markets late Sunday evening per CNBC bringing the open to about 1134. Things could change by tomorrow morning, but this market appears to want to extract more blood prior to rallying.
Russell 2000 U.S. Small Cap Index (RUT, IWM; click to enlarge):

Falling and looking for support.
3. Gold has reversed a major break on increasing volume. Owning something that is working while stocks are not working is what diversification is all about. Gold is benefiting from the dollar weakness I predicted along with falling yields (see prior post on when gold shines if you haven’t read it).
Gold ETF (GLD):
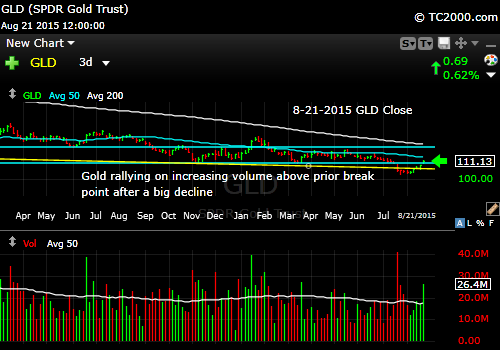
Gold reverses a prior break.
4. Treasury yields
U.S. 10 Year Treasury Note (TNX,TYX,TLT,TBF): The 10 year Treasury has been a good hedge against falling stocks. I took off some exposure, perhaps a bit early as stocks appeared oversold. We’ll look to add back exposure on a stock market bounce, but if we cannot, we’ll have our core position and some extra cash as well.
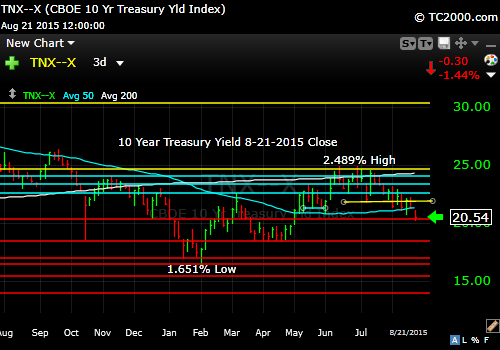
Rates falling as investors flee stocks.
Be sure to visit the website at: Sun and Storm Investing™
Standard Disclaimer: It’s your money and your decision as to how to invest it.
Note that the newsletter is now CLOSED to new subscriptions: Join the Wait List to Join the Newsletter as a Loyal Subscriber, Opening again for the October 4th issue. If you join and don’t read the newsletter, you will be deleted. Why? I don’t publish to non-readers as other newsletters do. I surround myself with committed people who value what we are doing. Stay tuned here in the meantime and follow all the action via the Twitter® and StockTwits® links above.
I thank Worden Brothers for the charting system I use to post these charts. If you want to know more about the charting system I use every day, go to my “Other Resources” page here: Other Resources It makes it much easier to follow along with me if you can see the charts and manipulate them on your own computer. It’s a great investment to have an excellent charting system. Check it out with a free trial at the link above.
Copyright © 2015 By Wall Street Sun and Storm Report, LLC All rights reserved.
