A Market Timing Report based on the 8-28-2015 Close, published Saturday August 29th, 2015
I deliver focused comments on the markets. These are supplemented with “Tweets/StockTwits” (see links below).
NOTE: Please read my “Tweets” to the bottom right of this page or HERE to see why I prefer cash and perhaps gold (GLD) in this downturn over TLT. We are not abandoning our TLT exposure completely, though we did lighten up on it a bit recently after the Chinese selling was reported.
Unfortunately, the market believes that the Fed will “incorrectly” raise rates in September and that this means rates will now be climbing. From my viewpoint, they are misguided. I believe the economy is slowing and that raising rates at this time is incorrect; at least, it’s inconsistent with their mandate to keep us out of deflation.
And what happens if they raise rates at the short end particularly with a slowing economy? The Fed could bump us into recession and slow us down even more. That means rates will fall, and we’ll make money on TLT over the longer term, even if the TLT trade does not work short term. It certainly was not working well today as these numbers show…
At the close today the score is this:
GLD: +0.11%
Cash (US dollars; UUP): -0.16%
TLT: -0.77%
SPX (SP500): -0.84%
Please be sure not to “chase” gold or any other position on strong up days! Buy the dips and use a stop in case it does not work out according to plan.
1. The SP500 Index will still get back down to the prior low of 1867, but more likely to the 1821 October 2014 low in my opinion. Last weekend I said that a bounce was very likely, but it came off a massive sell-off on Monday.
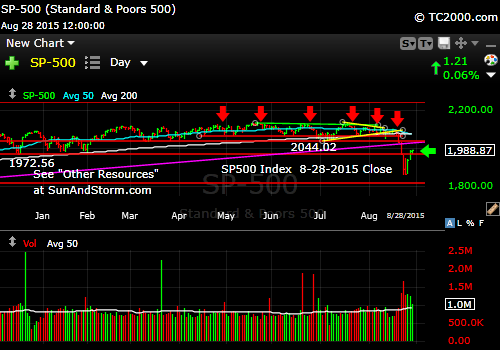
SP500 Index Takes a Wild Ride This Week. Likely to Retest Monday Low or October 2014 low.
Why should the market head back and retest? Because a big sell-off like the one we saw in the Thursday through Monday period is a big vibration essentially, and it takes time for that vibration to filter through the markets. Generally that period is 2-3 months given the damage we’ve seen. Then if the Bears have control of the market, the best we’ll see is a higher low and then a resumption of the selling. My sense is that it will take a recession to give rise to a true Bear market with multiple lower lows and lower highs.
That said, predicting the course of the economy into next year is not easy. The Federal Reserve has lots of access to data from virtually any source it chooses and still cannot predict what next quarter’s GDP is going to be. Reassuring right?
What did the Fed’s Vice Chair Fischer say on Saturday at Jackson Hole? He said the impact of oil in creating deflation is transitory and basically said the Fed should raise the Fed funds rate on Sept. 17th. That is not what the market is expecting and this may be exactly what the markets did NOT want to hear. Here are his charts and comments: Fed’s Fischer
Fischer did say that dollar strength hurts GDP out for quite a long period, and guess what? If the Fed raises rate, the dollar will shoot up even more, slowing the U.S. economy even more, possibly tipping us into a recession. Stocks would enter a Bear market if that were to happen. You need to know the risks involved in Fed stupidity. The Fed’s been stupid numerous times in the past. Allan Greenspan was responsible for the housing crisis along with the Democratic Congress that wanted everyone to have the “American dream” that shortly became the American nightmare.
Although I disagree with the way QE was done, with aspects of TARP etc., my point is that policy should be consistent with the stated goals of maintaining inflation at about 2% on a longer term basis. We are not there yet. The Fed may cause the next recession.
Still, we don’t know yet how the markets will digest the news from Jackson Hole. If we cannot wisely “sell everything,” given also that we don’t need the money over the next 3-5 years, what should we do? All I can tell you is what I’ve done. When the perceived risks are elevated for a more serious pullback, I lighten my exposure level. That level is published regularly on Twitter® and StockTwits® whenever I make a buy or a sell. Currently it is at 80% of my usual maximum equity exposure worldwide. I don’t publish the raw percentages, because I would like you to choose those for yourself. Your situation may well be different from mine.
The most exposure I’ve put on over the past 6 years is 135% when I successfully rode the China wave and exited in time to save a good portion of my profits. Note that I did not use margin to do that. I simply diverted more cash to the equity markets during the rally.
By the way, now is not the time to speculate in China. The trend is still down despite the rally this past week. Friday was very weak despite an earlier rally of the Shanghai Index. Something is wrong there when the US market sells what the Chinese market is buying. Of course, it was reported that the Chinese government was buying Chinese stocks. The selling In the U.S. may have simply been large investors taking advantage of the Chinese government’s attempt to goose their markets up. Big players who want to sell need big players who want to buy.
(See my messages on Twitter® Follow Me on Twitter®. Follow Me on StockTwits®).
2. Small caps have lost the most this past month among U.S. stocks with value stocks doing the worst. That’s because growth is what the market wants. Why? Because the economy is barely growing. That means stocks that are just good value should not appreciate much in that environment. Small caps look headed to the October low and are a likely harbinger of that for the large caps. The October low is the bottom red line in the chart below. There’s been quite a fall in a very short period of time already. I believe there is more to come.
Russell 2000 U.S. Small Cap Index (RUT, IWM; click to enlarge):
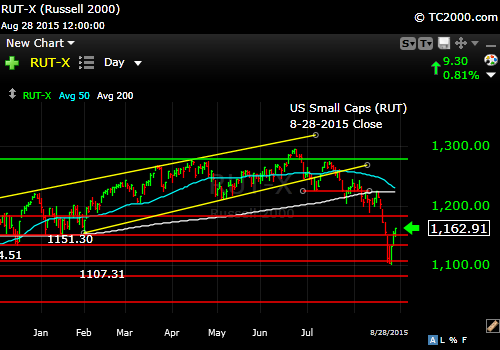
Small caps bounce, but not as enthusiastically as large caps. Investors want liquidity, so they are shying away from small caps.
3. Gold is attempting to form a higher low, but has the obvious option of forming a lower high here and turning down. All things being equal, gold does not do well initially in a big stock market sell-off, but all things are NOT equal. Gold has already endured a Bear market of its own from the prior highs. Gold is already down 40% from its all time high in Sept. 2011.
Every major currency around the world except the US dollar is still subject to central bank printing madness. Some say the U.S. Fed will engage in QE 4 to compete. That should help gold form a base. A strong U.S. dollar is a big negative unless there is financial panic abroad, in which case classically both gold and the US dollar can rally.
See my prior article on “What Makes Gold Shine” on May 11th. Of all the things that make it shine, dollar weakness and organic buying in all major currencies are the two most important ones. Translation? When people are buying gold and the price is rising, it tends to keep rising. The trend is hugely important if you plan on holding gold. Be sure to preserve a certain portion of trading profits regardless of your entry price. That rule has served me well.
Technically, the close on Friday was negative as it’s back below the prior break point.
Gold ETF (GLD):
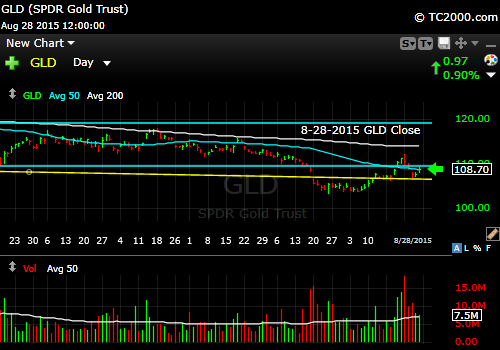
Gold forms what investors hope is a higher low. It’s below the prior breakdown however.
4. Treasury yields
U.S. 10 Year Treasury Note (TNX,TYX,TLT,TBF): The 10 year Treasury was a nice offset to stocks until this week, when rates actually rose a bit as stocks recovered. That’s been the pattern. We’ll keep some significant exposure to TLT as stocks will likely be retesting lower over the next 2-3 months.

Rates rose as stocks rallied.
Be sure to visit the website at: Sun and Storm Investing™
Standard Disclaimer: It’s your money and your decision as to how to invest it.
Note that the newsletter is now CLOSED to new subscriptions: Join the Wait List to Join the Newsletter as a Loyal Subscriber, Opening again for the October 4th issue. If you join and don’t read the newsletter, you will be deleted. Why? I don’t publish to non-readers as other newsletters do. I surround myself with committed people who value what we are doing. Stay tuned here in the meantime and follow all the action via the Twitter® and StockTwits® links above.
I thank Worden Brothers for the charting system I use to post these charts. If you want to know more about the charting system I use every day, go to my “Other Resources” page here: Other Resources It makes it much easier to follow along with me if you can see the charts and manipulate them on your own computer. It’s a great investment to have an excellent charting system. Check it out with a free trial at the link above.
Copyright © 2015 By Wall Street Sun and Storm Report, LLC All rights reserved.

I made three buys as the market sold off, two of the buys were at the lows just prior to the massive reversal bringing my total allocations to stocks to 75% invested from a 95% cash position (the 95% cash resulted from sells as the markets peaked at the highs). I sold some on Friday with nice gains and now I’m at 50% cash. I will likely sell more if the markets continue higher and I will certainly buy more On pull backs when retest of lows such as the October low is reached and or breached to the down side. A break of the October low and a move by the Fed Resv to raise rates would cause absolute panic selling! I’ll be buying!
Great that it worked. It does not always work, so going to 95% cash does add risk of missed opportunity. What if the Fed were to initiate QE 4 suddenly? Then we might fall behind and the market may not look back. I admit that it will take some time for the Fed to get to that point, but it provides an example of an outside event that could drive stocks up another 20% in a year.
Say you are usually invested at the 50% level and risk rises in the markets (such as the risk of a recession, which is very negative for stocks). If you cut back to 80% invested vs. usual that places only 40% of your assets at risk. If you lose about half on paper, that loss is “only” 20% of all your assets on paper and your bonds are probably appreciating, as well as your gold holdings perhaps, so you may only be down 10-15% vs. your total investable assets. That should not dramatically affect your lifestyle as you wait for the market to recover.
Given this reasoning (remember that if you are invested in high beta stocks your losses could be 70-80% vs. 50%), I do a few things when risk rises. 1. Cut back exposure to at least that 80% of usual exposure level and 2. Go to lower beta stocks and high liquidity and ETFs in general that won’t fall as much if the market declines in a big way. 3. Increase investments that could run counter to a stock market decline (TLT at this time is one possible candidate for that, though many are skeptical that rates will fall further. ) 4. Add exposure when things get stretched to the downside and sell the rallies if they happen too fast, and things become stretched to the upside. It’s possible to add higher beta stocks back on the extremes if you can pick your spots well.
It takes time to mend the kind of volatility we saw last week, despite what the perma-Bulls may say. There will soon be a better opportunity to buy than the current one, which is “in the middle” of a range.