A Market Timing Report based on the 10-30-2015 Close, published Monday Nov. 2nd, 2015
UPDATE 11-05-2015: Survey Says! And Why The Market May Break Down Again
I’ll tell you why AAII.com Individual Investory Sentiment is negative this week. It’s because the market went up and drew in hardly any new Bulls. The Bull – Bear spread went from 19.8% to 20.4%, barely moving up on the rally. And now we’re in a consolidation chartwise just prior to the employment report this Friday the 6th. This means we have higher prices and no new Bulls to sustain the rally. At least not now. That’s why I’ve reduced my exposure as mentioned on social media (links below).
The employment situation report could be weak again as it surprised on the weak side last month. Last month we only had 142,000 new jobs vs. expectations of economists for 190,000 new jobs for Friday’s report on October employment. Click on the employment situation link HERE and you’ll see that job creation peaked and is falling.
The danger is not a slightly weak report. That would likely be viewed favorably, because it allows the Fed to not hike in December. The danger is a VERY weak report relative to expectations, which could be finally seen as “bad is bad,” rather than the previous sense of the market that “bad is good” because it holds off a rate hike.
Now I will admit that in the short term (weeks), a very weak employment report could be seen as “good” in that the Fed won’t be able to hike as a result, but over the intermediate terms (months), it could mean the economy is headed into a recession. Eventually “bad is bad” if the economy slows. Recessions are Bull market killers. We may not see one anytime soon, but some believe we will and that the slowing is accelerating from the 42 year employment peak we reached.
The other danger is a report that is far too strong vs. expectations. Anything above 250,000 would not be taken well, as it would mean that the Fed could be falling behind on raising rates and that it will therefore hike interest rates in December.
Either of the negative scenarios that I outlined above would potentially break the upward Bearish wedge I show in the first chart below. The break point is SPY 208.17 and SPX 2080.76 for me.
A break below there could cause a strong acceleration of selling with the SP500 Index reaching what could be a full retest of the most recent daily low, perhaps lower. Looking back to the 2011 scenario which this has resembled (and I believe I was one of the first to point this out prior to being discussed on CNBC), there was a very significant dip in November prior to the rally into year’s end. I’m sensing the same could happen this November.
Now back to this week’s report….
I deliver focused comments on the markets. These are supplemented with “Tweets/StockTwits” (see links below).
1. SP500 Index: As pointed out on Friday, the SP500 Index has formed a Bearish upward wedge, and if it breaks please refer to the prior update for the target to which it will fall most likely. GDP was weak at 1.5% this past week. That is an annualized projection down big from a robust prior results of 3.9%. That is a huge deceleration and some say will lead us into a recession. We will follow the markets, which represents the sum total consciousness of all economic data among other myriad influences. We try not to get too far ahead of ourselves by making “predictions,” but there is certainly room to run to 2126-2134 if the Bulls want it. Stay tuned with me throughout the week on social media (links below).
SP500 Index (SPX SPY; click to enlarge):

SP500 Index must break up out of the wedge.
As of the close Monday, the SPX is well up into the wedge, but must move up through the top yellow line. If it breaks the other way, the warnings I made apply.
Keep up to date at Twitter and StockTwits: See my messages on Twitter® Follow Me on Twitter®. Follow Me on StockTwits®).
2. Small caps remain behind large caps in this rally, but the Monday buying is stronger and is encouraging for the overall market. They are up about double large caps today.
UPDATE after Monday close: 1194 is the next challenge. The strength in the small caps along with the large caps is encouraging for the Bull case.
Russell 2000 U.S. Small Cap Index (RUT, IWM; click to enlarge):

Small caps still lag large caps.
3. Gold is doomed to weakness when rates rise and drive the US dollar up. Added to that misery was organic gold selling on “up dollar” days.
Gold ETF (GLD):
UPDATE 11-03-2015: GLD is below the lower orange line shown below and on its way to test 106, which is the lower yellow trend line representing the lower trend line forming the big downward wedge, which in itself is Bullish. The buying range would be 105.27 to 106.
I’d use a stop for a close below that support personally, but have your own plan. If the dollar keeps rallying, this gold trade won’t work out. I believe the Fed will be truly dumb to raise rates into a worldwide slowdown, but when have government organizations been consistently smart? Gold will eventually rally as the truth dawns on the markets that the Fed won’t be able to raise rates much at all. And if they do, all HECK will break loose in the markets as we slide into a Fed created recession.
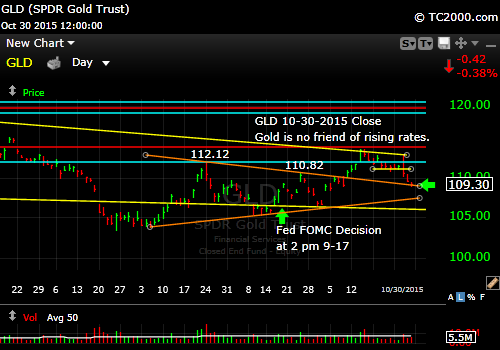
Gold failed a big breakout attempt and is skidding on higher rates in view of the possible rate hike in Dec.
UPDATE after Monday Close: Gold was down and so were Treasuries. The latter stopped right at the 2.187% resistance line. No coincidence. Fear of the Fed could push rates even higher however (and Treasury prices down).
4. 10 Year Treasury Note Yield: Rates rose a bit on the Fed hike risk increase. They should theoretically fall if the Fed is wrong on inflation. Raising rates into deflation could induce a full economic recession, not just the earnings recession we’ve witnessed to date. Rates should therefore remain in a range. When rates are high, buy TLT and when they are low sell it! I decreased the size of my position a bit and am more focused on municipal bonds for income at the moment.
U.S. 10 Year Treasury Note Yield (TNX,TYX,TLT,TBF):
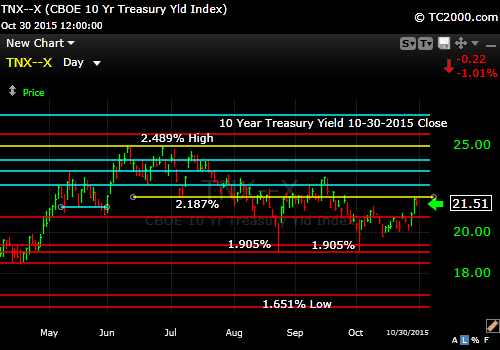
Rates rise on Fed rate hiking fear.
Be sure to visit the website at: Sun and Storm Investing™
Standard Disclaimer: It’s your money and your decision as to how to invest it.
I thank Worden Brothers for the charting system I use to post these charts. If you want to know more about the charting system I use every day, go to my “Other Resources” page here: Other Resources It makes it much easier to follow along with me if you can see the charts and manipulate them on your own computer. It’s a great investment to have an excellent charting system. Check it out with a free trial at the link above.
Note that the newsletter is now CLOSED to new subscriptions: Join the Wait List to Join the Newsletter as a Loyal Subscriber, Opening again for the January 3rd issue. If you join and don’t read the newsletter, you will be deleted. Why? I don’t publish to non-readers as other newsletters do. I surround myself with committed people who value what we are doing. Stay tuned here in the meantime and follow all the action via the Twitter® and StockTwits® links above.
Copyright © 2015 By Wall Street Sun and Storm Report, LLC All rights reserved.
