A Market Timing Report based on the 11-06-2015 Close, published Sunday Nov. 8th, 2015
UPDATE 11-08-2015: At the Bottom of the SP500 Index Range
Take a look at where the market stopped today. The wedge is broken, yes, and that could bring more pain (read up on my targets on Twitter/StockTwits). We are just about 2 points from the bottom of one of the ranges that has been in play. If the retail numbers are consensus, the market could rally. Too strong or too weak may favor the Bears. Watch to see if that 2044.02 number holds tomorrow after we hear about retail sales at 8:30 a.m. ET.
Click the chart to enlarge it:
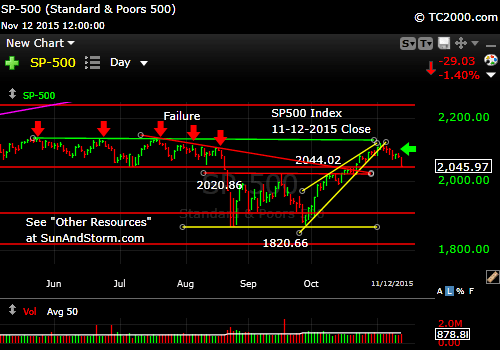
Bottom of a recent trading range.
And now back to this week’s full report.
I deliver focused comments on the markets. These are supplemented with “Tweets/StockTwits” (see links below).
1. SP500 Index: It was an exciting week for the markets with an overly strong employment report of 271,000 jobs when 190,000 were expected by Bloomberg News. Yet the stock market did fine afterward with the NASDAQ 100 up slightly for the day and the SP500 Index pulling back only slightly (-0.03%) after a deeper dip earlier in the day on Friday. I believe the market is starting to view “good news as good news” rather than bad, which it had done until fairly recently.
IF the employment number is not a fluke, then GDP should be fine through year end, and the Federal Reserve WILL be raising rates in December. Rising rates are not a problem as long as the Fed does not overdo it. That is true historically. Stock markets typically do OK with gradually rising rates. Some say, the economy is different and the impact of higher rates on stock buybacks is bigger than people understand. There are many cross currents, so we’ll remain vigilant.
Bears say things are much worse than the U.S. employment number this month says they are. They claim GDP will turn negative sooner than expected should the Fed raises rates a few times in the next 6 months. That means they are expecting a recession. I won’t pick sides on that fight. I’ll follow the charts. I moved back up to 98% invested vs. my usual maximum equity exposure (follow this on Twitter/StockTwits as it changes and it can dramatically within days), because buying in the U.S. market still looks good.
IF the wedge shown in the chart below should break, there would be another serious dip at least prior to potential recovery into year end. I am not in the business of making predictions beyond what is happening now. Why? A 911 can change market conditions on a dime; so can a Japanese tsunami. We could get that last big pullback as we did in the 2011 market that this pullback has resembled in many ways. It’s better to follow the markets rather than follow the dreams of Bulls and Bears who are ego-invested in the outcome they are predicting. We won’t indulge in ego-based thinking.
SP500 Index (SPX SPY; click to enlarge): You can see that for the last few days, all we have had is a simple consolidation. I’d say the bias is UP at the moment especially given the small cap confirmation noted in the next chart below.
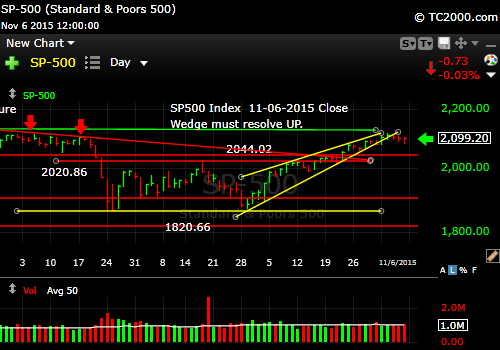
SP500 must not break the wedge, but what it did after the employment report was fine – it stayed in the consolidation.
Keep up to date at Twitter and StockTwits: See my messages on Twitter® Follow Me on Twitter®. Follow Me on StockTwits®).
2. Small caps broke above the mid-Sept. high. This is very Bullish for the entire U.S. market. We’re staying long for now.
Russell 2000 U.S. Small Cap Index (RUT, IWM; click to enlarge):
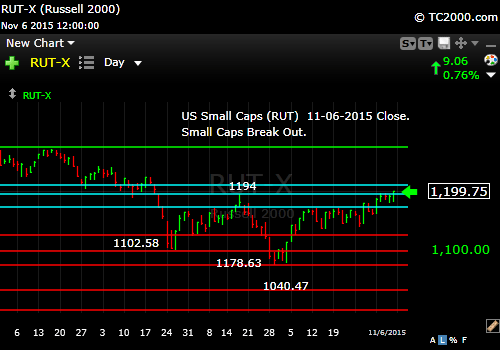
Small caps DO catch up a bit finally. Positive.
3. Gold did horribly as I said would happen if a Fed rate hike became more likely. Stay away. I hope you took profits. If not, you learned something. Don’t be fooled next time or try not to be!
What could be the reason for yet another break in gold’s buying support? Remember that the strong economy (if it’s still true when we get next month’s number) is also bad for gold, because productive assets like stocks are favored over non-productive assets like gold when the earnings strengthen. Earnings have recently weakened, but the employment numbers were a hint that things may be picking up once again. Watch your stops.
Gold ETF (GLD; click to enlarge):
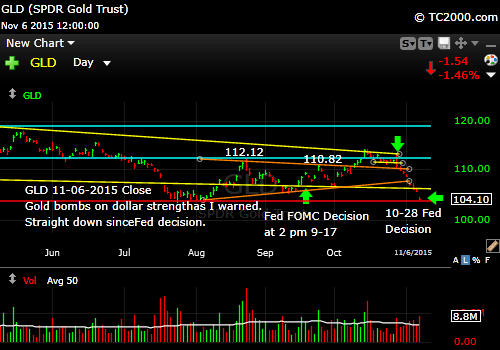
Gold punished by strong dollar/rising rates after Fed and employment number.
4. 10 Year Treasury Note Yield: Longer term, UNLESS the Fed is actually behind on inflation (doubtful), rates should DROP again. So we may have to be patient and endure some bond pain back up to the 2.489% level or higher.
If oil prices start to rise, watch out though, because rates can go up a lot faster on pricier oil. If the economy is actually slowing down and Friday’s employment number was a fluke, rates will come down again and bonds/Treasuries will rally in price.
For now, we have a new upside breakout in rates on our hands. Stay clear of all highly interest rate sensitive ETFs like utilities until the smoke clears. It has not yet cleared! If you want to get fancy and trade the extremes from day to day, go ahead, but be sure to take profits fast.
U.S. 10 Year Treasury Note Yield (TNX,TYX,TLT,TBF):

10 Year Note looks headed to 2.489%. Not good for bond holders.
Be sure to visit the website at: Sun and Storm Investing™
Standard Disclaimer: It’s your money and your decision as to how to invest it.
I thank Worden Brothers for the charting system I use to post these charts. If you want to know more about the charting system I use every day, go to my “Other Resources” page here: Other Resources It makes it much easier to follow along with me if you can see the charts and manipulate them on your own computer. It’s a great investment to have an excellent charting system. Check it out with a free trial at the link above.
Note that the newsletter is now CLOSED to new subscriptions: Join the Wait List to Join the Newsletter as a Loyal Subscriber, Opening again for the January 3rd issue. If you join and don’t read the newsletter, you will be deleted. Why? I don’t publish to non-readers as other newsletters do. I surround myself with committed people who value what we are doing. Stay tuned here in the meantime and follow all the action via the Twitter® and StockTwits® links above.
Copyright © 2015 By Wall Street Sun and Storm Report, LLC All rights reserved.
