A Market Timing Report based on the 12-24-2015 Close, published Sunday December 27th, 2015
I deliver focused comments on the markets. These are supplemented with “Tweets/StockTwits” (see links below).
I hope everyone who celebrates it had a very Merry Christmas. Let’s make 2016 a great year, no matter what the markets choose to do!
1. SP500 Index: Now would be a perfect time on the chart for the Bears to reassert themselves. If they do not, look for a lower high that could reach all the way to 2103 if the Bulls are lucky. The pause of the markets near the intersection of 50 and 200 day moving averages (white and aqua curved lines) suggests otherwise. Had the test of the November low been “clean,” with a clear bounce from that level, we might be in a different situation. As a result of weakness I saw on this bounce, I took off some more exposure this week (you can check those levels at the Twitter/StockTwits links below).
Keep up to date at Twitter and StockTwits: See my messages on Twitter® Follow Me on Twitter®. Follow Me on StockTwits®).
SP500 Index Chart (click to enlarge; SPX, SPY):

Lower high about to show itself or more upside?
2. U.S. Small caps are just above mid-range, which is never a great place to buy or sell. The index could turn over after a flirtation with the 50 day moving average (curved aqua line).
Russell 2000 U.S. Small Cap Index (RUT, IWM; click to enlarge):
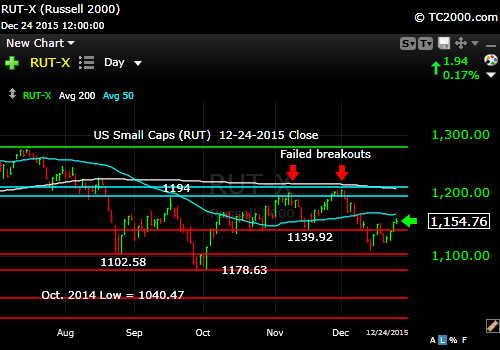
Small caps still weak, but about mid-range.
3. Gold is still lingering BELOW prior major support. Gold must overcome this weakness by breaking out above the 103.43 support level with conviction. It could evolve into a great trade, but there have already been false attempts at breakouts. Remember that with the Federal Reserve monetary policy of hiking rates into 2016, the issue becomes more DEFLATION, not inflation. Gold is an inflation hedge, but can also become a panic hedge along with U.S. dollar strength, when the world starts to look risky to investors.
Gold ETF (GLD; click to enlarge):

Gold still below important support.
4. U.S. 10 Year Treasury Note Yield (click chart to enlarge; TNX,TYX,TLT,TBF): Rates are about mid-range and are not likely to rise much while the Federal Reserve is raising rates, unless inflation does actually show up. This 2.489% to 1.905% range could hold for some time, until the Fed reverses their rate hike course. The market believes at the moment that they’ll raise four times in 2016, but they could moderate that pace if the current weak “recovery” in the U.S. does not go as planned.

10 Year Yield is about mid-range in the triangle shown on the chart.
Be sure to visit the website at: Sun and Storm Investing™
Standard Disclaimer: It’s your money and your decision as to how to invest it.
I thank Worden Brothers for the charting system I use to post these charts. If you want to know more about the charting system I use every day, go to my “Other Resources” page here: Other Resources It makes it much easier to follow along with me if you can see the charts and manipulate them on your own computer. It’s a great investment to have an excellent charting system. Check it out with a free trial at the link above.
Note that the newsletter is now CLOSED to new subscriptions: Join the Wait List to Join the Newsletter as a Loyal Subscriber, Opening again for the January 3rd issue. If you join and don’t read the newsletter, you will be deleted. Why? I don’t publish to non-readers as other newsletters do. I surround myself with committed people who value what we are doing. Stay tuned here in the meantime and follow all the action via the Twitter® and StockTwits® links above.
Copyright © 2015 By Wall Street Sun and Storm Report, LLC All rights reserved.
