
A Market Timing Report based on the 12-18-2015 Close, published Sunday December 20th, 2015
I deliver focused comments on the markets. These are supplemented with “Tweets/StockTwits” (see links below).
1. SP500 Index: It looked as though the prior VIX high might hold by the close on Friday, but it did NOT. Review my “key numbers” HERE if you have not yet done so. We are just above my “VIX number” with the VIX close of 20.70. That means that the market can go either way on Monday, although the bias is down. Perhaps it will fall back to the earlier Dec. low and then rise or if the VIX accelerates, the SP500 may descend to the August low or beyond before bouncing.
The way the market behaves at support levels is a key that I look at to decide whether to invest more cash. Based on prior exposure levels earlier this year, I currently am at 73% of the highest exposure level (135% using excess cash/bond assets NOT margin) and 99% of my usual maximum exposure via both U.S. and foreign stocks (see social media posts for the split, which I generally try to update after each trade). The big “catch” I spoke of in October was seeing the VIX stay firmly below 20, and it now has NOT. Risk has now risen following the first rate hike by the Fed since 2006. Next support is 1993.26 and if that does not hold, we could crash to the August low in 1-2 days. It only took 2 days to reach it last time.
Some claim “it doesn’t matter that they raised rates.” It could, because we truly have never seen the Fed raise into a slowing economy since 1968.
SP500 Index Chart (click to enlarge; SPX, SPY):
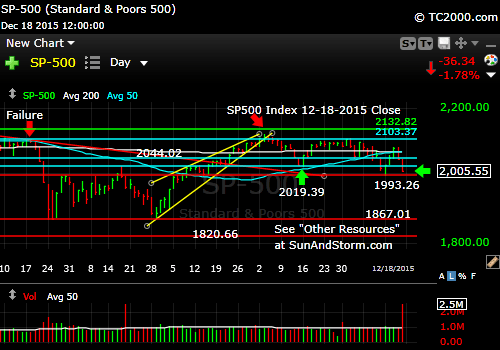
SP500 now in danger of a bigger breakdown, while many were expecting a “Santa Rally.” Must turn around Monday.
Keep up to date at Twitter and StockTwits: See my messages on Twitter® Follow Me on Twitter®. Follow Me on StockTwits®).
2. U.S. Small caps are still in descent and have been leading the large caps down. Note how close the small caps are vs. the August low as compared with U.S. large caps (SP500).
Russell 2000 U.S. Small Cap Index (RUT, IWM; click to enlarge):

Small caps still weak and heading lower.
3. Gold is still hanging out BELOW prior major support, but did regain a bit of ground. Since the Fed is actually now contributing toward DEFLATION, gold won’t behave well until they get “hiking fever” out of their system. The Fed forecasts supposedly imply four separate rate hikes in 2016, but the Fed says it is data dependent. 😉 I smile because the data they are dependent upon depends on what policy they want to advocate. The Federal Reserve has “lost it” at this point by raising rates into a worldwide economic slowdown. We are holding only long term profits in gold and have no trading position. We cashed out of our principle position in gold at 1370ish.
Gold ETF (GLD; click to enlarge):

Gold still below major support, but bounced back from a brand new dive at week’s end.
4. U.S. 10 Year Treasury Note Yield (click chart to enlarge; TNX,TYX,TLT,TBF): Last week I said the fall of rates ahead of a rate hike was ominious as it “may in part also represent a ‘flight to safety’ from stocks.” I was right. Hold onto your bonds and Treasuries. The Fed is ADDING to deflation as explained in my messages this week. That means rates must go lower eventually despite the Fed’s misguided understanding of this recovery.
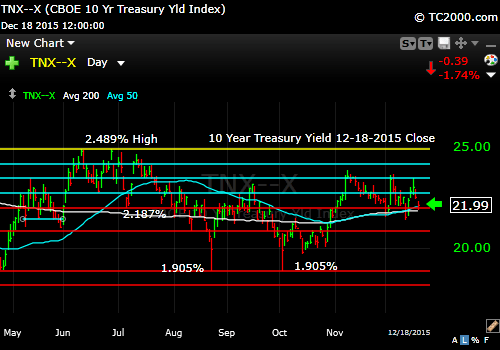
Economy is NOT recovering as we’re in a manufacturing slowdown and even services were slowing in the Friday report.
Be sure to visit the website at: Sun and Storm Investing™
Standard Disclaimer: It’s your money and your decision as to how to invest it.
I thank Worden Brothers for the charting system I use to post these charts. If you want to know more about the charting system I use every day, go to my “Other Resources” page here: Other Resources It makes it much easier to follow along with me if you can see the charts and manipulate them on your own computer. It’s a great investment to have an excellent charting system. Check it out with a free trial at the link above.
Note that the newsletter is now CLOSED to new subscriptions: Join the Wait List to Join the Newsletter as a Loyal Subscriber, Opening again for the January 3rd issue. If you join and don’t read the newsletter, you will be deleted. Why? I don’t publish to non-readers as other newsletters do. I surround myself with committed people who value what we are doing. Stay tuned here in the meantime and follow all the action via the Twitter® and StockTwits® links above.
Copyright © 2015 By Wall Street Sun and Storm Report, LLC All rights reserved.
