A Market Timing Report based on the 1-29-2016 Close, published Sunday January 31st, 2016
I deliver focused comments on the markets. These are supplemented with “Tweets/StockTwits” (see links below).
Please first review the Fed FOMC statment update: HERE
1. SP500 Index: My apologies for not being able to publish the extra post last week, but as it turns out, the delay was helpful, because the market is bouncing. What I will share today, if you study it carefully, will convince you that what started in January may have been just the first of many market shocks to come. For now, the market is rallying again…
I believe what has happened in January is much more significant than is generally appreciated in the press. We’ve had the first of what I am now coining the term for (if it has not been taken, but I’ve never heard it before), which is a “Sentiment Shock!” Specifically this new term “Sentiment Shock” refers to the AAII.com data on individual investor sentiment. It occurs when there are two OR more weeks in a row of extremely negative sentiment, which I define as being equal to or greater than a -25% Bull%-Bear% Spread (simply the difference between Bull% minus Bear% for that week) for two or more weeks IN A ROW. In other words, the spread has to be MINUS 25% or worse in the Bearish direction
DEFINITION my new term “SENTIMENT SHOCK!”
= %Bulls – %Bears ≥ MINUS 25% (i.e., -25% or more Bearish) for two reports or more in a row.
Note that I changed the dates of the AAII.com data to match the end date for voting by investors of the given survey. (skip this paragraph if you don’t care about the details) The data is collected over an entire week ending on the dates I give below. AAII reports them with the date of the Thursday after the Weds. evening data collection/voting deadline. I prefer to match up the trading day which matches the end point for data collection, which is Weds. night.
“Sentiment Shocks” happen to be rare and reserved for special times. I was amazed to find that the last one I could find BEFORE the 2007 top was in 1992 (10-15-92 to 10-22-92: a 2 wk sentiment shock). It lasted 2 weeks from 10-15-92 to 10-22-92. In other words, this system would have failed completely during the 2000 tech bubble crash.
Then why is it important now? What I think is significant is that we’ve just had a “Sentiment Shock” that span the reporting periods of 1-13-2016 and 1-20-2016. This week ending 1-27-2016, the “SURVEY SAID! (I love to type that in honor of Richard Dawson of the original Family Feud! lol) the data went back to a more benign negative spread of %Bulls – %Bears of -10.2%, so the January Sentiment Shock is “over.” That does not preclude another one occurring soon (weeks away?), as the data show from the 2007 sell-off shown below in both chart and text:
Keep up to date at Twitter and StockTwits: See my messages on Twitter® Follow Me on Twitter®. Follow Me on StockTwits®).
SP500 Index Chart (click chart to enlarge; SPX, SPY): The raw sentiment shock data is shown below the chart. The red arrows are aligned with the first date the particular sentiment shock began. Note that there were SIX “Sentiment Shocks” from 2007-2009, and we’ve just had our first since then!
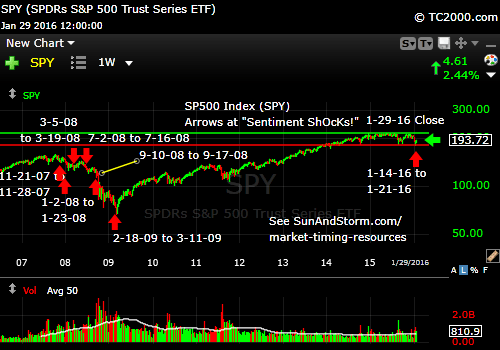
Investor “Sentiment Shock” History of the Market since 2007.
11-21-07 to 11-28-07: 2 wk shock
then 35 days (days, not trading days) later…
1-2-08 to 1-23-08: 4 wk shock.
then 42 days later…
3-5-08 to 3-19-08: 2 wk shock.
then 105 days later…
7-2-08 to 7-16-08: 3 wk shock.
then 56 days later…
9-10-08 to 9-17-08: 2 wk shock.
then 154 days later…
2-18-09 to 3-11-09: 4 wk shock. That was the market low in 2009
and NOW for the latest “Sentiment Shock” 2,499 days later…
Amazing, but it’s been that long! 6.85 Years!
THE LATEST SENTIMENT SHOCK: 1-13-2016 to 1-20-2016: 2 wk shock
Why didn’t the market set off a sentiment shock back in August? I believe investors were just starting to see the downturn in the economy represented by falling industrial production in Summer 2015. Plus, by Weds. after the Monday Flash Crash of Aug. 24th, 2015, the market closed at 1940.51, almost exactly where we closed this past Friday at 1940.24. So sentiment had likely recovered already. Remember that a “Sentiment Shock” is significant, because it has to by definition last TWO reporting periods, and not just be a one week wonder.
What do I expect? I expect that if there is a failure of the economic system under way, that there will be another sentiment shock within a matter of weeks (5-6) to a few months at most. That will signal us to reduce our exposure further to the market until we see much lower prices or a solid bottoming formation created over many months, not days or weeks, along with signs of economic repair.
Once a system starts shaking, it may continue to shake until it nearly falls apart, unless something is done to stabilize it. I believe the Fed will try to stabilize the markets and that is why there could be a delay before more selling starts up in earnest again, but I am doubtful that the Fed will be able to save the economy this time around from slowing into a recession of some magnitude. The coming recession, if it occurs, and some say it is inevitable now, does not have to be long and deep unless policy makers are fighting each other in Washington under a deadlocked Congress. Hmmmm that’s the new culture in Washington, so don’t look for help there. Obviously the prior QE program was not a permanent fix for the economy or it would not have started slowing again last summer. The economy ebbs and flows in cycles and these need to be allowed to some extent or it creates problems. Some say QE did very little to help.
For now I expect a further stock market rally, though no one can guarantee that including me! The easy money is now coming from China, the ECB, and Japan, which just adopted negative interest rates. The move by Japan was linked to the strong rally on Friday. If negative rates don’t force them to invest in stocks, nothing will! 😉
One question is whether the Fed will take back the 0.25% hike or not. It was clearly a policy error. I am not defending their policy, but rather just saying it was inconsistent with what they had done.
I am an advocate of free markets with some help on the fiscal and monetary sides during big downturns, but what the Fed and Congress did in the 2007-2009 Great Recession was to help lousy businesses survive. That creates inefficiencies in the markets, because the markets don’t get to decide who survives. They should in most cases.
Now we are paying for that error. Was some of the help useful? Perhaps, but the government is now helping auto companies hand out money to “bad-bet buyers” JUST as they did in 2007. It’s cars this time, not houses. They WILL NOT LEARN! And it’s oil too that is in trouble with over-leverage against falling energy prices. I suspect you’ll see them step in to stabilize bad oil loans too if they feel they must.
I don’t believe QE4 would help, but the Federal Reserve may use that tool to attempt to devalue the dollar. China has been much more obvious than the EU by directly devaluing their currency, the yuan. Trump, whether right or wrong about a variety of other issues, is right that China is cheating our companies in unfair price competition through devaluation.
The U.S. used it’s own tricks and can be criticized as well. It’s a currency war, some obvious, the rest less obvious and hidden behind statements like “The Fed does not speak about the U.S. dollar as that is Treasury’s job.” Baloney!
That is a summary of the doomy/gloomy viewpoint, so where’s the sunshine. The sunshine is in the top chart of my update this week. Click: HERE to view it! The market as I explained this week is now “UN-broken.”
“UN-broken” does not mean the stock market (SP500 Index OR Russell 3000) is healed and off to the races. It means the Bulls have an argument and a chance for a further rally. This low is special because rates are also testing their lows. (see last chart)
So we will ride this rally, and look for a spot to decrease our exposure closer to what looks like the top of a range. That is a day to day, week to week assessment, so stay tuned via Twitter/StockTwits (links above the 1st chart toward top). (You don’t have to SEND messages to read them! If you like, create a locked account and never tweet, but if you follow me, my messages will appear on your Twitter/StockTwits stream.)
We have to assume the selling is not over until there is technical repair of the damage done to the markets. Some repair has occurred as my “UN-broken” statement said, which is why we’re invested in this rally. Is there danger of a quick breakdown? Sure. That’s the nature of the beast. But I state my exposure level on Twitter to keep this real. Risk is real for me too. The market is tested every day. But we do not buy high, sell low here.
Speaking of low…the small caps will have to survive a nearby test…while coming off a deep dive…
2. U.S. Small caps are now very close to the 1040 test. If they fail there, don’t expect large caps to save the day for long. A repair of that 1040 breach would be significant for the market as a whole. (One day over does not = “repaired”)
Russell 2000 U.S. Small Cap Index (click chart to enlarge; RUT, IWM):

Small caps are facing immediate overhead resistance at 1040ish.
3. Gold is rallying probably in part based on the expectation that the Fed will have to weaken the dollar indirectly through their policy decisions. I think the dollar will be managed lower and that is the reason to own gold. If there is financial panic, and only then, will you see the US dollar rally with gold in a big way.
Gold looks like it has a bit farther to go. Preserve profits if you have them from a recent entry! Beyond a core “Currency Insurance” gold position, it’s important to trade rather than hold additional gold. If you have none, buy some and use a stop loss on any new positions. Of course, decide on your own, but gold is part of a diversified portfolio in my opinion, especially if you can get it at reasonable prices.
The 103.43 reversal was an important reversal for GLD. If that holds, gold is fine. If we fall back below there, the Bear could start all over again. We could be seeing a NEW Bull Market in Gold, but it’s unproven. This is an investable low is all we know.
Some criticize me occasionally for not being clear. How’s this: BUY SOME DAMN GOLD if you own none! 😉 Sell it if we break 103.43 on a close.
And don’t call me if it closes below 103.43 and then comes back and rallies hard. This is a day to day process. We’ll buy it back again if it does that, but perhaps a bit higher.
Gold ETF (click chart to enlarge; GLD):

Gold rally continues.
4. U.S. 10 Year Treasury Note Yield (click chart to enlarge; TNX,TYX,TLT,TBF): We are trading the range, so I’m nearly all out of TLT at this point. That may be wrong obviously. If it breaks to higher highs, I’ll have to join in again. There could be a panic into US Treasuries. A fall below that 1.905% base would be a further danger sign about the U.S. economy. Low rates help the economy, but could indicate an upcoming recession as discussed earlier.
See you on Twitter/StockTwits this week! Feel free to comment, retweet etc.
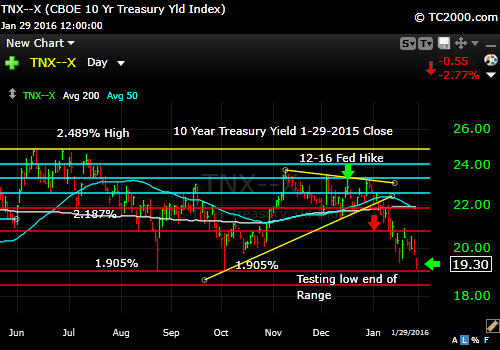
10 Year Treasury Yield testing a key low.
Stay with me throughout the week for the LATEST via the links to Twitter/StockTwits above.
Be sure to visit the website at: Sun and Storm Investing™
Standard Disclaimer: It’s your money and your decision as to how to invest it.
I thank Worden Brothers for the charting system I use to post these charts. If you want to know more about the charting system I use every day, go to my “Other Resources” page here: Other Resources It makes it much easier to follow along with me if you can see the charts and manipulate them on your own computer. It’s a great investment to have an excellent charting system. Check it out with a free trial at the link above.
Note that the newsletter is now CLOSED to new subscriptions: Join the Wait List to Join the Newsletter as a Loyal Subscriber, Opening again for the April 3rd issue. If you join and don’t read the newsletter, you will be deleted. Why? I don’t publish to non-readers as other newsletters do. I surround myself with committed people who value what we are doing. Stay tuned here in the meantime and follow all the action via the Twitter® and StockTwits® links above.
Copyright © 2016 By Wall Street Sun and Storm Report, LLC All rights reserved.
