A Market Timing Report based on the 2-05-2016 Close, published Sunday February 7th, 2016
I deliver focused comments on the markets. These are supplemented with “Tweets/StockTwits” (see links below).
1. SP500 Index: Last week I coined a term: “SENTIMENT SHOCK,” a term that could define the next few months in the market and the occurrence of a Bear market in the SP500 Index (read the report: HERE) The first one just occurred recently between the two AAII.com Individual Investor Sentiment reports from 1-13-2016 to 1-20-2016. We are now waiting for the second one.
I had a Twitter interaction with Jim Cramer this week about the definition of a Bear Market HERE. I have no disagreement with what he said. His feeling is that this is a “rolling Bear market” in that various sectors and indices are rolling over into Bears one after another. I’ve noted small caps and biotech are in Bear markets already, while the SP500 Index isn’t. My point was simply to say it is important to define which markets are in Bear states and which are not. Why? Because the investing and trading strategy is completely different in a Bull vs. Bear Market.
In a Bull market you just buy every dip and ride the market up. In a Bear market, if you buy a dip you must sell the bounce to make any money as we’ve been doing; otherwise, you are simply racking up more and more losses as new lows are set. If you short stocks, then during a Bear you short every rally and build your short position on the way down OR you can short the rallies and cover every dip, rinse and repeat. The latter is safer because rallies during Bear markets can be very strong.
The fact that the market pulled back strongly on Friday COULD result in the second “Sentiment Shock” IF it is combined with a further sell-off early this week. I don’t run this market, so I cannot tell you if the selling has a chance to stop at the now obvious support range of 1867-1871.91. If it fails there, the further damage to the market could be extensive. The market COULD retest the October low and then resume a bounce, but I would not be overly optimistic if the 1867-1872 level does not hold. For now, we’re in this for a bounce, and I will change my view when the market does. We observe and respond to the market; we don’t argue with the market. I will drop my exposure level if the market breaks down again (continued below the chart…).
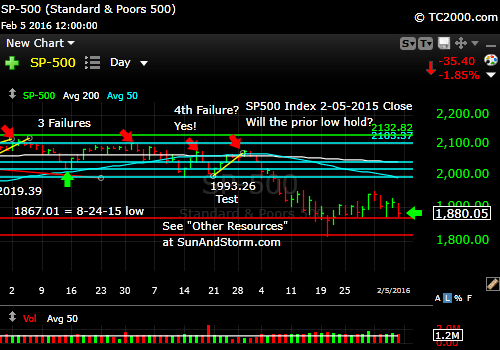
The rally is weakened.
The fact that the small caps failed to climb above 1040 this week represents an important failure, but let’s review the small cap chart now…
Keep up to date at Twitter and StockTwits: See my messages on Twitter® Follow Me on Twitter®. Follow Me on StockTwits®).
2. U.S. Small caps failed to scale 1040, but did not make a brand new low. I would look to the SP500 Index to decide if a further bounce will continue, but I would also expect that any move of small caps below 983.98 must be quickly reversed to avoid a much greater market failure.
Russell 2000 U.S. Small Cap Index (click chart to enlarge; RUT, IWM):

Small caps are in a Bear market.
3. Gold is continuing it’s rally and if you heeded my advice to “Buy some damn gold” if you owned none, then you have profited. Preserve at least part of those profits. Gold profits can be fleeting and continued progress for gold will be directly related to how bad the economy gets and therefore how much the Federal Reserve feels it must indirectly degrade the U.S. dollar’s strength. That’s how they can be sure we can eventually pay our bills -through inflation. They don’t like to talk about the dollar, but they directly influence the dollar despite their protestations. If they raise rates, they will drive the dollar UP and pressure gold. I don’t expect they’ll be able to do that at their next meeting, but the Fed does not always do the right thing. Raising rates in a deflationary environment around the world was the wrong thing as I explained last week.
Buy the dips rather than chase the rallies if you are not yet invested in gold, but set a mental stop and cut your losses should the trend change. Go back to the gold charts in 2001-2004 to see how erratically the gold price can move during a large Bullish overall move. There are a lot of givebacks of each step up, some of at least 50% of the given step up.
Gold ETF (click chart to enlarge; GLD):

Gold rally continues. Preserve profits, but allow some wiggle room.
4. U.S. 10 Year Treasury Note Yield (click chart to enlarge; TNX,TYX,TLT,TBF): I said last week: “A fall below that 1.905% base would be a further danger sign about the U.S. economy. Low rates help the economy, but could indicate an upcoming recession…” Rates in fact did fall below 1.905% this week and could fall further. The Fed may have to make some bolder statements to drive a fall to the prior low of 1.651%. (continued below chart).

Rates fall below the prior range.
Eventually rate will rise, because the economy will recover, but that could take some time. I still expect rates to remain fairly low for several years unless the current policies lead to stagflation where there is both slow growth and inflation. In that case, we could see rising rates, falling stocks in real inflation-adjusted terms (stocks can rise and the gains be eaten up by inflation in real terms whereas the stock market is higher numerically), and rising gold prices.
Stay with me throughout the week for the LATEST via the links to Twitter/StockTwits above. Feel free to comment, retweet etc.
Be sure to visit the website at: Sun and Storm Investing™
Standard Disclaimer: It’s your money and your decision as to how to invest it.
I thank Worden Brothers for the charting system I use to post these charts. If you want to know more about the charting system I use every day, go to my “Other Resources” page here: Other Resources It makes it much easier to follow along with me if you can see the charts and manipulate them on your own computer. It’s a great investment to have an excellent charting system. Check it out with a free trial at the link above.
Note that the newsletter is now CLOSED to new subscriptions: Join the Wait List to Join the Newsletter as a Loyal Subscriber, Opening again for the April 3rd issue. If you join and don’t read the newsletter, you will be deleted. Why? I don’t publish to non-readers as other newsletters do. I surround myself with committed people who value what we are doing. Stay tuned here in the meantime and follow all the action via the Twitter® and StockTwits® links above.
Copyright © 2016 By Wall Street Sun and Storm Report, LLC All rights reserved.
