
A Market Timing Report based on the 3-24-2016 Close, published Sunday March 27th, 2016
I deliver focused comments on the markets. These are supplemented with “Tweets/StockTwits” (see links below).
1. SP500 Index: The Atlanta Fed lowered their GDP estimate for the first quarter to 1.4% from 2.3% shown on their Excel file and from 2.6% if you read their graph HERE. Makes you wonder about their methodology doesn’t it? I believe the market will have to adjust lower, even if it does not crash from these levels. How do we go higher on a “growth slowing” basis? If we make even more money on our existing long exposure, it’s not likely going to be warranted by the earnings season just around the corner in early April.
SP500 Large Cap Index (click chart to enlarge; SPX, SPY):

Going down? Chart-wise it could just be another pullback on the way higher. Earnings-wise, it could be the end of a run.
Sentiment is slightly more Bullish this week among individual investors (AAII.com), though definitely not at an extreme, with the Bull minus Bear spread at 10.1% this week (Bulls 33.8% and Bears 23.7% with Neutrals a Bullish 42.5%). See comments from last week on why that’s Bullish.
Please keep up to date at Twitter and StockTwits: See my messages on Twitter® Follow Me on Twitter®. Follow Me on StockTwits®).
2. U.S. Small caps are STILL both above the 1040.47 level that for me defines a Bear market transition point, but now back below 1080.61. Weakness is rising. AND AGAIN: My working hypothesis is that the economic slowing process has not yet reversed and that a retest of the prior lows (or worse) will occur by the end of June.
Russell 2000 U.S. Small Cap Index (click chart to enlarge; RUT, IWM):
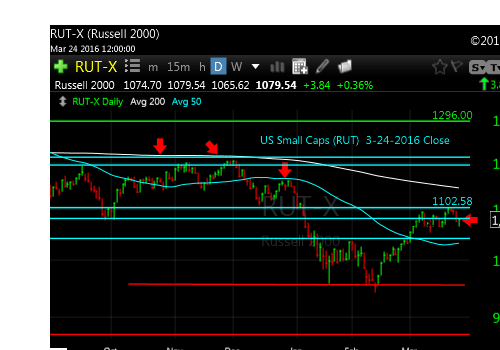
Small caps have now given up two support levels. More downside to go?
3. Gold: Last week I told you to “follow the dollar… The risk now is that the US dollar actually starts to rise as Draghi and other currency warriors print their own currencies. “Dollar up” would cause gold to pause at best or fall for a while until the Euro, yen and yuan lose enough value to satisfy those in the devaluation war.” In short, the dollar rallied off of support, but as I said, the rest of the world won’t stand for too much dollar strength and our Fed won’t either with our economy slowing. I’d say GLD has downside risk to at least 113.99 as a test of both the prior breakout conviction as well as the 50 day moving average for technical traders.
Gold ETF (click chart to enlarge the chart; GLD):
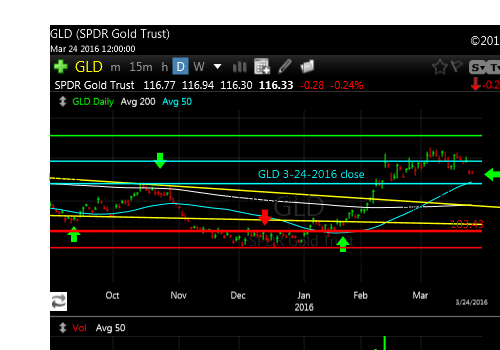
Gold slipping on US dollar strength as predicted. There’s a limit to this though as the Fed will act if needed to keep the dollar in a range.
4. U.S. 10 Year Treasury Note Yield (click chart to enlarge; TNX,TYX,TLT,TBF): Despite the dollar strength that drove the 10 Year yield up to just below the 1.905% resistance point, as said above, there is a limit to how much dollar strength will occur in a backdrop of a slowing US economy.
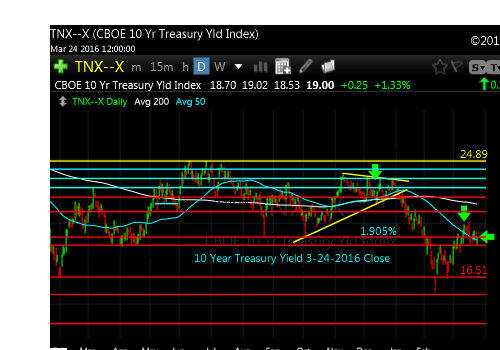
Close was at 1.900% just below that key 1.905% level.
Stay with me throughout the week for the LATEST via the links to Twitter/StockTwits above. Feel free to comment, retweet etc. to spread the word.
Be sure to visit the website for more general investing knowledge at:
Standard Disclaimer: It’s your money and your decision as to how to invest it.
I thank Worden Brothers for the charting system I use to post these charts. If you want to know more about the charting system I use every day, go to my “Other Resources” page here: Other Resources It makes it much easier to follow along with me if you can see the charts and manipulate them on your own computer. It’s a great investment to have an excellent charting system. Check it out with a free trial at the link above.
Note that the newsletter is now CLOSED to new subscriptions: Join the Wait List to Join the Newsletter as a Loyal Subscriber, Opening again for the April 3rd issue. If you join and don’t read the newsletter, you will be deleted. Why? I don’t publish to non-readers as other newsletters do. I surround myself with committed people who value what we are doing. Stay tuned here in the meantime and follow all the action via the Twitter® and StockTwits® links above.
Copyright © 2016 By Wall Street Sun and Storm Report, LLC All rights reserved.
