A Market Timing Report based on the 4-22-2016 Close, published Sunday April 24th, 2016
I deliver focused comments on the markets. These are supplemented with “Tweets/StockTwits” (see links below).
1. SP500 Index: We remain above the down trend line (in yellow), but there were some disappointing results and reactions for Alphabet (GOOGL), Microsoft (MSFT), Starbucks (SBUX), and VISA (V). U.S. interest rates were rising even in the midst of a worldwide slowdown as the U.S. is still considered the best market in a slowing world economy. Earnings may provide additional challenges to April returns which are often positive. The “Go Away In May” sellers may soon emerge.
The technical picture alone does not suggest this needs to be the end of the run, while the earnings and economic trends do suggest a period of digestion of gains is in order.
SP500 Large Cap Index (click chart to enlarge; SPX, SPY):

Survey Says! Sentiment rose a bit this week among individual investors (AAII.com) with the Bull minus Bear spread at +9.5% this week (Bulls 33.41% and Bears 23.92% with Neutrals a Bullish 42.67%; Neutral Scores > 40 are Bullish for markets rising 6 months out.). There is certainly no sentiment extreme from the perspective of the AAII data.
Please keep up to date at Twitter and StockTwits: See my messages on Twitter® Follow Me on Twitter®. Follow Me on StockTwits®).
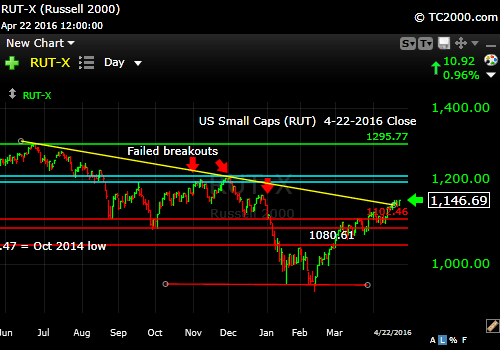
2. U.S. Small caps are STILL above the 1040.47 level that for me defines a Bear market transition point. Small caps have made progress above the yellow down trend line. This is remarkable given the lack of small cap GAAP earnings over the past 12 months. Is this just more hope that the Fed will save the day? They certainly won’t accomplish that through the lack of rate hikes.
Russell 2000 U.S. Small Cap Index (click chart to enlarge; RUT, IWM):
3. Gold: Gold is holding up, still under threat of a dollar that is due to rise. (see prior gold posts)
Gold ETF (click chart to enlarge the chart; GLD):

4. U.S. 10 Year Treasury Note Yield (TNX): Rates have bounced at a time that Germany is selling debt out 8 years at NEGATIVE RATES. Yes, you get to pay to have your money held for 8 years. What a deal! It is doubtful that U.S. interest rates will be able to climb much under these circumstances. At some level, the market may be seeing a rate hike as early as June. The CME Group predicts just a 36% chance of that at this point with the September risk rising to 47%. The Fed issues a statement on April 27th without a dog and pony show following the 2 pm ET release. A hike would be met by fireworks as it is unexpected.
U.S. 10 Year Treasury Note Yield (click chart to enlarge; TNX,TYX,TLT,TBF):

U.S. Rates rising a bit…despite negative rates elsewhere in the world.
Stay with me throughout the week for the LATEST via the links to Twitter/StockTwits above. Feel free to comment, retweet etc. to spread the word.
Be sure to visit the website for more general investing knowledge at:
Standard Disclaimer: It’s your money and your decision as to how to invest it.
I thank Worden Brothers for the charting system I use to post these charts. If you want to know more about the charting system I use every day, go to my “Other Resources” page here: Other Resources It makes it much easier to follow along with me if you can see the charts and manipulate them on your own computer. It’s a great investment to have an excellent charting system. Check it out with a free trial at the link above.
Note that the newsletter is now CLOSED to new subscriptions: Join the Wait List to Join the Newsletter as a Loyal Subscriber, Opening again for the July 3rd issue. If you join and don’t read the newsletter, you will be deleted. Why? I don’t publish to non-readers as other newsletters do. I surround myself with committed people who value what we are doing. Stay tuned here in the meantime and follow all the action via the Twitter® and StockTwits® links above.
Copyright © 2016 By Wall Street Sun and Storm Report, LLC All rights reserved.
