A Market Timing Report based on the 4-29-2016 Close, published Sunday May 1st, 2016
I deliver focused comments on the markets. These are supplemented with “Tweets/StockTwits” (see links below).
1. SP500 Index: The SP500 Index fell below the yellow down trend line I’ve been pointing out. I believe there will be more downside, perhaps to a test around the 50 day moving average at best (2032.31 currently) and a back-test to 1947.20 if the Bears gain company at the exits. If we go that low, we’ll reassess things.
SP500 Large Cap Index (click chart to enlarge; SPX, SPY):

Some Downside Action Starts.
Survey Says! Sentiment fell back to flat this week among individual investors (AAII.com) with the Bull minus Bear spread at +1.2% this past Wednesday (Bulls 27.37% and Bears 28.60% with Neutrals a Bullish 44.03%; Neutral Scores > 40 are Bullish for markets rising 6 months out.). There is STILL no sentiment extreme from the perspective of the AAII data.
Please keep up to date at Twitter and StockTwits: See my messages on Twitter® Follow Me on Twitter®. Follow Me on StockTwits®).
2. U.S. Small caps are STILL above the 1040.47 level that for me defines a Bear market transition point. Small caps remain BARELY above the yellow down trend line. I suspect they cannot hold up if the large caps continue a pullback. Beware of high beta stocks when volatility rises.
Russell 2000 U.S. Small Cap Index (click chart to enlarge; RUT, IWM):

Small caps still above the down trend line, but are vulnerable.
3. Gold: Gold has broken out despite the threat that we are nearing an important U.S. dollar low. (see prior gold posts) The increased volume on the upswing is a good sign for now. If the dollar reverses hard, watch out for your gold and gold stock profits. They could evaporate quickly. Only outright financial panic tends to drive the dollar and gold up together. The easiest course for gold would be to rise in the context of a dollar break of the prior lows.
Gold ETF (click chart to enlarge the chart; GLD):
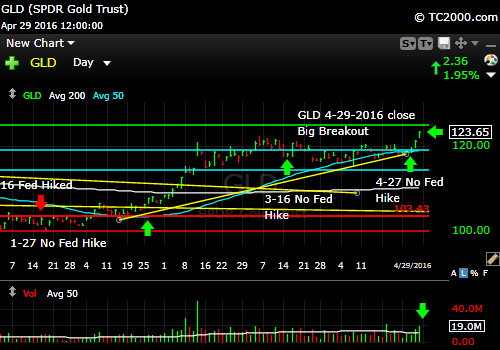
Gold breaks out despite the US dollar being at a low.
4. U.S. 10 Year Treasury Note Yield (TNX): Rates moved down after the Fed statement pointed out that growth had slowed. The market expects dovishness from the Fed in the face of a 0.5% GDP reading this last Thursday for Q1’s first estimate. Note the reversal from above to below the 1.90% level in the chart below.
U.S. 10 Year Treasury Note Yield (click chart to enlarge; TNX,TYX,TLT,TBF):

Decline in rates resumes post-Fed.
Stay with me throughout the week for the LATEST via the links to Twitter/StockTwits above. Feel free to comment, retweet etc. to spread the word.
Be sure to visit the website for more general investing knowledge at:
Standard Disclaimer: It’s your money and your decision as to how to invest it.
I thank Worden Brothers for the charting system I use to post these charts. If you want to know more about the charting system I use every day, go to my “Other Resources” page here: Other Resources It makes it much easier to follow along with me if you can see the charts and manipulate them on your own computer. It’s a great investment to have an excellent charting system. Check it out with a free trial at the link above.
Note that the newsletter is now CLOSED to new subscriptions: Join the Wait List to Join the Newsletter as a Loyal Subscriber, Opening again for the July 3rd issue. If you join and don’t read the newsletter, you will be deleted. Why? I don’t publish to non-readers as other newsletters do. I surround myself with committed people who value what we are doing. Stay tuned here in the meantime and follow all the action via the Twitter® and StockTwits® links above.
Copyright © 2016 By Wall Street Sun and Storm Report, LLC All rights reserved.
