A Market Timing Report based on the 6-02-2017 Close, published Sunday, June 4, 2017
I deliver focused comments on market timing once or twice a week. These are supplemented with daily “Tweets/StockTwits” (see links below).
1. SP500 Index: We will review sentiment in just a bit, but first let’s review where the markets are…
The large cap U.S. SP500 stock index hit an all time high, and managed to drag the small caps up with it to turn the “Stock Signal” back to ON, but now a new high is needed in the small caps. As I show below in the small cap market timing chart, they were repelled from the 3-01-2017 high.
The economy continues to be healthy with ISM Manufacturing Index coming in at 54.9 with the prior reading at 54.8. Click on the 6-02-12017 report HERE and you’ll see the rise in manufacturing activity from the January to February 2016 lows.
In contrast, employment came in weak at 138,000 new jobs created in the month of May with expectations at 185,000. Some pointed out that employment was up year over year by a small fraction, but if you look at the chart on the prior link at Bloomberg, you can see there is a trend of lower highs since the Nov. 2014 high. There are ALSO two higher lows that occurred in May 2016 and March 2017. Making a lower low than the March 2017 low would be Bearish. Exceeding Feb. 2017 employment would be Bullish. The employment results reflect an economy that is recovering slowly, but is chugging along. The market is still expecting eventual progress on the Trump agenda, especially tax reform and infrastructure spending, and there will be a penalty if it does not.
Keep up-to-date during the week at Twitter and StockTwits (links below), where a combined 27,492 people are joining in…
Twitter® Follow Me on Twitter®. Follow Me on StockTwits®.
SP500 Large Cap Index (click chart to enlarge; SPX, SPY):

SP500 Index at ALL TIME HIGH.
Survey Says! Sentiment of individual investors (AAII.com) showed a Bull minus Bear percentage spread of -4.62% vs last week’s +2.86%. This is astounding! This is not the way Bull markets end as I love to point out.
The time we will be cutting back our market timing exposure levels in the U.S. is when sentiment is peaking at extreme highs. Until then, the Bull is still apt to be strong. Of course, I’ve pointed out that the small caps will need to participate if the market is to have serious gains from here. Large caps can continue to rise alone, but only for so long.
The small cap based “Stock Signal” is ON, but there needs to be follow through to new highs. By the way, the Neutrals above 40% is one of the most predictive findings of AAII data per their studies. The likelihood is high that the SP500 Index will be higher 6 months from now, given that > 40% Neutral reading.
| Thurs. 12 am close to poll | Bulls 26.92% | Neutrals 41.54% | Bears 31.54% |
2. U.S. Small Caps: Small caps have been discussed and the chart below shows the next market timing “goal line.” Notice how it pulled off of the green line shown?
Russell 2000 U.S. Small Cap Index (click chart to enlarge; IWM, RUT):
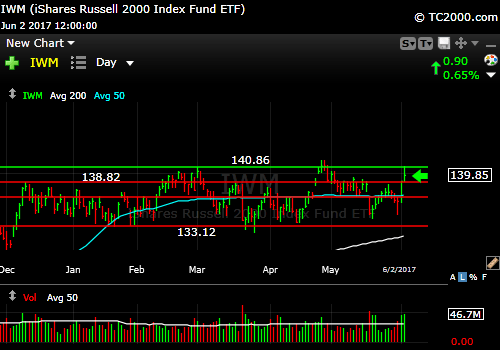
Need an all time high soon.
3. Gold: Gold is still bouncing as rates plunge below my market timing trigger. Gold above the trigger would “be OK” if inflation were high along with economic growth, but it’s not. Remember that high inflation degrades real returns of all interest/earnings yield bearing assets. The other way gold “works” is when real rates are negative because growth is too slow or falling to or below zero. In that environment, stocks fall and the Fed has to lower rates to goose the economy back to life.
The PCE inflation indicator that Federal Reserve Chair Yellen likes is still slightly below target at 1.5% without food and energy that she considers volatile (with food and energy the number is 1.7%), still below the prior two months and falling since February as shown on the BEA site. Gold does NOT do well in times of great prosperity because there are so many alternatives to making nothing on holding gold that has no earnings or dividends. The rise of gold through market timing resistance this week (see chart below), is a negative sign for the thesis of rising rates with a robust continuation of the economic recovery. AND YET, the economy IS improving slowly as discussed earlier, and we’ll follow the results, NOT the speculation.
Gold ETF (click chart to enlarge the chart; GLD):

Gold rally continues as rates FALL.
4. U.S. 10 Year Treasury Note Yield (TNX): I told you last week that below the orange line in the market timing chart below, the “Trump Rally” comes back into question. The “Interest Rate Signal” is back to OFF (says further robust economic recovery is unlikely).
We should not be seeing falling rates if inflation is a concern. In fact, the 10 Year Treasury rate has fallen since the Fed raised rates twice, in December and again in March. Despite the fall in the 10 Year Treasury Yield shown in the market timing chart below, the Federal Reserve is widely expected to raise rates another 0.25% to a target range of 1.00-1.25% on June 14 at the end of their FOMC meeting that starts on the 13th. This could drive longer term rates down even further. This is not what an economic recovery is supposed to look like.
MY SIGNAL SUMMARY for a Further U.S. Stock Market Rally is:
Stock Signal ON, Gold signal ON, Rate Signal OFF.
Once again this week, these signals are close to their switch points. If 1. Small caps cannot make a brand new high, 2. Gold breaks up through the trigger point and 3. Rates continue to drop, the market message will be that little is expected from the economy or from Trump policy changes.
U.S. 10 Year Treasury Note Yield (click chart to enlarge; TNX, IEF, TYX,TLT,TBF):

Rate trigger switched back to OFF.
Thank you for reading. Would you please leave your comments below where it says “Leave a Reply”… or feel free to ask a question… Pay it forward too by sending the link to MarketTiming.Blog to a relative or friend. Thank you.
Note: My monthly newsletter is now CLOSED to new subscriptions until late this year. I’ll let you know here if and when it reopens.
Be sure to visit the website for more general investing knowledge at:
Standard Disclaimer: It’s your money and your decision as to how to invest it.
I thank Worden Brothers for the charting system I use to post these charts. If you want to know more about the charting system I use every day, go to my “Other Resources” page here: Other Resources It makes it much easier to follow along with me if you can see the charts and manipulate them on your own computer. It’s a great investment to have an excellent charting system. Check it out with a free trial at the link above.
Copyright © 2017 By Wall Street Sun and Storm Report, LLC All rights reserved.
