A Market Timing Report based on the 03-08-2019 Close, published Saturday, March 9th, 2019…
I deliver focused comments on market timing once a week. These are supplemented with daily “Tweets/StockTwits” (see links below) and comments in the “markettiming” room on StockTwits.
1. SP500 Index Market Timing (S&P 500 Index®; SPY, SPX):
As I’ve explained in my “New Rules” (Oct. 26, 2018 post), we’ve been in a Mini Bear Market, which occurs during slowdowns that do not lead into a deep recession. That does not mean the drawdowns cannot be sizeable as investors learned in December, but the question is, “Are investors in for yet another ride down the hill as earnings slide around the world?”
This week, earnings predictions for 2019 are AGAIN worse (for ex., Q1 2019 earnings projections have weakened EVERY week for the past month!), and revenue projections slipped as well. These data are from FactSet, and the full FactSet PDF report will open HERE, and this is their site.
I updated the matrix of numbers shown over the past several weeks. These are the SP500 Index Earnings and Revenue growth (or lack thereof) numbers predicted as of the Feb. 2nd vs. the Feb. 15th vs. the Feb. 22nd vs. the Mar. 1st vs, the Mar.8th close by FactSet, from left to right…
“For Q1 2019, analysts are projecting a decline in earnings of -0.8% -> -2.2% -> -2.7% -> -3.2% -> -3.4% and revenue growth of 5.7% -> 5.3% -> 5.2% -> 5.2% -> 4.9% .
For Q2 2019, analysts are projecting earnings growth of 1.6% -> 1.0% -> 0.7% -> 0.3% -> 0.2% and revenue growth of 5.1% -> 4.7% -> 4.7% -> 4.8% -> 4.5%.
For Q3 2019, analysts are projecting earnings growth of 2.7% -> 2.4% -> 2.2% -> 1.9% -> 1.7% and revenue growth of 4.9% -> 4.5% -> 4.5% -> 4.6% -> 4.5%.
For Q4 2019, analysts are projecting earnings growth of 9.9% -> 4.8% -> 4.5% ->4.1% -> 3.9% and revenue growth of 6.0% -> 4.9% ->4.9% -> 5.1% -> 5.0%.
FactSet says (showing last week and this week for this data) …“For CY 2019, analysts are projecting earnings growth of 4.1% -> 3.9% and revenue growth of 5.1% ->5.0%.”
That earnings growth number for 2019 cited does NOT match the quarterly data above it. I did the math. I took the SP500 Index earnings for every quarter in 2018 and calculated the year/year values for each quarter, added them up, and divided 2019 total E by 2018 total E. The answer is earnings growth of 0.694%! Analysts who believe the earnings growth for the SP500 will be 3.9% for the year are delusional according to the analysts who came up with the data set in the prior paragraph.
Where will the greatest strength be in earnings growth for Q1? Factset says only 4 of 11 sectors will show earnings growth with the highest growth for Gas Utilities and Multi-Utilities and second place goes to Healthcare Providers and Services. Pharma by comparison will show an earnings contraction, which is why I warned you last week to check the earnings and revenue estimate projections week by week at least to see if your companies are among those that will be hit by further earnings growth slowing (or absolute slowing, meaning NEGATIVE Earnings growth).
The weakest sectors are not what you may expect. Energy, materials and Tech will be the worst companies in terms of earnings contraction (negative growth) and within Tech, Apple and Micron will be the worst. Read the entire PDF at the link above.
I warned you last week that the earnings issues that are fast approaching the market as we are only 3 weeks to the end of Q1 2019 should keep a lid on further upward progress for the U.S. stock market. If not, it tells you something completely different about the trajectory of the economy as far as the market sees it.
I gave you my strategy last week HERE. I bought a bit more equity exposure on the dip this week and added to my growing but still modest position in China. Realize however that I’m still only 20% or so exposed to emerging markets (EM) vs. my “usual max. exposure” for a Bull market in the corresponding market. This gives me an opportunity to add more exposure at lower or higher prices. I can hold a 20% of max. exp. position in China even if it goes down by 50% from here. My paper loss would be a small percentage of my total investable net worth (that means not including one’s home).
I don’t share my raw exposure numbers, because I know it would throw many investors off the path that is best for them. If you are 30, your equity exposure should be much higher than mine, probably 80-90% given you have a safety net that is liquid should something come up in your life. You can use my % of max. exposure numbers to adjust your exposure to taste – to your life and your personal needs.
Here’s a Brief Review of the Market Risks at Hand:
China Deal Risk: There is going to be a “big, beautiful deal” after all, we are told. No change in the assumed endpoint, but the negotiations seem to be slowing down.
Mueller Risk: We are told his report is imminent, so the risk of a surprise is imminent. To reiterate, I am an independent and for the purposes of investing, I could care less who the President is. I simply look at the risks to the markets should Trump be impeached OR removed, as a policy risk issue.
The risk itself is unchanged and could throw the markets into a decline if there is anything surprising in the report that would threaten a second Trump term. Even an impeachment would not be good for the markets as I’ve stated. Conviction by the Senate (an elusive hope so far for Dems) would be very Bearish for the market. None of that is assumed! There is to date no evidence of collusion, although I expect from what has been reported, the coast may be muddy, not clear, for Don Jr. and others close to Trump.
2020 Election Risk: Read my comments on this HERE. As I said, “Markets hate uncertainty, and the re-election of Trump is a great uncertainty.” The election of a liberal Democrat would be an intermediate term disaster for the U.S. markets.
Whether you like or hate Trump’s policies, and I do not like some of the aspects of his policies, particularly in terms of environmental harm, favoring the wealthy over the middle class in the tax cuts, and exploding the deficits and national debt, it is clear the financial system is fine with a moderate Democrat, but would not be fine with a socialist like Bernie Sanders.
I agree with certain of Bernie’s principles such as decent health care for all (you should not have to ration insulin vs. food for example!) , but how you get there is another matter. It matters a lot to the markets, whether you maintain enough profit for drug companies, so they will be incentivized to continue SUCCESSFULLY (as they have been!) to find cures for things like cancer.
I debated Bernie on Healthcare Reform while he was campaigning on a busy road in Vermont, when he first ran for the House in 1992. I was then on the faculty at the University of Vermont Medical School. We parted amicably, and he saved my life by preventing me from walking into oncoming 55 MPH traffic as I turned to leave the conversation! Thanks for that! But Bernie, I’d advise against campaigning on narrow median strips. 😉
Fed Rate Hike Risk: Last week, the risk appeared to be rising with the stock market, but of course, as the market pulled back a bit, rates eased as investors plowed more funds into Treasuries. That even helped gold/gold miners on Friday. If TNX is below the January Fed day low of 2.688%, I consider it Bearish for rates (bonds higher, rates lower). The risk of a Fed hike with easing in China and Europe (Euro dove this week on Draghi comments) is LOWER.
Let’s get back to the technical picture, and how to invest/trade around it….
Two weeks ago: Still true! “In my view, the SP500 Index would have to scale all THREE highs of Oct. 17, 2816.94, Nov. 7, 2815.15, and Dec. 3 2800.18, the latter just 8 points away, before saying the Mini Bear Market is dead.” The S&P500 Index close Friday? 2743.07. It had been above only the Dec. high, and now it’s back below all three highs.
The old adage, at least 360 years old, applied to the current market goes like this “Fool me once, shame on you! Fool me twice, three, or four times, shame on me!” It’s not impossible with the trajectory of earnings shown, that things will get progressively worse, which is why I’m not increasing my exposure dramatically yet.
IF things do worsen vs. get better by the second half as the Bulls are counting upon, we’ll be able to add more exposure at full correction prices or better. My practical definitions of pullback levels were posted in Oct. 2018 search on “New Rules” “Mini Bear Market” on Google and click on the Oct. 27, 2018 Issue). Why did I bother adding at about a 3% SPX discount at week’s end? Because you never know how low these pullbacks will go.
Now take a look at the SP500 chart…. Orange lines are the 2017 up channel.
SP500 Large Cap Index (click chart to enlarge; SPX, SPY):

Coming off a lower high – again.
Now let’s check in on two “Canary Signals” we’ve been following:
“Intel-igent Market Timing Signal” (Intel; INTC): Neutral, but in a pullback. It cannot be said to be in a downtrend yet, but must hold the prior breakout of 50.60 on the pullback. The SPX is down 5 days in a row, while INTC was down the past 4 days.
Bank of America (BAC) Market Timing Signal: Negative. It fell this week and bounced on Friday from the 2-08-19 low. Rates closed AT the bottom of the current range on Friday, so why BAC was up is curious. Someone is wrong as I like to say! XLF, the financial SPX sector ETF, was down just barely on Fri., but also held above the Feb. 8 low.
As I said last week, the “Only Way Up” is # 1 below. I want to keep this here for reference…
- “Break out to new highs with SLOWLY rising interest rates. This is the ONLY way UP for the U.S. stock market.
- Fall back to at least the October 2018 low or worse on RAPIDLY rising interest rates (which I will then call Rate Shock III).
- Fall back to at least the October 2018 low or worse on FALLING interest rates as the market begins to realize the economic slowing is real and as estimates of earnings continue to fall.”
The Oct. low is now is 5.09% lower from the Friday SPX close.
Now let’s go on to review investor sentiment…
Keep up-to-date during the week at Twitter and StockTwits (links below) where a combined 33,889 investors are following the markets with me…
Follow Me on Twitter® Follow Me on StockTwits®.
Join the Conversation in the StockTwits “MarketTiming” Room
Survey Says!
Sentiment of individual investors (AAII.com) showed a Bull minus Bear percentage spread of +10.64 vs. +21.63% last week. Last week I said: “Every one is as cheery as they’ve been since the high in the market on Oct. 3, 2018, a high just shy of the all time high on 9-21-2018.”
I also said, “CONCLUSION on SENTIMENT: Sentiment is at a level that could point to a pullback, but it does not have to be a big one.” I also warned that if the market moved higher than the triple top of lower highs, sentiment could rally further.
This week sentiment is not particularly helpful, other than showing that the Bulls dwindled and the Bears grew in numbers after just a very slight pullback through Wednesday, the day the poll closes. I favor more downside based on that, but in truth there is now room for sentiment to rise or fall. The news on Mueller or China could cause sentiment to react significantly.
| Bulls | Neutrals | Bears |
| 37.39% | 35.87% | 26.75% |
| Thurs. 12 am CT close to poll | ||
2. U.S. Small Caps Market Timing (IWM): I pointed out previously: “Stalled out barely above the 200 day moving average.” I also warned you it was higher beta and it has in fact fallen more to date off its high.
Russell 2000 U.S. Small Cap Index (click chart to enlarge; IWM, RUT):
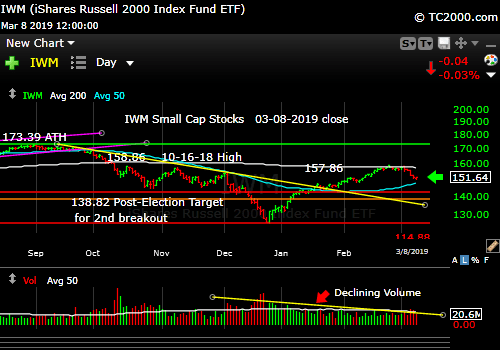
Small caps also down 5 days in a row, and down more than large caps.
3. Gold Market Timing (GLD): GLD is now 0.69% above my sell point. I was hoping for more downside in order to get back in at a better price than my sell price. For GDX, I’m 2.85% behind. I kept a covered call on a miner that is slightly under water. I also have about 4% GLD insurance (% of investable assets) I do not touch. I was protecting these positions vs. the rate bounce that fizzled back to the prior low. I think it would be reasonable to increase trading exposure to gold, depending on where rates open on Monday, and IF GLD moves above a level I mention at the base of this report.
The Gold ETF (click chart to enlarge the chart; GLD):
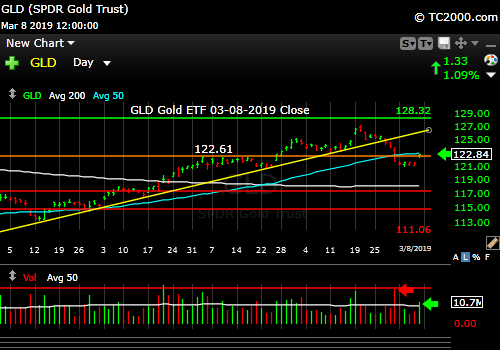
Gold falls then bounces as rates jump around.
4. Interest Rate Market Timing – U.S. 10 Year Treasury Note Yield (TNX):
I am now 0.25% behind on my IEF sell and 0.30% ahead on my TLT sell. The direction of the 10 Year Treasury Yield could be decided early this coming week. The close was right on the screws – 2.625, which is the low of the recent consolidation. Below there, the bond Bulls are in charge.
TNX closed Friday at 2.625% as mentioned, now below 2.688%, or what I am calling the “Fed’s gone dovish number.” My concern is the wage growth that occurred despite the lousy 20K jobs created last month was 3.4% Y/Y, which means some inflationary pressure. Admittedly the inflation picture is very mixed and hard to predict when world growth is slowing while U.S. wages are rising. Follow the market and trade in the direction of the trend. Right now? Sideways, but testing a low!
Remember: Rates are still ridiculously low for a strong recovery scenario.
Check out the “Market Signal Summary” below – after you review the following chart…
U.S. 10 Year Treasury Note Yield (click chart to enlarge; TNX, IEF, TYX, TLT, TBF):

Rates back down at the low end of the range.
Now let’s review three key market timing signals together….
Do not use these signals as a trading plan. They are rough guidelines. I currently share my own moves on social media (links above).
MY MARKET SIGNAL AND TREND SUMMARY for a Further U.S. Stock Market Rally with Real GDP Growth (“Real” means above inflation):
Stock Signal RED for a further U.S. stock market rally with a Bullish SP500 Index trend. The signal here is based on small caps, as they often lead the market down.
The V*IX (which relates to SPX volatility; * added to symbol to throw off the webcrawlers!) closed at 16.05 vs. 13.57 last week, which means the Bulls and Bears are about evenly matched. This is the fulcrum point.
UPDATE 3-11-19 10:00 am: I am going to compress the 15.94 to 15.95 and 16.09 numbers into one data point (a range as a single “point”), and it is the middle point/fulcrum by the way. So there will now be 7 targets: 13.31, 14.04-14.08, 15.04, middle point = [15.94-15.95 to 16.09], 17.06, 17.27, and 17.89 (updated 3-11-19). The Bulls failed to retain the 13.31 prize this week and the market fell. The “VIX Game” at the Friday close was Bulls 3/Bears 3, as the VIX closed right in the middle of the middle VIX target at 16.05 on Friday. As of Monday am VIX =15.38 so the score is now Bulls 4/Bears 3.
The ‘Bull Nirvana Target’ is our V*IX # of 2018: 13.31.” (That # is target #8 for the Bulls.) This is not a guarantee for more gains, but it’s one goal the Bulls must attain.
Gold Signal YELLOW for a further U.S. stock market rally with a NEUTRAL Gold Trend. The uptrend is broken, although the 10 Year Yield fell, which is a positive. What gold does mostly as I’ve written HERE is follow real interest rates. G*LD has to rise above 123.19 on an immediate basis (* added to throw off the “crawlers,” as I don’t like being part of “consensus.”)
From before: “Remember GLD is being used as an indicator for the ECONOMY here.” If gold continues to rise, it means the market believes real rates will fall, which means the global economy is slowing. That would hurt U.S. stocks.
Rate Signal YELLOW for a further stock market rally with a NEUTRAL 10 Year Yield Trend. Follow the next move “out of the box.”
I said weeks ago, “Watch the oil price too. Higher oil tends to mean higher rates.” Oil is having trouble getting above the Feb. high, but WTI it is above 55.63, which was the prior breakout, closing at 55.96.
I previously warned about the Fed tightening process: “This level of the 10 Year Treasury Yield, which is too high for current conditions as explained HERE, will eventually slow the economy.” I said, “2.621% was the peak back in 2017 when stocks did best. Anything below that would be an improvement.” The close on Friday? 2.625%! Higher rates only work in a strong economy, NOT a slowing U.S. and global economy.
As for much higher rates and their possible impact, I said previously: “All heck would break loose for equities if TNX lurches above 3.248%, particularly if the rise is rapid. Buy long dated Treasuries as close as you can to 3.248% on the 10 Year Yield TNX (IEF, TLT, etc.).”
Watch the rate at which TNX climbs. If it shoots up very fast, stocks will correct. In the Sept. 28th issue: “A rapid push higher in rates would mean trouble for stocks, as occurred in early 2018. That’s what I called ‘Rate Shock.'” The period of rising rates in early October I called #RateShockII. The next shock, I’ll be calling #RateShockIII.
Thank you for reading. Would you please leave your comments below where it says “Leave a Reply”… or ask a question or report a typo…
Pay it forward by sending the link to MarketTiming.Blog (that link will immediately connect them to this webpage) to a relative or friend. Thanks for doing that.
Be sure to visit the website for more general investing knowledge at:
Standard Disclaimer: It’s your money and your decision as to how to invest it.
I thank Worden Brothers for the charting system I use to post these charts. If you want to know more about the charting system I use every day, go HERE. It makes it much easier to follow along with me if you can see the charts and manipulate them on your own computer. It’s a great investment to have an excellent charting system. Check it out with a free trial at the link above. I am an affiliate of Worden Brothers, though oddly I’ve never been paid a cent by them. If you HAVE subscribed to their service, please send me a message. 😉
Note: I’ve updated my criteria for the equity signal for a further U.S. stock market rally to the following: GREEN = Bullish, YELLOW = Neutral, RED = Bearish. In other words, the colors tell you whether the signal supports the stock rally or not, while the Bullish, Neutral, and Bearish designations are about the trend.
A BEARISH trend signal does not mean we should not buy. A BULLISH trend signal does not mean you cannot sell some exposure. It depends on what is going on in the economy and how oversold/overbought the market is at a given point whether the Bearish signal is to be sold or bought, sold on the next bounce, etc. and whether a Bullish signal is to be bought or if profits should be taken. A NEUTRAL trend signal does not mean the end of the Bull or Bear. It means to wait and look for possible subsequent entry points within the existing trend, Bull or Bear, but preserve capital if the entry fails. Our strong intention is to buy low and sell high. By the way, I will keep showing the prior orange “Trigger lines” in the IWM and GLD charts for now as reference points only; they have historical value for us from the post-2016 election period.
Copyright © 2019 By Wall Street Sun and Storm Report, LLC All rights reserved.

MY MARKET SIGNAL AND TREND SUMMARY
15.94 – 15.95 ? Should that be 15.49 – 15.95?
No, I listed both prices I found on the databases I use because they were discrepant. Thanks for asking though! I can see why you asked. 😉
Thank you David! Excellent work!
You are welcome Charles!