A Market Timing Report based on the September 6, 2019 Close, published Saturday, September 7th, 2019…
I deliver focused comments on market timing once a week. These are supplemented with daily “Tweets/StockTwits” (see links below) and comments in the “markettiming” room on StockTwits.
I provide quite a bit of intraweek commentary, and if you don’t see it, you will miss out on quite a bit of context, so please click on the social media links below and have a read… Thank you as always for being loyal readers and interacting on social media with your questions and comments!
1. SP500 Index Market Timing (S&P 500 Index®; SPY, SPX):
My title this week is inspired by the thought that the Bulls are discounting the resolution of every possible risk ahead, well in advance of their resolution. That can work at times, and it can fail miserably at times. If you thought in 2008 that the Fed was on the case, and the market would turn around after the first major part of the decline, you front ran the second huge drop in the market that took stocks to a 55% discount from the prior ATH (all time high).
The market ascending to significant new highs requires:
1. Earnings growth resuming in Q4 2019 into 2020, with avoidance of a near term recession, not just in the U.S., but globally, for the most robust sort of rally. Don’t count on Europe or Japan helping much. Even China, which is still growing, has slowed in GDP growth rate. This does not mean a recession could not occur after the market rises another 10-20% above the prior ATH. This is something many have discussed this week. The fact is an inversion of the yield curve where the 2 year yield rises above 10 year yield (and it DID so so for several days), precedes recession by 6 months to a couple of years (discussed in a prior issue HERE) and in that period the market tends to rise quite a bit, NOT fall. The big players know this. They also know the public is NOT yet euphoric (see sentiment below).
2. Interest rates rising or at least stabilizing. When we are recovering, as I’ve shared here before, RATES RISE, they do not fall. Banks and insurance companies are in deep trouble when the yield spread is too low, which is why the world has done unthinkable things like going to deeply negative interest rates to drive money out of their currency. Switzerland’s 10 year bond is -0.919%! Each year you give up about 1% of your money for the privilege of holding Swiss bonds. Of course, few do this, other than Central Banks who have some sort of requirement to do so.
Realize these negative rates don’t force banks to make bad loans to businesses they believe are going to fail and leave them holding the bag, but what this does is force money into riskier areas of the market. It keeps asset prices from falling as far as they otherwise would.
3. U.S. China Trade War resolution. If it’s a marginal win, that would still help in the short to intermediate term, and a bigger U.S. win could help U.S. GDP growth in a much bigger way. It definitely would resolve the lack of confidence businesses have about investing in their future that Federal Reserve Chair Powell spoke of in Zurich on Friday. See my messages about that HERE. And then scroll back a bit from the main message stream to read the rest.
4. President Trump’s re-election. Without that, the entire tax rate structure (lower corporate rates are most critical for the stock market) will be reversed IF the Democrats take the Senate back. If Biden becomes President, which I will address below, he may only opt for a partial increase in the corporate tax rate (…as I advised him! 25% is my number, vs. the current 21%), but that would immediately impact corporate earnings.
We’d need all four of those, minus impeachment of course, which does not seem to be on the front burner. When did you last hear about it? Exactly!
Let’s first check my “Bull Market Health Score”…
What would satisfy me that the Bulls are serious?
Let’s check the list once again… The Bull Market Health Score this week = Bulls 4/Bears 1. Last week we were at Bulls 0/Bears 5, so there’s been good progress. At the end of July before the pullback, we were at Bulls 2.5/Bears 2.5.
For each checklist item below, I give you the points scored as Bullish or Bearish.
1. New high? Bulls 1.0 point. Answer: Yes, not an all time high, but a higher high as I said three weeks ago, which means the Bulls get this point.
“Bulls must retake S*PX 2943.31 and S*PY 294.15 to be convincing that the current correction is over at least in getting us back to a test of the prior ATH (all time high). (*’s added to throw off the ‘web crawlers’; it’s not my goal to become part of the ‘consensus.'”
The Bulls got to 2985.86 this week and closed the week at 2978.71 . SPY got to 298.83 and closed at 298.05.
Where to next? The market was stretched on Friday, but it can now rise to the prior all time high (ATH) and perhaps as high as the upper yellow trend line on the chart below. That is for the large cap quality stocks. Although the weakest stocks gained strength this week as mentioned on social media, the “high flyer club” was not expanded nearly as much.
High beta growth stocks (stocks that move much more than the market in percentage terms, up and down) have not been working of late, likely because they have been priced to perfection and any miss, even slight, during economic slowing can cause them to plummet. There is good news for the SP500 Index Bulls though in the strength of the “lower quality” group of stocks this week, meaning lower quality in behavior. That improves the breath and sustainability of the advance.
2. VIX trend favorable? Bulls 1.0. Answer: Yes. At the Friday close, the VIX was 15.00 vs. the prior week’s close at 18.98. The VIX Game Score as I call it is Bulls 5/Bears 3 as of the close Friday (Game Numbers can be found at the base of this report). The Bulls also broke a key support level on Friday at 15.51.
3. AD % Line in an Uptrend? (This is a proprietary stat; see base of report.): Bulls 1.0 point. Answer: Yes. The close was 16,634, which was a marginal new high above the prior high of late July of 16,632 this past Friday. That’s pretty close to the prior high, so you could argue I should not give the Bulls the full point, but this was achieved in breadth without a new market high, which I why I’m giving it to the Bulls.
4. Volume on Up Moves? Bulls 1.0 point. Answer: Yes. Volume did go up slightly on Thursday when the market broke out of the prior trading range of the three prior lower highs shown on the chart.
5. Is the “U.S. Index Matrix Signal,” as I call it, positive? Bears 1.0 point. Answer : No. The small caps are still below the series of lower August highs. Even the midcaps are below the Aug. 8th high and just below the 50 day moving average (mav).
I said last week: “The Bulls have to come up with a better bounce soon, or we’ll descend into Wave 3 Down, the ‘Big Red Wave.'” The rise above the series of lower highs voids Wave 3 Down for now. A quick reversal back below the August tops would bring it back into play however.
What are the “upside opportunities” as I call them? Let’s ask what could cause or substantially contribute to a sustained rally (a rise of more than 2-3 days)?
1. The U.S. Federal Reserve lowers interest rates more quickly than suggested by their latest “mid-cycle adjustment” language.
The next Fed meeting is Sept. 17-18, and it’s clear from Powell’s stance in Zurich this week that the Fed won’t act between meetings. Still, the market has 10 days of play before their next statement and news conference. They appear to have used the Wall Street Journal as their vehicle to warn that they may not move down rates by 0.50% at the meeting. They may stick to a 0.25% cut. In fact, a 50 basis point cut would surprise the markets – and propel Treasuries and gold to new highs in my view. A 0.25% cut would still support them both in moving higher.
CME Group says a 0.25% cut in on Sept. 18th, as of Friday, has a 91.2% probability of occurring, and the rest of the probability distribution says the Fed will not cut at all. There is a 58.5% probability they will cut again in October, but only a 32.8% probability of a 3rd cut in December. By January there is a 60.4% probability that rates reflect three cuts. March? 33.8% prob. of 4 cuts. April? 19.2% prob. of 4 cuts, so the odds of continuing rate cuts beyond 3 cuts is NOT in the market at the moment.
The jobs report Friday showed 130,000 jobs were created last month, which was weaker than expected. Still, the market doesn’t mind “slow growth” at this point, because it lengthens the recovery period. If unemployment starts to rise, that’s another thing, and it’s not a good sign. That’s something we need to follow.
2. The U.S. Treasury Intervenes to Weaken the U.S. Dollar: There has been no further talk about this after some discussion two weeks ago.
3. China, Europe, and Japan provide FISCAL STIMULUS to their economies. I detailed two weeks ago (link to upper right) that China and Japan are doing some things that could help. I’ve heard some analysis saying that China’s efforts are not going to be nearly enough to move the needle.
4. Trump’s U.S. China Trade War Ends: Two weeks ago I said:
…”the threats are getting bigger and bigger at this point. Perhaps that alone will force a faster solution. Trump, after the Friday market close, now says he’ll see President #Xi and raise him 5%! HERE are the details (Sept. 1st tariffs are going from 10 to 15% and the 25% will go to 30% on Oct. 1st.).”
That turned out to be correct. Both sides have had it with the escalation process and cannot survive much more pain. The agreement will not be perfect, but they’ll come to one. Otherwise Trump won’t be re-elected. Voters don’t care why they’re not doing well; they blame the blamable, and Trump will have a target on his back if he carries the Trade War into the election. He won’t win.
5. Timing is everything. This is my headline this week, because with the new somewhat higher high, the market is saying “I don’t care” about a number of things. Three weeks ago I said the Bull view could be:
“‘Things will be better on a comparative basis in Q4 2019 and Q1 2020, so buy stocks now.’ Just the comparative improvement in earnings and revenues, IF the world does not in fact slip into a recession, would help the stock markets globally. This is not only true in the U.S., but also is the case in Europe and China. The issue is whether further weakness for Q3 results will drive stocks down more before they recover.”
Let’s check in on the context around the price action of the market by looking at the current Market Risks…
We have some new earnings data this week…
Earnings Risk: what is shown are the projections in the FactSet 3-15-19 report followed by the reports from 4-12-19 through 8-09-19 with a skip of two weeks until the 9-06-19 data (details HERE)… The arrows “—>” indicate 3 weeks of of omitted data in order to compress the data.
For Q2 2019, analysts are projecting earnings growth of 0.1% —> -1.3% -> —> -2.1% —> -2.6% -> -2.6% -> -3.0% -> -1.9% -> -2.6%-> -1.0% -> -0.7% -> -0.4% DONE
and revenue growth of 4.6% —> 4.3% —> 4.1% —> 3.8% -> 3.8% -> 3.7% -> 3.8% ->4.0% ->4.1% -> 4.1% -> 4.0% DONE
For Q3 2019, analysts are projecting earnings growth of 1.8% —> 0.8% —> 0.3% —> -0.5% -> -0.5% -> -0.8% -> -1.4% ->-1.9% -> -2.2% -> -3.1% -> -3.5% -> -3.6%
and revenue growth of 4.4% —> 4.4% —> 4.2% —> 3.8% -> 3.8% -> 3.3% -> 3.2% ->3.2% -> 3.1% -> 3.0% -> 3.1% -> 2.9%
For Q4 2019, analysts are projecting earnings growth of 8.1% —> 7.5% —> 7.2% —> 6.3% -> 6.3% -> 6.0% -> 5.4% ->4.9% -> 4.5% -> 3.9% -> 3.5% -> 3.4%
and revenue growth of 4.8% —> 4.8% —> 4.6% —> 4.3% -> 4.3% -> 4.2% -> 4.0% ->4.0%-> 4.5%-> 4.0% -> 4.0% -> 4.0% -> 3.8%
For CY 2019, analysts are projecting earnings growth of 3.4% —> 3.2% —> 2.7% -> 2.6% -> 2.4% -> 2.3% -> 1.7% -> 1.9% -> 1.5% -> 1.5% -> 1.4%
and revenue growth of 4.7% —> 4.7% —> 4.5% -> 4.4% -> 4.3% -> 4.4% ->4.4% -> 4.4% -> 4.3% -> 4.4% -> 4.3%
For Q1 2020, analysts are projecting earnings growth of 10.5% -> 10.7% -> 10.3 -> 9.9% -> 9.8% -> 9.5% ->9.2% –>9.0% -> 8.5% -> 8.2% -> 8.1%
and revenue growth of 6.2% -> 6.1% -> 6.0% -> 5.8% -> 5.8% -> 5.9% ->5.9% -> 5.7% -> 5.6% -> 5.7% -> 5.5%
For Q2 2020, analysts are projecting earnings growth of 13.3% -> 13.3% -> 12.9% -> 13.2% -> 13.5% -> 12.0% ->12.6% -> 10.7 -> 9.9% -> 9.3% -> 9.2%
and revenue growth of 6.8% -> 6.8% -> 6.6% -> 6.6% -> 6.6% -> 6.7% ->6.6% -> 6.5% -> 6.4% -> 6.5% -> 6.4%
For CY 2020, analysts are projecting earnings growth of 10.7%
and revenue growth of 5.6%
You can see that earnings projections for Q3 2019 are coming down and so are earnings out to 2020, although the comparisons are going to be easier vs. the prior year in 2020.
Here’s a Brief Review of the Other Market Risks at Hand:
China Deal Risk: Has improved as discussed.
U.S. Iran War Risk: Simmering at a low boil, and not over. Iran is reportedly already breaking the 2015 agreement on enrichment of uranium. Trump claims they want to negotiate.
Trump Impeachment Risk: Ongoing, but so quiet, it would appear without fresh “red meat,” this effort will fade away. Read my analysis in the July 26th issue HERE.
2020 Election Risk: No important change. Probably the biggest risk to the markets and most Americans are oblivious to this from the markets’ point of view. I’ll stand by this from before: “The market will likely pull back at least 10-15% going into the election if the outcome is even unclear, meaning President Trump is NOT ahead by a wide margin (a likelihood, but not a certainty, depending on whether the Dems go for a “McGovern” candidate, as in Nixon-McGovern in 1972, a Democrat disaster.”
From RealClearPolitics numbers: If you add Warren’s plus Sanders’ percentages of the vote, you get 4.4% more than Biden, which means the former two candidates are going to defeat their own platform in the primaries. Biden wins from the splintering of the vote by the two leading far left liberals.
If all the rest of the candidates drop out though, both Warren and Sanders could gain enough votes to beat Biden, but that assumes one half of the remaining votes go to each of them and Biden gets few additional votes, which is not likely. But their chances will improve significantly nevertheless.
Conclusion: Joe Biden needs to fight hard for the nomination, and he cannot lose steam in the debates through unforced errors.
Deficit/Debt Threat: No important change. I’ll leave this here as a monument to our monumental debt, which could threaten interest rates in the future. The only reason we are off the hook for now is because the rest of the world is in worse shape. When rates rise, there will be “heck to pay.”
Fed Rate Cut Risk: I discussed this above. Not doing enough, fast enough is the fear the stock market has.
Now take a look at the SP500 chart. The green line is 2940.91, the
9-21-2018 High, preceding the decline from Sept. to December 24th.
SP500 Large Cap Index (click chart to enlarge; SPX, SPY):
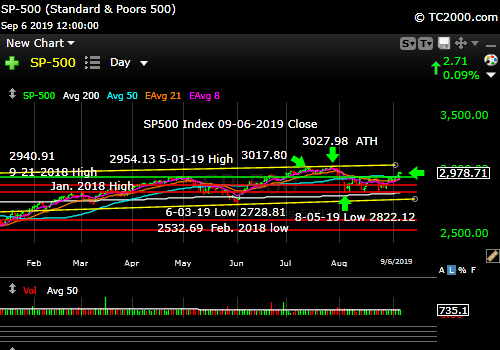
Rising above the prior range.
Now let’s check in on two “Canary Signals” we’ve been following:
“Intel-igent Market Timing Signal” (Intel; INTC): Positive. Broke out on 9-04. Approaching the lower July high however. Still a big gap back to the April high.
Bank of America (BAC) Market Timing Signal: Neutral but off the prior low. Still, it fell back from the 50 day mav. Interest rates are still headed lower most likely, so it won’t be the place to invest (it or XLF, financials).
Keep up-to-date during the week at Twitter and StockTwits (links below) where a combined 34,144 investors are following the markets with me…
Follow Me on Twitter® Follow Me on StockTwits®.
Join the Conversation in the StockTwits “MarketTiming” Room
Now let’s go on to review investor sentiment…
Survey Says!
Sentiment of individual investors (AAII.com) showed a Bull minus Bear percentage spread of -10.87% vs. -16.08% last week .
Last week: “Sentiment [the spread] has to break to the single digits to tell us a new rally could be starting.” It got to a 10.9% spread, which was apparently enough.
The fact that investor sentiment is still BEARISH with the SP500 Index breaking to new highs above the recent trading range is BULLISH. What we don’t want to see, as said above, is a reversal down with a spike in Bearishness. That would confirm a high probability of a Wave 3 down, which is the “Big Red Wave.” For now, it’s been averted.
| Bulls | Neutrals | Bears |
| 28.64% | 31.85% | 39.51% |
| Thurs. 12 am CT close to poll | ||
2. U.S. Small Caps Market Timing (IWM):
Small caps did not come along with the SP500 Index as you can see. They are still below those lower highs. A breakout in small and mid caps next week would confirm the move in large caps.
Russell 2000 U.S. Small Cap Index (click chart to enlarge; IWM, RUT):

Small caps still lagging.
3. Gold Market Timing (GLD):
I said on 7-26-18: “Still a Bull. Add on dips.” I said, “A China Trade War resolution could hurt gold somewhat by lowering uncertainty, but as long as the global economy is still shaky and weakening along with interest rates, gold will do well.” This could change in a couple of quarters, so we need to remain alert.
I believe the gold/gold stock reaction Friday was related to the idea that the Fed is reluctant under Powell to lower rates meaningfully. He’s been led BY the market, so he’ll eventually be forced to lower rates more aggressively, and gold will rise further in my view.
And this brings us to an INVESTING GEM, worth gold… This is “obvious” to most traders, and is often said, but investors do not ACT upon the truth that “To make the most money on great ideas, you need to stay with the trend to the end.” I’ve learned this more than once, and you may have learned this one or more times the hard way. If you allow a couple of days of volatility take you out of a position, it’s then hard to get back in. Then the stock or index or commodity just keeps going and going. You say you’ll buy the next pullback, but it doesn’t show up until the darn thing is 10% higher. Now it’s “too expensive.” Then it goes up another 20%. And you are finished at that point in buying a pullback, because it’s really, really expensive, and then it goes up another 20%. You “get it,” but what do you actually DO?
This is a corollary that is probably as important: You will not have that many GREAT investment ideas over time. (Buffett said as much about great companies, but it applies to all investment ideas.) When you have them, you need to give them time to play out. You need to be in the trend to allow great investment ideas to pay you off.
If you bought Apple when it came out with the first iPhone, and then a bit of volatility threw you out, you missed out on a HUGE run that may not even be over, because guess what? There is a 5G upgrade cycle coming. All existing iPhones will be replaced over a period of a few years. I’m not saying it’s a buy here or not, but I am saying it could be and to make money on what you think may happen, you will have to ride out the China slowing Apple is experiencing to get to the 5G upgrade cycle.
If you got out of gold when it went down with stocks in 2008, you missed another double in price to the current date and even greater gains to the 2011 high. I’ll tell you why you should stick with the gold trend in the gold section below, but it’s a great example of NOT GETTING OUT TOO EARLY.
If you do get out early? Simple. Get back in, hopefully on the next pullback, but perhaps even on the breakout to new highs. Investing in stages in an idea is always preferable to slamming a big block of money in at once, but that does not mean to add too slowly when you see a trend emerge. That’s how I made great gains when gold was at about $380 per ounce. I doubled my position in 2003, and since then, gold is up 299%. I could have added in quick steps though as the market rose, and I would have done nearly as well. When it dropped to around 1370, I sold my entire principle and rode the gravy. I added back exposure as a trading position during the current rally. Jim Cramer just talked about this “investing in stages” strategy just last week vs. “putting it all on at once.”
Warnings I’ll keep here: “The eventual inflection point in inflation (UP) and U.S. economic growth (UP) is what we need to pay attention to. Any sense that the Fed will end its series of interest rate cuts could trigger a gold sell-off.”
Be awake next week for the PPI( Weds.) and CPI (Thurs.) inflation data. Retail sales are on Friday.
This is not yet the time to pivot out of gold trades in my view. As long as the Federal Reserve is still lowering interest rates, gold/gold stocks will do well. When inflation starts to rise again, we’ll have to sell our trading positions in gold.
The Gold ETF (click chart to enlarge the chart; GLD):

Gold slipping a bit, but still in an uptrend.
4. Interest Rate Market Timing (10 Year Treasury Yield; TNX, IEF, TLT):
There was a big jump in the 10 Year Yield of 10.6 basis points (0.106%) on Sept. 5th when a greater likelihood of a China trade deal emerged (again!).
When the data is right in front of him, Federal Reserve Chair Powell would sound better if he said “There is slowing, but we’re still going to lower rates slowly” if that’s his plan rather than say “The US economy is in a good place,” which were his words on Friday in Zurich (that I reported over social media, tuning into Fox Business, while oddly CNBC did not cover the event live).
Powell should know that U.S. manufacturing is NOT in a good place. It is contracting despite Trump’s platform that said we were going to make more goods in America. In the trade war, companies have simply moved their production from China to Vietnam and Thailand among other places. They have not come back to the U.S. in large numbers.
Lowering rates will help stimulate stock prices at least! And Treasury/Bond prices. And gold prices. More asset bubbles on the way is the picture before us, which means we must remain invested in these trends till the end of the party. Keep one hand on the party room door, but be patient! And put that “investing gem” to good use.
Check out the “Market Signal Summary” below – after you review the following chart…
U.S. 10 Year Treasury Note Yield (click chart to enlarge; TNX, IEF, TYX, TLT, TBF):

Rates will continue to fall as long as the Fed is easing.
Now let’s review three key market timing signals together….
Do not use these signals as a trading plan. They are rough guidelines. I currently share my BUYS and SELLS in as timely a way as possible on social media (links above).
MY MARKET SIGNAL AND TREND SUMMARY for a Further U.S. Stock Market Rally with Real GDP Growth (“Real” means above inflation):
Stock Signal RED for a further U.S. stock market rally with a Bullish SP500 Index trend. The stock signal is based on small caps, as they often lead the market down. The small cap trend is neutral, leaning Bearish until the current trading range is breached to the upside.
The V*IX (which relates to SPX volatility; * added to symbol to throw off the webcrawlers!) These are the targets: 13.31, 14.04-14.08, 15.04, the “fulcrum” range = [15.94-15.95 to 16.09], 17.06, 17.27, and 17.89. The bonus target #8 is [12.-17-12.37]. The Bears have 5 of 8 targets at a VIX of 15.00 (Friday close). I consider the “fulcrum” the key decision point that turns the market from Bearish to Bullish, when the VIX falls below that entire fulcrum range.
The ‘Bull Nirvana Target’ is our V*IX # of 2018: 13.31.” (That is target #7 for the Bulls.)
Gold Signal RED for a further U.S. stock market rally with a BULLISH Gold Trend. What gold does mostly as I’ve written HERE is follow real interest rates.
From before: “Remember GLD is being used as an indicator for the ECONOMY here.” If gold continues to rise, it means the market believes real rates will fall, which in the current context means the global economy is slowing. That will ultimately hurt U.S. stocks.
Rate Signal RED for a further stock market rally with a BEARISH 10 Year Yield Trend. (Remember: lower rates mean higher bond and Treasury prices)
For Reference: “Rates usually RISE slowly in a strong recovery and the stock market rally continues as they rise, as I’ve repeated multiple times on social media and here. Empirically though, rates that are “lower” (than 3.11%) and are NOT rising rapidly have allowed the market to climb back above the prior all time high (ATH).”
I said weeks ago, “Watch the oil price too. Higher oil tends to mean higher rates.” It closed at 55.10 this week vs. 54.17 last week but in a Bearish descending triangle falling toward the June and August lows.
Just a reminder (not a current problem, because rates are “too low” now on a relative basis): If TNX bounces too quickly and too high, this will give rise to Rate Shock III… As said before: “Watch the rate at which TNX climbs if the current trend reverses. If it shoots up very fast, stocks will correct.” In the Sept. 28th issue: “A rapid push higher in rates would mean trouble for stocks, as occurred in early 2018. That’s what I called ‘Rate Shock.'” The period of rising rates in early October I called #RateShockII.
The risk lately has been “Negative Rate Shocks.” (Not negative rates in the U.S. yet! “Negative” refers to the direction of the shock.) First we had “Negative Rate Shock I” in December 2018 (because rates FELL while the Fed raised the Fed Funds rate 0.25% in mid-December, in what was perceived as a policy error by critics), “Negative Rate Shock II” in May, and “Negative Rate Shock III” in August, which is on pause and awaiting the next pivot.
Thank you for reading. Would you please leave your comments below where it says “Leave a Reply”… or ask a question or report a typo…
Pay it forward by sending the link to MarketTiming.Blog (that link will immediately connect them to this webpage) to a relative or friend. Thanks for doing that.
Be sure to visit the website for more general investing knowledge at:
Standard Disclaimer: It’s your money and your decision as to how to invest it.
I thank Worden Brothers for the charting system I use to post these charts. If you want to know more about the charting system I use every day, contact me. It makes it much easier to follow along with me if you can see the charts and manipulate them on your own computer. It’s a great investment to have an excellent charting system.
Note: I’ve updated my criteria for the equity signal for a further U.S. stock market rally to the following: GREEN = Bullish, YELLOW = Neutral, RED = Bearish. In other words, the colors tell you whether the signal supports the stock rally or not, while the Bullish, Neutral, and Bearish designations are about the trend.
A BEARISH trend signal does not mean we should not buy. A BULLISH trend signal does not mean you cannot sell some exposure. It depends on what is going on in the economy and how oversold/overbought the market is at a given point whether the Bearish signal is to be sold or bought, sold on the next bounce, etc. and whether a Bullish signal is to be bought or if profits should be taken. A NEUTRAL trend signal does not mean the end of the Bull or Bear. It means to wait and look for possible subsequent entry points within the existing trend, Bull or Bear, but preserve capital if the entry fails. Our strong intention is to buy low and sell high. By the way, I will keep showing the prior orange “Trigger lines” in the IWM and GLD charts for now as reference points only; they have historical value for us from the post-2016 election period.
Copyright © 2019 By Wall Street Sun and Storm Report, LLC All rights reserved.
