A Market Timing Report based on the October 18, 2019 Close, published Saturday, October 19th, 2019…
I deliver focused comments on market timing once a week. These are supplemented with daily “Tweets/StockTwits” (see links below) and comments in the “markettiming” room on StockTwits.
I provide quite a bit of intraweek commentary, and if you don’t see it, you will miss out on quite a bit of context, so please click on the social media links below and have a read… Thank you as always for being loyal readers and interacting on social media with your questions and comments!
1. SP500 Index Market Timing (S&P 500 Index®; SPY, SPX):
Earnings seemed to be OK this week, and yet analysts dropped their estimates for the very earnings being reported. That’s a negative sign. I review the earnings and revenue numbers below.
Many companies sporting a Price to Sales ratio of 10-20 or more have entered their own private Bear markets. VEEV, a high flyer I have picked on in prior issues, is 19.2% off its prior high of 176.90. It closed at 142.90 on Friday. There are many other examples. Despite that fall, VEEV is still selling at 21.83 times sales per Yahoo Finance. It could fall much further on that basis. Ten times sales is considered extreme for most companies. It has an EV/EBITDA ratio of 71.85. Around 10 is considered a bargain and where I first bought Microsoft (MSFT). MSFT is now at an EV/EBITDA of 18.78, although it is growing faster than it was when I bought it. It’s PEG (PE:Growth) ratio is 1.84 while Apple’s is 2.06 (AAPL).
If you say, well VEEV is growing fast, sorry… Its PEG is 3.65. It is not growing fast enough to justify its current price by that simple measure. Companies can be valued above where they “should” be and below as well. A slowing economy increases the danger of being the one holding the bag in terms of the high flying stocks like cloud stocks. As general advice, be selective if you feel you should still be invested in them.
In chart terms we are at about 81%ish from the base to the top of the channel defined by the two yellow trend lines in the chart below. The SP500 Index could still reach that upper yellow channel line on the chart below, but the failure of tech to lead on Friday is of concern. Rotation into safe stocks, when they are already oversubscribed, is also not a healthy sign.
What is happening “Under the Hood” this week?
The “safe stuff” with a dividend is still winning. Utilities (XLU) continue to outperform every other sector since the Aug. 5th low on up, except for REITs (XLRE) as of this week. Tech lost momentum this week and is in 3rd place. Consumer discretionary (XLY) is in 4th. XLE (energy) is still the worst sector and healthcare (XLV) still lags, but is improving much more rapidly than is XLE. Margins are falling as noted by FactSet (see link below), which will pressure XLP (cons. staples). Since our reference low, it has matched the market.
Let’s turn to the state of the market, which has made a lower high vs. the top yellow line in the SP500 Index market timing chart below…
What would satisfy me that the Bulls are serious?
The Bull Market Health Score this week is Bulls 2.5/Bears 2.5 vs. Bulls 4.0/Bears 1.0 last week. The Bulls have to take out the September high quickly if the rally is to continue…
For each checklist item below, I give you the points scored as Bullish or Bearish.
1. New high? Bears 1.0 Answer: No. The market was unable to exceed the previous lower high. The Bulls could argue for 0.5 points here, because the selling was not very impressive on Friday for the index as a whole. The problem? What was under the hood, which I will get to in a bit.
2. V*IX trend favorable? Bulls 1.0 Answer: Yes. The VIX Game Score is Bulls 5/Bears 2 at a VIX of 14.25 (Friday close).
3. AD % Line in an Uptrend? (This is a proprietary stat; see base of report.): Bulls 1.0 point. Answer: Yes. The close was 16,746 vs. 16,686 last week. Another higher high is needed now above 16.796, the prior high on 9-13-19.
4. Higher volume on Up Moves? Lower volume on Down moves? Bulls 0.5 point. Answer: Split decision. The volume has not been great either way, so we have a split decision here. Volume did go up on Friday with the selling.
5. Is the “U.S. Index Matrix Signal,” as I call it, positive? Bears 1.0 point. Answer : No. With the large caps near record highs, the smaller stocks should be doing better by now. Negative.
Let’s check in on the context around the price action of the market by looking at the current Market Risks…
We have some new earnings data this week…
Earnings Risk/Opportunity: what is shown are the projections in the FactSet 3-15-19 report followed by the reports from 4-12-19 through 8-09-19 with a skip of two weeks until the 8-30-19 data resumes the weekly data sequence (details HERE)… The arrows “—>” indicate 3 weeks of of omitted data in order to compress the data.
For Q2 2019, analysts are projecting earnings growth of 0.1% —> -1.3% -> —> -2.1% —> -2.6% -> -2.6% -> -3.0% -> -1.9% -> -2.6%-> -1.0% -> -0.7% -> -0.4% DONE
and revenue growth of 4.6% —> 4.3% —> 4.1% —> 3.8% -> 3.8% -> 3.7% -> 3.8% ->4.0% ->4.1% -> 4.1% -> 4.0% DONE
For Q3 2019, analysts are projecting earnings growth of 1.8% —> 0.8% —> 0.3% —> -0.5% —> -1.9% -> -2.2% -> -3.1% -> -3.5% -> -3.6% -> -3.7% -> -3.8% -> -3.7% -> -4.1% -> -4.6% -> -4.7%
and revenue growth of 4.4% —> 4.4% —> 4.2% —> 3.8% —> 3.2% -> 3.1% -> 3.0% -> 3.1% -> 2.9% -> 2.8% -> 2.8% -> 2.8% -> 2.8% -> 2.7% -> 2.6%
For Q4 2019, analysts are projecting earnings growth of 8.1% —> 7.5% —> 7.2% —> 6.3% —> 4.9% -> 4.5% -> 3.9% -> 3.5% -> 3.4% -> 3.2% -> 3.0% -> 2.9% ->2.6% -> 2.3% -> 1.5%
and revenue growth of 4.8% —> 4.8% —> 4.6% —> 4.3% —> 4.0%-> 4.0% -> 4.0% -> 4.0% -> 3.8% -> 3.7% -> 3.6% -> 3.6% -> 3.6% -> 3.5% -> 3.2%
For CY 2019, analysts are projecting earnings growth of 3.4% —> 3.2% —> 2.7% —> 1.7% -> 1.9% -> 1.5% -> 1.5% -> 1.4% -> 1.3% -> 1.3% -> 1.3% -> 1.2% -> 1.1% -> 0.7%
and revenue growth of 4.7% —> 4.7% —> 4.5% —> 4.4% -> 4.4% -> 4.3% -> 4.4% -> 4.3% -> 4.2% -> 4.1% -> 4.1% -> 4.1% -> 4.1% -> 4.0%
For Q1 2020, analysts are projecting earnings growth of 10.5% —> 9.8% —> 8.5% -> 8.2% -> 8.1% -> 7.9% -> 7.9% -> 7.8% -> 7.6% -> 7.3% -> 6.7%
and revenue growth of 6.2% —>5.8% —> 5.6% -> 5.7% -> 5.5% -> 5.5% -> 5.4% -> 5.4% -> 5.5% -> 5.3% -> 4.8%
For Q2 2020, analysts are projecting earnings growth of 13.3% —> 13.5% -> 12.0% ->12.6% -> 10.7 -> 9.9% -> 9.3% -> 9.2% -> 9.1% -> 9.0% -> 9.0% -> 8.7% -> 8.6% -> 7.7%
and revenue growth of 6.8% -> —> 6.6% -> 6.7% ->6.6% -> 6.5% -> 6.4% -> 6.5% -> 6.4% -> 6.4% -> 6.3% -> 6.3% -> 6.3% -> 5.9% -> 5.2%
For CY 2020, analysts are projecting earnings growth of 10.7% -> 10.6% -> 10.6% -> 10.6% -> 10.5% -> 10.6% -> 10.4%
and revenue growth of 5.6% -> 5.6% -> 5.6% -> 5.6% -> 5.7% -> 5.6% -> 5.3%
Earnings projection for Q3, which are being reported now are FALLING not rising as the data comes in. Usually, it’s the opposite. Estimates are too low and they move up. We need to follow this closely. It had better reverse by next week’s results.
The series of earnings projections for Q4 2019 has fallen from the first estimates of 8.1% down to 1.5% this week. It was 2.3% last week! Q4 was supposed to save the year. It’s not going to. Q1 and Q2 of 2020 earnings estimates also fell significantly this week.
Here’s a Brief Review of the Other Market Risks at Hand:
China Deal Risk: President Trump made a partial deal, because he needed it politically, as he faces near certain impeachment. Conviction is another thing as I’ve covered in past issues. I reviewed the deal contents last week (link to upper right). Economic Advisor Larry Kudlow says we’ll have a deal by mid-November.
Fed Rate Cut Risk: Now the probability is 91.4% vs. 75.4% last week the Fed cuts in October by 0.25% for the 3rd time as assessed by CME Group. An additional 4th cut in Dec. has DROPPED in probability from 41.7% two weeks ago to 24.5% to 24.3% this week.
Remember, THREE cuts is a mid-cycle adjustment. Four means they expect recession.
What about January? The odds of cut #4 or even #5 are 42% vs. 38.2% last week vs. 67% two weeks ago!
What about March? The odds are 46.6% vs. 44.7% last week vs. 75.1% two weeks ago for 4 or more cuts in total. Now 9.3% vs. 6.2% last week vs 10% two weeks ago vs 35.1% three weeks ago expect 5 or 6 cuts by then. In fact the 6 cut probability is now 0.5%. April? 52% vs 48.5% last week vs. 79.7% two weeks ago expect there to have been 4 or more cuts. A small minority, now 13.4% vs. 13.0% last week vs. 43.7% two weeks ago, expects the number of cuts to exceed four by April.
Last week I said the Bulls were lucky the odds of 4 cuts by April was below 50%. This week, we’ve crawled back above that 50% mark. Let’s see if a trend develops in the coming weeks indicating recession risk is rising further.
The Risk of a Neutral Fed: If the 3rd cut is the end for the Federal Reserve cutting cycle, the stock market may not like that if growth continues slowing. The Fed will be perceived as falling behind again. Some say it’s clearly behind now, but I disagree, only because I think the Fed powers have become an overused asset. By their rules they “should” drop rates faster, but is it really helpful?
Look at the stagnation in Europe despite NEGATIVE rates. We need negative rates like we need a hole in the head. The attempt to negate the economic cycle is only going to lead to more misery down the road. Did we learn NOTHING from the Great Recession? Certainly, many did not.
No change on my game plan… I’ll stick to the “Roller-coaster Map”:
“As my loyal readers know, if there’s a recession, think of up to MORE than December’s decline TIMES TWO, or a “Big Bear Market” as I call it.
In sum, the market goes down further as Q3 Earnings hit the fan. Things should improve into year end and at the start of 2020, so the market then rallies. A final high is reached prior to the discounting of a recession, which brings on a ‘Big Bear Market.’ Got it? 😉 It’s a roller-coaster we’re now on. “
“Punchline: As I’ve argued on sentiment terms alone (though we don’t use just one factor), we have not reached the highest high we’ll see prior to the next recession.”
U.S. Iran War Risk: More stable after the leak of the “Iran Annihilation Plan HERE. That would cause a lot of suffering among the people of Iran, so let’s pray that peace and diplomacy wins out.
2020 Election Risk: Biden is doing better again in the polls after:
1. He was NOT attacked for involvement in Ukraine by his Dem primary buddies.
2. He fought Trump back on Trump’s own swampish behavior and the actual facts of the case.
3. Warren was attacked effectively in the debate, particularly by Buttigieg who said having a bunch of plans was not useful if the plans are doomed to fail. Medicare for All is doomed to fail in my view, because we Americans like freedom over tyranny. She does not get that. Bernie also does not get that. Let them compete I say, and the winner will take massive share. If the government is more efficient than private insurers, PROVE IT! That is a point no candidate has used to date.
A rich nation should make sure ALL have healthcare. If you have never or recently felt truly sick, or perhaps watched one or both of your parents die slowly as I did, you may not realize how awful that is and how much it can devastate a person’s life. As a physician, I also know that. No one should be denied healthcare based on an inability to pay. Drug and device prices must be regulated, because companies have proven unable to regulate themselves. It hurts the public interest to have the fools charge France and Germany less than Medicare for expensive drugs. It’s insanely stupid of our government to suck up to big pharma that way.
There must be a plan to insure strong profits to pay for the risk of drug development as well as cost controls to prevent abuse. BUT an accounting should be made for the public funds that LEAD TO DRUG PATENTS! For years, the government has subsidized this immense research of which I’ve been a part. My work and that of many others was sponsored by the government, yet private firms can use it to create drugs and pay zero to the government. (P.S. I do not receive royalties for my work.)
Trump Impeachment Risk: Censure/Admonishment of Trump seems an unlikely path now. Trump will be impeached. Impeachment odds are easily above 95%. And Trump deserves it (or at least formal censure for it; if repeated, he should be kicked out). What he did was dead wrong. There are still certifiably brain-dead GOP Congressmen who deny there was any wrong done, despite the fact Trump Chief of Staff Mick Mulvaney said this week there was in fact a “quid pro quo.” That’s after the White House and GOP were saying over and over there was NO quid pro quo! He simply declared Trump was doing what was always done in government. Trading things. But what he was trading was for DIRT on Biden, his political opponent, not getting Ukraine to prosecute corruption in general. Hunter Biden being paid a ridiculous sum to lobby the Federal government was wrong, but unfortunately it’s not illegal.
Then to top that off, Trump gave his Doral property the G7 meeting to host. Unbelievable. He intends to stuff his pockets with cash by sending business to his properties. And then he says Biden’s son should not have been paid for work he was not competent to do. Really? Give me a break. If that is not a breach of the emoluments clause of the Constitution, they need to amend it! Congress would have to approve use of the Doral site to permit it to happen under that clause. It clearly won’t.
In the end, the GOP seems firm on not convicting on the now proven quid pro quo of military aide for dirt on a political opponent that was clear as day in the Ukraine transcript. Trump will be impeached, but not convicted as it stands. The election is now just over a year away, which puts even less pressure on the GOP to impeach Trump.
This still stands: “It will take connecting Trump to foreign campaign contributions to convict him. The GOP would have to convict on that basis alone. BUT if the evidence stops with the Ukraine transcript, he won’t be convicted, and he’ll use the “verdict” for his re-election campaign. The Democrats are taking a risk.”
The market is now confirming “No Trump conviction” AND a win of a second term in 2020. That could change, but that is the current market reading on Trump.
Deficit/Debt Threat: No important change. I’ll leave this here as a monument to our monumental debt, which could threaten interest rates in the future. When rates rise, there will be “heck to pay.” The U.S. dollar remains at risk and having at least 5% gold exposure is a must in any portfolio. Some say higher, but owning stocks is also a hedge that over time would work out for solid companies, even in the face of very high inflation (not in the case of bankruptcies of course!).
Now take a look at the SP500 chart. The green line is 2940.91, the
9-21-2018 High preceding the decline ending December 24th. The upper yellow line is the next target (now at about 3053 a brand new ATH, but rises slowly over time).
SP500 Large Cap Index (click chart to enlarge; SPX, SPY):

Lower high must be exceeded by Bulls.
Now let’s check in on two “Canary Signals” we’ve been following:
“Intel-igent Market Timing Signal” (Intel; I*NTC; * there to throw off the crawlers!): Neutral. Same as last week. Intel is above the prior key level of 50.50 at a 51.36 close, but a move above 53.50 failed previously, so a higher high than that is required for it to turn Bullish.
Bank of America (BAC) Market Timing Signal: Neutral. It was up on earnings that beat expectations (which are always adjusted ahead of time and can be fudged in myriad ways) Still true: A new high is the way for the Bulls to change the picture. Target? 31.17. Still true: If the Fed is in fact lowering rates, it makes no sense to chase BAC. When they stop, and the economy is accelerating, it will be a buy. The Fed is starting to signal “one more and done,” which is what the market sees as a mid-cycle adjustment as occurred in 1995 and 1998 (max of 3 cuts). That would help stabilize the banks/financials (XLF).
Keep up-to-date during the week at Twitter and StockTwits (links below) where a combined 34,144 investors are following the markets with me…
Follow Me on Twitter® Follow Me on StockTwits®.
Join the Conversation in the StockTwits “MarketTiming” Room
Now let’s go on to review investor sentiment…
Survey Says!
Sentiment of individual investors (AAII.com) showed a Bull minus Bear percentage spread of +2.57% vs. -23.65% last week. The prior (2 weeks ago) -18.07% was good enough for a bounce. Now we’re back to a neutral sentiment spread. Not helpful in deciding the market’s direction. At best it tells you sentiment is not stretched.
| Bulls | Neutrals | Bears |
| 33.62% | 35.33% | 31.05% |
| Thurs. 12 am CT close to poll | ||
2. U.S. Small Caps Market Timing (IWM):
It must exceed the early Aug. high to make any more progress. It’s mid range and neutral for stocks in general as noted in the summary below.
Russell 2000 U.S. Small Cap Index (click chart to enlarge; IWM, RUT):

Small caps still trapped within a range.
3. Gold Market Timing (GLD):
I’ll stand by this for now:
“This is not yet the time to pivot out of gold trades in my view. As long as the Federal Reserve is still lowering interest rates, gold/gold stocks will do well. When inflation starts to rise again [and the Fed hikes rates] we MAY have to sell our trading positions in gold.”
The above actually depends on the Fed’s reaction time as inflation rises somewhat over the coming quarters as I explained last week HERE.
By itself, the Fed declaring itself NEUTRAL would be negative for gold.
Technicals: I said 3 weeks ago: “The G*LD trend will be negative below 139.35.” It tested 137.80 and then bounced.
Summary still true: “Rate pressure on gold may not be done yet! Buy the lows, rather than chase bounces and use stops on current profits. As said, I keep a core GLD position at all times, but the trades will come and go. When things change, we change…”
The Gold ETF (click chart to enlarge the chart; GLD):
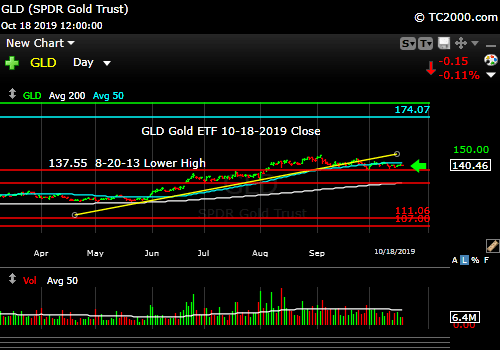
Gold set up to make a move. Follow the move!
4. Interest Rate Market Timing (10 Year Treasury Yield; TNX, IEF, TLT):
Upside: I think the biggest risk is that the Fed says in a couple of weeks it is pretty much done with its mid-cycle adjustment of 3 cuts as I’ve been sharing. That may mean rates keep rising for a while from here. That could hurt interest rate sensitive investments like REITs, utilities, bonds/Treasuries, and gold. (Gold could still work if inflation rises faster than the Fed reacts as said.)
Downside for Rates: I’ll leave this here: “IF TNX skids further than it has, particularly to a new all time low, that means the bond market expects a U.S. recession, and a U.S. stock market crash (even if it happened slowly in a cascading fashion) could occur, particularly if there were a rapid ‘Negative Rate Shock’ as defined at the base of this report. It also imply the bond market felt the Fed was doing too little, lowering rates too slowly, and was risking economic slowing and deflation.”
All that is true, but it does not mean it’s good policy! The Fed can help make credit available when tight, but it’s job should not be to manipulate the stock and real estate markets higher. Stocks should go up when their earnings and revenues go up! That is a free market vs. a made up one.
Check out the “Market Signal Summary” below – after you review the following chart…
U.S. 10 Year Treasury Note Yield (click chart to enlarge; TNX, IEF, TYX, TLT, TBF):

Rates could move still higher, unless global slowing prevails.
Now let’s review three key market timing signals together….
Do not use these signals as a trading plan. They are rough guidelines. I currently share my BUYS and SELLS in as timely a way as possible on social media (links above).
MY MARKET SIGNAL AND TREND SUMMARY for a Further U.S. Stock Market Rally with Real GDP Growth (“Real” means above inflation):
Stock Signal YELLOW for a further U.S. stock market rally with a NEUTRAL SP500 Index trend (I could make an argument for calling it Bullish, but I did not like the tech selling on Friday and the lower high must be taken out now.) It certainly is not a great place to buy the market. The stock signal is based on small caps, as they often lead the market down. Small caps continue to move sideways within a range, the top of which was established on Feb. 25th.
The V*IX (which relates to SPX volatility; * added to symbol to throw off the webcrawlers!) These are the seven targets: 13.31, 14.04-14.08, 15.04, the “fulcrum” range = [15.94-15.95 to 16.09], 17.06, 17.27, and 17.89. The VIX Game Score is Bulls 5/Bears 2 at a VIX of 14.25 (Friday close).
The ‘Bull Nirvana Target’ is 13.31.” (That is target #7 for the Bulls.)
Gold Signal YELLOW for a further U.S. stock market rally with a NEUTRAL Gold Trend. What gold does mostly as I’ve written HERE is follow real interest rates around the world (if you own “gold in dollar terms” you care about U.S. rates most of all). The rest of the world does matter however, including massive buying by central banks.
From before: “Remember GLD is being used as an indicator for the ECONOMY here.” If gold continues to rise, it means the market believes real rates will fall, which in the current context means the global economy is slowing. That will ultimately hurt U.S. stocks.
Rate Signal NEUTRAL for a further stock market rally with a long term BEARISH and short term Neutral 10 Year Yield Trend. (Remember: lower rates mean higher bond and Treasury prices) We are off a significant low, so the short term trend has changed.
I’ll add this reminder from 9-20-2019’s issue cited above: “Remember, FOUR Fed cuts will NOT be a “mid-cycle adjustment” and would be taken badly by the market ironically, considering the market’s addiction to lower rates. ***A fourth cut means the Federal Reserve is seeing recession risk as significantly high.***”
Also for Reference: “Rates usually RISE slowly in a strong recovery and the stock market rally continues as they rise, as I’ve repeated multiple times on social media and here. Empirically though, rates that are “lower” (than 3.11%) and are NOT rising rapidly have allowed the market to climb back above the prior all time high (ATH).”
I said weeks ago, “Watch the oil price too. Higher oil tends to mean higher rates.” It closed at 53.87 vs. 54.70 last week, and is barely coming off the low of the range. Still holds: If it rises above 58.82 and then 60.94, oil and oil stocks will be off to the races. 63.38 would be the next target. Since May, the price of oil almost appears to have been managed to stay between 50 and 59/barrel. I wonder why? 😉
Just a reminder: If TNX bounces too quickly and too high, this will give rise to Rate Shock III… As said before: “Watch the rate at which TNX climbs if the current trend reverses. If it shoots up very fast, stocks will correct.” In the Sept. 28th issue: “A rapid push higher in rates would mean trouble for stocks, as occurred in early 2018. That’s what I called ‘Rate Shock.'” The period of rising rates in early October I called #RateShockII.
The risk lately has been “Negative Rate Shocks.” (Not negative rates in the U.S. yet! “Negative” refers to the direction of the shock.) First we had “Negative Rate Shock I” in December 2018 (because rates FELL while the Fed raised the Fed Funds rate 0.25% in mid-December, in what was perceived as a policy error by critics), “Negative Rate Shock II” in May, and “Negative Rate Shock III” in August, which is on pause and awaiting the next pivot. The Stock Market Bulls had better hope that they don’t get more rate cuts past October.
Thank you for reading. Would you please leave your comments below where it says “Leave a Reply”… or ask a question or report a typo…
Pay it forward by sending the link to MarketTiming.Blog (that link will immediately connect them to this webpage) to a relative or friend. Thanks for doing that.
Be sure to visit the website for more general investing knowledge at:
Standard Disclaimer: It’s your money and your decision as to how to invest it.
I thank Worden Brothers for the charting system I use to post these charts. If you want to know more about the charting system I use every day, contact me. It makes it much easier to follow along with me if you can see the charts and manipulate them on your own computer. It’s a great investment to have an excellent charting system.
Note: I’ve updated my criteria for the equity signal for a further U.S. stock market rally to the following: GREEN = Bullish, YELLOW = Neutral, RED = Bearish. In other words, the colors tell you whether the signal supports the stock rally or not, while the Bullish, Neutral, and Bearish designations are about the trend.
A BEARISH trend signal does not mean we should not buy. A BULLISH trend signal does not mean you cannot sell some exposure. It depends on what is going on in the economy and how oversold/overbought the market is at a given point whether the Bearish signal is to be sold or bought, sold on the next bounce, etc. and whether a Bullish signal is to be bought or if profits should be taken. A NEUTRAL trend signal does not mean the end of the Bull or Bear. It means to wait and look for possible subsequent entry points within the existing trend, Bull or Bear, but preserve capital if the entry fails. Our strong intention is to buy low and sell high. By the way, I will keep showing the prior orange “Trigger lines” in the IWM and GLD charts for now as reference points only; they have historical value for us from the post-2016 election period.
Copyright © 2019 By Wall Street Sun and Storm Report, LLC All rights reserved.
