A Market Timing Report based on the October 25, 2019 Close, published Saturday, October 26th, 2019…
I deliver focused comments on market timing once a week. These are supplemented with daily “Tweets/StockTwits” (see links below) and comments in the “markettiming” room on StockTwits.
I provide quite a bit of intraweek commentary, and if you don’t see it, you will miss out on quite a bit of context, so please click on the social media links below and have a read… Thank you as always for being loyal readers and interacting on social media with your questions and comments!
1. SP500 Index Market Timing (S&P 500 Index®; SPY, SPX):
Earnings improved this week, although they are still predicted to show negative growth for the quarter vs. Q3 of 2018. Earnings estimates for upcoming quarters fell, even while the market rose this week.
I’ll preface my remarks below by saying we are headed into a period of slowly “Rising Inflation” as Ray Dalio calls it with slightly “Rising GDP growth,” which could vaporize going into 2020, especially in Q1 2020 (see the earnings stats below). If the growth part can persist, it’s a fine backdrop for stocks as long as inflation does not get high enough to choke growth off. Remember that 10 Year Treasury rates near 3.25% were considered negative for U.S. stocks, given the low rates in the rest of the world.
What is happening “Under the Hood” this week?
The “safe stuff” took a hit this week. Utilities (XLU) dropped to second place (vs. the Aug. low), giving up first place to Tech (XLK). Apple and Intel have both been on tears UP. Consumer Staples (XLP; I’m long puts on XLP ) were -0.59% with REITs (XLRE) falling -1.23% on Friday as the market (SPX) rose 0.41%. Third place went to the Financials (XLF; +0.49%), which did slightly better than the market .
Over the past week, the strongest sectors were XLE (Energy), XLK, XLI, and XLF. XLE was the real standout, which smacks of rising inflation to go along with rates creeping up some more in turn bringing along the financials. If that plays out, the dollar will strengthen on higher rates, and the profit margins/earnings of multinationals will be pressured.
What I don’t particularly like is the fact that my stretch indicators are not expanding. They have topped out and barely budged last week. The market looks like it lacks the energy, at least at the moment, to fight it’s way up to significant new highs.
Let’s turn to the state of the market…
What would satisfy me that the Bulls are serious?
The Bull Market Health Score this week is Bulls 3.0/Bears 2.0 vs. Bulls 2.5/Bears 2.5 last week. The Bulls have to take out the July high quickly if the rally is to continue…
For each checklist item below, I give you the points scored as Bullish or Bearish.
1. New high? Bulls 0.5 Answer: No, but the market has not sold off from the high except to pull off the ATH (all time high; I always use intraday highs NOT closing highs), which it came very close to touching (less than an SPX point!). The SP500 Index is above the Sept. high, but below the July high.
2. V*IX trend favorable? Bulls 1.0 Answer: Yes. The VIX Game Score is Bulls 7/Bears 0 at a VIX of 12.65 (Friday close), which is below my “Bull Nirvana” number noted at the base of this report.
3. AD % Line in an Uptrend? (This is a proprietary stat; see base of report.): Bulls 1.0 point. Answer: Yes. The close was 16,825 vs. 16,746 last week. This is above the prior Sept. high of 16,796.
4. Higher volume on Up Moves? Lower volume on Down moves? Bulls 0.5 point. Answer: Split decision. The volume has not been great either way, so we have a split decision here. Volume went down a bit on Friday and the market was up.
5. Is the “U.S. Index Matrix Signal,” as I call it, positive? Bears 1.0 point. Answer : No. With the large caps near record highs. Small caps are still badly lagging the market, although they have moved up within the trading range that began last February. Large caps have moved up in price since the small caps topped out in February.
Let’s check in on the context around the price action of the market by looking at the current Market Risks…
We have some new earnings data this week…
Earnings Risk/Opportunity: what is shown are the projections in the FactSet 3-15-19 report followed by the reports from 4-12-19 through 8-09-19 with a skip of two weeks until the 8-30-19 data resumes the weekly data sequence (details HERE)… The larger arrows “—>” indicate 3 weeks of of omitted data in order to compress the data.
For Q2 2019, analysts are projecting earnings growth of 0.1% —> -1.3% -> —> -2.1% —> -2.6% -> -2.6% -> -3.0% -> -1.9% -> -2.6%-> -1.0% -> -0.7% -> -0.4% DONE
and revenue growth of 4.6% —> 4.3% —> 4.1% —> 3.8% -> 3.8% -> 3.7% -> 3.8% ->4.0% ->4.1% -> 4.1% -> 4.0% DONE
For Q3 2019, analysts are projecting earnings growth of 1.8% —> 0.8% —> 0.3% —> -0.5% —> -1.9% -> -2.2% -> -3.1% -> -3.5% -> -3.6% -> -3.7% -> -3.8% -> -3.7% -> -4.1% -> -4.6% -> -4.7% -> -3.7%
and revenue growth of 4.4% —> 4.4% —> 4.2% —> 3.8% —> 3.2% -> 3.1% -> 3.0% -> 3.1% -> 2.9% -> 2.8% -> 2.8% -> 2.8% -> 2.8% -> 2.7% -> 2.6% -> 2.8%
For Q4 2019, analysts are projecting earnings growth of 8.1% —> 7.5% —> 7.2% —> 6.3% —> 4.9% -> 4.5% -> 3.9% -> 3.5% -> 3.4% -> 3.2% -> 3.0% -> 2.9% ->2.6% -> 2.3% -> 1.5% -> 0.7%
and revenue growth of 4.8% —> 4.8% —> 4.6% —> 4.3% —> 4.0%-> 4.0% -> 4.0% -> 4.0% -> 3.8% -> 3.7% -> 3.6% -> 3.6% -> 3.6% -> 3.5% -> 3.2% -> 3.0%
For CY 2019, analysts are projecting earnings growth of 3.4% —> 3.2% —> 2.7% —> 1.7% -> 1.9% -> 1.5% -> 1.5% -> 1.4% -> 1.3% -> 1.3% -> 1.3% -> 1.2% -> 1.1% -> 0.7% -> 0.6%
and revenue growth of 4.7% —> 4.7% —> 4.5% —> 4.4% -> 4.4% -> 4.3% -> 4.4% -> 4.3% -> 4.2% -> 4.1% -> 4.1% -> 4.1% -> 4.1% -> 4.0% -> 4.0%
For Q1 2020, analysts are projecting earnings growth of 10.5% —> 9.8% —> 8.5% -> 8.2% -> 8.1% -> 7.9% -> 7.9% -> 7.8% -> 7.6% -> 7.3% -> 6.7% -> 6.0%
and revenue growth of 6.2% —>5.8% —> 5.6% -> 5.7% -> 5.5% -> 5.5% -> 5.4% -> 5.4% -> 5.5% -> 5.3% -> 4.8% -> 4.7%
For Q2 2020, analysts are projecting earnings growth of 13.3% —> 13.5% -> 12.0% ->12.6% -> 10.7 -> 9.9% -> 9.3% -> 9.2% -> 9.1% -> 9.0% -> 9.0% -> 8.7% -> 8.6% -> 7.7% -> 7.3%
and revenue growth of 6.8% -> —> 6.6% -> 6.7% ->6.6% -> 6.5% -> 6.4% -> 6.5% -> 6.4% -> 6.4% -> 6.3% -> 6.3% -> 6.3% -> 5.9% -> 5.2% -> 5.2%
For CY 2020, analysts are projecting earnings growth of 10.7% -> 10.6% -> 10.6% -> 10.6% -> 10.5% -> 10.6% -> 10.4% -> 9.9%
and revenue growth of 5.6% -> 5.6% -> 5.6% -> 5.6% -> 5.7% -> 5.6% -> 5.3% -> 5.3%
Last week I said: “Earnings projection for Q3, which are being reported now are FALLING not rising as the data comes in. It had better reverse by next week’s results.” Earnings did perk up a bit this week with the earnings shortfall moving from -4.7% to -3.7%.
But the earnings for Q4 2019 dropped in the same week from 1.5% to 0.7%. That makes it look like earnings were pulled back into Q3 from Q4, which was commented upon by some companies. In addition, Q1 and Q2 of 2020 continued to fall. Since estimates were first being made for Q1 of 2020 to now, earnings growth has fallen from 10.5% to 6.0%. For Q2 2020 they’ve been slashed from 13.3% to 7.3%. That’s not heading in the right direction for those expecting growth to pick up in 2020. That means the market’s valuation is stretching UP now at a time when Earnings estimates are still FALLING, not rising. In the end, all companies live and die by growth in earnings and revenues. When earnings and revenue growth slow (decelerate), stock prices fall.
Here’s a Brief Review of the Other Market Risks at Hand:
China Deal Risk: No movement. All happy jawboning this week. The Phase One Deal is not that great in actuality. “Soybeans for tariffs not going up” sounds like the gist of it. A Phase One Deal is still expected by mid-November. Bottom line is that hurting China’s growth will continue to create negative feedback to U.S. companies. It could be worth the pain in the end, but show us the money! Show us the patent protections! Show us “no forced tech transfers”!
Fed Rate Cut Risk: Now the probability is 93.5% vs. 91.4% last week the Fed will cut its Fed Funds Rate on October 30th by 0.25% for the 3rd time as assessed by CME Group. An additional 4th cut in Dec. has DROPPED in probability from 41.7% two weeks ago to 22.1% this week (about the same for the past 3 weeks).
Remember, THREE cuts is a mid-cycle adjustment. Four means they expect recession.
What about January? The odds of cut #4 or even #5 are 41.5% vs. 42% last week vs. 67% three weeks ago!
What about March? The odds are 46.3% vs. 46.6% last week vs. 75.1% three weeks ago for 4 or more cuts in total. Now 9.0% vs. 9.3% last week vs 10% three weeks ago vs 35.1% four weeks ago expect 5 or 6 cuts by then. In fact the 6 cut probability is now 0.5% (past 2 weeks). April? 50.1% vs. 52% last week vs. 79.7% three weeks ago expect there to be 4 or more cuts. A small minority, now 11.8% vs. 13.4% last week vs. 43.7% three weeks ago, expects the number of cuts to exceed four by April.
Two weeks I said the Bulls were lucky the odds of 4 cuts by April was below 50%. Last week, we crawled back above that 50% mark, and are barely above it now. I would like this number to fall further to be sure a nearby recession is not in the cards.
For now, that means half of investors are still expecting a recession. That could be interpreted as Bullish or Bearish depending on who is right and who is wrong! The Bears will be recruited to the Buyer camp if they are wrong. The Bulls will break down and sell if they are wrong and a recession is near. Do you see why I follow the market as the ultimate arbitrator? Some stories matter until they don’t. Impeachment won’t matter unless it cripples Trump’s re-election chances, but I would not count him out yet. The stock market has not. Remember, short term the market is a voting machine, but long term it’s a weighing machine as Ben Graham said. The weighing machine is currently saying Trump stays for two terms.
The Risk of a Neutral Fed: If the 3rd cut is the end for the Federal Reserve cutting cycle, “Master Market,” as I call the impetuous, little, tantrum-prone boy, may not like that if growth continues slowing. The Fed will be perceived as falling behind again. Some say it’s clearly behind now, but I disagree, only because I think the Fed powers have become an overused asset (see my comments last week; link to upper right).
While earlier stating that I thought earnings would “hit the fan,” now that 40% of companies have reported already, it does not seem likely to happen. The market has decided to front run real improvements in the economy, even as durable goods results and the industrial economy continue down. If the first 40% to report are an indication, the market does not care that earnings growth has been NEGATIVE for the 3rd quarter in a row (if that sticks for Q3 by the end of the season) per FactSet data.
Even some who have recently been Bearish believe the economy will look better in Q4, while Q1 and Q2 of 2020 are more iffy. The market seems to be holding out hope that lots of things start improving including multiple risks disappearing (see below). Ironically, as said, the panic over the Fed lowering rates just a few weeks ago, seems to be dissipating.
The narrative just two weeks ago was that the market was rising on a dovish Fed. “Don’t fight the Fed.” Now what??? While some Bears still see the economy as tipping over from late cycle full employment with rising wages and rising inflation with falling operating margins and earnings, others see the glass half full with:
1. Slowly rising rates helping financials earn more.
2. The lack of more Fed cuts being Bullish rather than Bearish. It would mean our economy does not need any more cuts, while the rest of the world lives in the land of negative yields.
3. Slowly rising to stable energy prices helping energy companies to improve their earnings, while steady supplies of oil etc. keep prices stable.
4. Continued slow GDP growth, which allows the expansion to go further than anyone thought possible, after already being the longest expansion on record.
IF we assume there is no negative earnings reaction to be had from here out for Q3, then we are in the next phase already, and should expect the market to break out to a brand new all time high. Otherwise, the market is expecting further slowing leading eventually to recession, whether mild or otherwise. Even mild recessions can cause 20% market haircuts.
Conclusion: It may be reasonable to add some exposure to your stock portfolio on a move to new highs (go in stages in case of reversal and be willing to sell the new exposure on a reversal as well). I generally dislike buying “higher” in general vs. waiting for the first pullback after a breakout, but a market that can break out from here could have another decent run up in Q4 and perhaps into Q1 of 2020.
Current Scenario…
Things improve into year end and at the start of 2020 (economically, but also including the failure of Trump conviction after his successful impeachment), so the market rallies further. A final high is reached prior to the discounting of a recession, which brings on a ‘Big Bear Market.’ Got it? 😉 We may be moving into the final accent in the roller-coaster ride. Could there be some smaller bumps still? Of course there could, perhaps as Trump’s Senate trial approaches for example.
“Punchline: As I’ve argued on sentiment terms alone (though we don’t use just one factor), we have not reached the highest high we’ll see prior to the next recession.”
Caveats? The biggest one would be a one-term Trump. The market’s would move down by 20% or more on that. Why? Because all the Democrats want to dramatically reverse the Trump corporate tax cuts as well as the tax cuts on the wealthy. The cuts on corporations matter most to stocks.
U.S. Iran War Risk: More stable after the leak of the “Iran Annihilation Plan HERE. No change this week.
2020 Election Risk: Falling. The Democrats are struggling to come up with a candidate who can win. Biden appears wounded by the Ukraine Swamp and seems to struggle with the facts in the debates. Sanders is vulnerable as a self-described socialist to turning off voters who matter in a general election, along with lingering questions about his health. Patients who have stents are at risk of recurrence of myocardial ischemia, which would result in re-hospitalization (Ref.), as well as bleeding episodes from associated treatment to prevent stent stenosis (Ref.). The risk of death after stents in a large study looking at over 25,600 patients was about 1.9% with 11% of those patients dying, or 0.2% of the total group.
Warren was shot down by Buttigieg in the last debate for having lots of plans, but little experience in implementing them. She’s been a teacher mostly. She lacks an even sort of personality that voters like. She’s like your liberal aunt on cocaine (you realize Twitter could easily shut an account down for even joking in that way? “You are spreading rumors of drug addiction!” What a joke! I only use Twitter as a back up system to StockTwits now. Sorry for the inconvenience, but I don’t want to support Twitter as they are autocratic NOT Democratic! I recommend being able to access BOTH systems though, because of occasional outages. I will reconnect fully to Twitter if they change their policies to support free speech and when they treat small businesses the same as large businesses.) I actually like Warren’s passion and energy and think she’s a decent person, but I don’t agree with many of her policies. I DO like financial regulation as long as it is not over-regulation. The big banks need to be closely regulated as they were the cause of the Great Recession.
But Warren wants “free everything” (“free” should be reserved for those in need) and forced single payer healthcare, which even many Democrats do not want. Biden and Buttigieg both want “Medicare for All Who Want It.”
So who is left? “Crazy Hillary”? “Crazy” yes for seeing Russian ghosts everywhere she looks, accusing Jill Stein and Tulsi Gabbard as being “Russian assets.” True or false, she has no access to secret information at this point to support such accusations.
Healthcare Tangent: Sanders and Warren want Medicare for all who want it and who don’t want it. They also are afraid to find out whether the private sector can BEAT the public sector by letting them compete head to head! No candidate has yet made that point. Let them compete and we’ll see who wins! Everyone will be on Medicare if it’s actually cheaper/better than private insurance. Logistically how well do you think switching many millions of people over Medicare will go? Some companies would instantly go bankrupt. Private insurers and those connected to them in networks would see their stocks crash. Thousands would lose their jobs, and could have to move to be re-employed by the government in similar jobs.
Trump Impeachment Risk: Censure/Admonishment of Trump seems an unlikely path now. Trump will be impeached. Impeachment odds are easily above 95%. Conviction risk will only rise above 5% based on new evidence. What they have on him is bad, but not enough to get the Republicans in the Senate to pull the trigger so to speak.
Deficit/Debt Threat: Trump is now beating Obama at something! The size of his deficit! Read THIS. The deficit is up 26% to $964 Billion for fiscal 2019, the HIGHEST IN 7 YEARS!
I’ll leave this here as a monument to our monumental debt, which could threaten interest rates in the future. When rates rise, there will be “heck to pay.” The U.S. dollar remains at risk and having at least 5% gold exposure is a must in any portfolio. Some say higher, but owning stocks is also a hedge that over time would work out for solid companies, even in the face of very high inflation (not in the case of bankruptcies of course!).
Now take a look at the SP500 chart. The green line is 2940.91, the
9-21-2018 High preceding the decline ending December 24th. The upper yellow line is the next target (now at about 3055 a brand new ATH, but rises slowly over time).
SP500 Large Cap Index (click chart to enlarge; SPX, SPY):
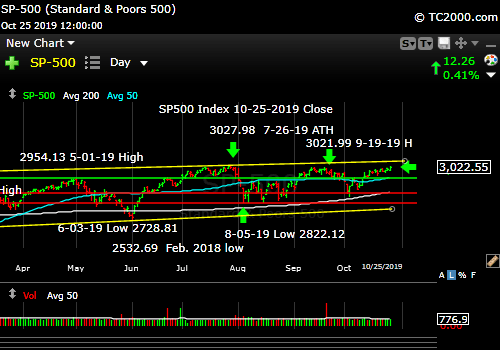
Up but not yet over!
Now let’s check in on two “Canary Signals” we’ve been following:
“Intel-igent Market Timing Signal” (Intel; I*NTC; * there to throw off the crawlers!): Bullish. Last week: “Intel is above the prior key level of 50.50 at a 51.36 close, but a move above 53.50 failed previously, so a higher high than that is required for it to turn Bullish.” Intel has made great progress in its businesses, evolving from a PC based business to Cloud Data Centers, the Internet of Things, 5G, and much more. It broke out on high volume on Friday. The June 4 high of 57.60 and the April high of 59.59 are the next tests. The fact that Intel’s business is so strong is a warning that the Bearish notion of a nearby recession could be wrong. Maybe this is just a mid-cycle adjustment just as Powell has claimed. If so, he’ll look smarter than Trump in a 6 months.
Bank of America (BAC) Market Timing Signal: Bullish. In the recent rally off the low, the stock was up ELEVEN days in a row. That is meaningful. Last week: “Still true: A new high is the way for the Bulls to change the picture. Target? 31.17.” The stock has closed four times above that 31.17 number, so the breakout looks OK, though the volume has not been as strong as for Intel as a comparison.
Last week: “If the Fed is in fact lowering rates, it makes no sense to chase BAC. When they stop, and the economy is accelerating, it will be a buy. The Fed is starting to signal “one more and done,” which is what the market sees as a mid-cycle adjustment as occurred in 1995 and 1998 (max of 3 cuts). That would help stabilize the banks/financials (XLF).”
The CME data cited supports the notion of “Three Cuts and Done” is all the market will get from the Federal Reserve, which will help the financials, and BAC will be helped along with them.
Keep up-to-date during the week at Twitter and StockTwits (links below) where a combined 34,144 investors are following the markets with me…
Follow Me on Twitter® Follow Me on StockTwits®. (real time messages are ONLY on StockTwits until Twitter reforms its policies, but we’ll have it as a backup system)
Join the Conversation in the StockTwits “MarketTiming” Room
Now let’s go on to review investor sentiment…
Survey Says!
Sentiment of individual investors (AAII.com) showed a Bull minus Bear percentage spread of +7.33% vs. +2.57%. That is not that stretched to the Bullish side, so more upside is possible; however, I’d give the edge to the Bears here on sentiment, because the last time Bulls were at these levels was on July 17th and Sept. 18th, both very close to prior highs. Follow the market, up or down!
| Bulls | Neutrals | Bears |
| 35.60% | 36.13% | 28.27% |
| Thurs. 12 am CT close to poll | ||
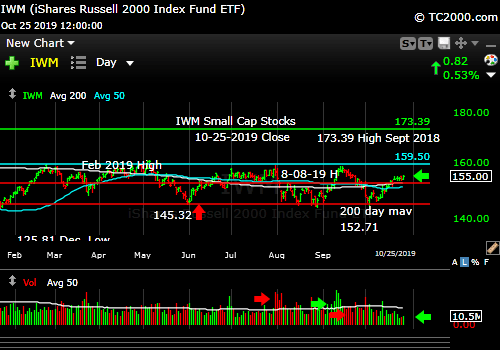
2. U.S. Small Caps Market Timing (IWM):
IWM is mid range and though rising off the lows, it’s neutral for stocks in general as noted in the summary at the base of this report. The small caps could easily rise to the high end of the range at that aqua line before pulling back. Above that line, the market would be expecting a full recovery of the economy’s growth trajectory.
Russell 2000 U.S. Small Cap Index (click chart to enlarge; IWM, RUT):
3. Gold Market Timing (GLD):
Things are shifting… We’ve gone from “recession risk” and “multiple cuts” as well as “don’t fight the Fed” to “Three cuts and done.” That raises the risk for the gold trade, because inflation is set to rise over the next few months. If the Fed lags inflation, gold wins, but if it front runs inflation, gold loses on a relative basis.
I’ve been warning you that…
“When inflation starts to rise again [and the Fed hikes rates] we MAY have to sell our trading positions in gold.”
By itself, the Fed declaring itself NEUTRAL would be negative for gold”
Technicals: I said 3 weeks ago: “The G*LD trend will be negative below 139.35.” It tested 137.80 and then bounced. The close Friday was 141.86.
Summary still true: “Rate pressure on gold may not be done yet! Buy the lows, rather than chase bounces and use stops on current profits. As said, I keep a core GLD position at all times (do what works for you), but the trades will come and go. When things change, we change…” Technically, GLD has to break up above that yellow triangle shown below. If it fails to do so, and breaks the other way, we’ll need to exit our gold trades.
The Gold ETF (click chart to enlarge the chart; GLD):

Gold is leaning up, but faces a neutral Fed.
4. Interest Rate Market Timing (10 Year Treasury Yield; TNX, IEF, TLT):
I would bet on HIGHER rates over the short term with a “Neutral Fed.” That is negative for bonds/Treasuries, good for the dollar, and a negative for gold and gold stocks.
Last Week: “Upside: I think the biggest risk is that the Fed says it is pretty much done with its mid-cycle adjustment of 3 cuts as I’ve been sharing. That may mean rates keep rising for a while from here. That could hurt interest rate sensitive investments like REITs, utilities, bonds/Treasuries, and gold. (Gold could still work if inflation rises faster than the Fed reacts as said.)”
Downside for Rates: I’ll leave this here: “IF TNX skids further than it has, particularly to a new all time low, that means the bond market expects a U.S. recession, and a U.S. stock market crash (even if it happened slowly in a cascading fashion) could occur, particularly if there were a rapid ‘Negative Rate Shock’ as defined at the base of this report. It also imply the bond market felt the Fed was doing too little, lowering rates too slowly, and was risking economic slowing and deflation.”
Check out the “Market Signal Summary” below – after you review the following chart…
U.S. 10 Year Treasury Note Yield (click chart to enlarge; TNX, IEF, TYX, TLT, TBF):

Rates could rise further on a neutral Fed.
Now let’s review three key market timing signals together….
Do not use these signals as a trading plan. They are rough guidelines. I currently share my BUYS and SELLS in as timely a way as possible on social media (links above).
MY MARKET SIGNAL AND TREND SUMMARY for a Further U.S. Stock Market Rally with Real GDP Growth (“Real” means above inflation):
Stock Signal YELLOW for a further U.S. stock market rally with a Bullish SP500 Index trend. The stock signal is based on small caps, as they often lead the market down. Small caps are moving up within a range, the top of which was established on Feb. 25th. The lag vs. large caps is still a negative. That is a negative divergence in the Index Matrix.
The V*IX (which relates to SPX volatility; * added to symbol to throw off the webcrawlers!): The VIX Game Score is scored as 7 points running from a VIX high of 17.89 (point 1 for the Bulls) down to 13.31 (Point 7 for the Bulls). The VIX Game Score is Bulls 7/Bears 0 at a VIX of 12.65 (Friday close).
The ‘Bull Nirvana Target’ is 13.31.” (That is target #7 for the Bulls.) We’re below that number!
Gold Signal YELLOW for a further U.S. stock market rally with a NEUTRAL Gold Trend. What gold does mostly as I’ve written HERE is follow real interest rates around the world (if you own “gold in dollar terms” you care about U.S. rates most of all). The rest of the world does matter however, including massive buying by central banks.
From before: “Remember GLD is being used as an indicator for the ECONOMY here.” If gold continues to rise, it means the market believes real rates will fall, which in the current context means the global economy is slowing. That will ultimately hurt U.S. stocks.
Rate Signal NEUTRAL for a further stock market rally with a long term BEARISH and short term Neutral 10 Year Yield Trend. (Remember: lower rates mean higher bond and Treasury prices) We are off a significant low, so the short term trend has changed to neutral. There is a lower high forming though. Rates could rise further on a neutral Fed this week.
I’ll add this reminder from 9-20-2019’s issue cited above: “Remember, FOUR Fed cuts will NOT be a “mid-cycle adjustment” and would be taken badly by the market ironically, considering the market’s addiction to lower rates. ***A fourth cut means the Federal Reserve is seeing recession risk as significantly high.***”
Also for Reference: “Rates usually RISE slowly in a strong recovery and the stock market rally continues as they rise, as I’ve repeated multiple times on social media and here. Empirically though, rates that are “lower” (than 3.11%) and are NOT rising rapidly have allowed the market to rise.”
I said weeks ago, “Watch the oil price too. Higher oil tends to mean higher rates.” It closed at 56.66 and is rising slowly again vs. 53.87 last week. Still holds: If it rises above 58.82 and then 60.94, oil and oil stocks will be off to the races. 63.38 would be the next target. Since May, the price of oil almost appears to have been managed to stay between 50 and 59/barrel. I wonder why? 😉
Just a reminder: If TNX bounces too quickly and too high, this will give rise to Rate Shock III… As said before: “Watch the rate at which TNX climbs if the current trend reverses. If it shoots up very fast, stocks will correct.” In the Sept. 28th issue: “A rapid push higher in rates would mean trouble for stocks, as occurred in early 2018. That’s what I called ‘Rate Shock.'” The period of rising rates in early October I called #RateShockII.
Another Reminder: “The risk lately has been ‘Negative Rate Shocks.’ (Not negative rates in the U.S. yet! “Negative” refers to the direction of the shock.) First we had ‘Negative Rate Shock I’ in December 2018 (because rates FELL while the Fed raised the Fed Funds rate 0.25% in mid-December, in what was perceived as a policy error by critics), ‘Negative Rate Shock II’ in May, and ‘Negative Rate Shock III’ in August, which is on pause and awaiting the next pivot. The Stock Market Bulls had better hope that they don’t get more rate cuts past October.
Thank you for reading. Would you please leave your comments below where it says “Leave a Reply”… or ask a question or report a typo…
Pay it forward by sending the link to MarketTiming.Blog (that link will immediately connect them to this webpage) to a relative or friend. Thanks for doing that.
Be sure to visit the website for more general investing knowledge at:
Standard Disclaimer: It’s your money and your decision as to how to invest it.
I thank Worden Brothers for the charting system I use to post these charts. If you want to know more about the charting system I use every day, contact me. It makes it much easier to follow along with me if you can see the charts and manipulate them on your own computer. It’s a great investment to have an excellent charting system.
Note: I’ve updated my criteria for the equity signal for a further U.S. stock market rally to the following: GREEN = Bullish, YELLOW = Neutral, RED = Bearish. In other words, the colors tell you whether the signal supports the stock rally or not, while the Bullish, Neutral, and Bearish designations are about the trend.
A BEARISH trend signal does not mean we should not buy. A BULLISH trend signal does not mean you cannot sell some exposure. It depends on what is going on in the economy and how oversold/overbought the market is at a given point whether the Bearish signal is to be sold or bought, sold on the next bounce, etc. and whether a Bullish signal is to be bought or if profits should be taken. A NEUTRAL trend signal does not mean the end of the Bull or Bear. It means to wait and look for possible subsequent entry points within the existing trend, Bull or Bear, but preserve capital if the entry fails. Our strong intention is to buy low and sell high. By the way, I will keep showing the prior orange “Trigger lines” in the IWM and GLD charts for now as reference points only; they have historical value for us from the post-2016 election period.
Copyright © 2019 By Wall Street Sun and Storm Report, LLC All rights reserved.

Thank you! I don’t think Trump will be re-elected and it’s possible the Senate will remove him from office! Re-electing Trump means the country accept Corruption, crimes and indecency in the Oval Office! That would be the end of the United States of America as the greatest Governmental experiment throughout the world! The markets are looking past Trump and I don’t think his impeachment will do much damage to the markets as it appears the markets are sending a signal that Trump doesn’t matter which is correct. Lets chat!
I understand your passion about having a government free of corruption, but until the Constitution is amended to rid us of the influence of PAC money, the Swamp is very difficult to uproot. Within our current twisted system “Failure of Democracy” would mean Trump entering a third term, which won’t happen despite people’s crazy ideas.
I think your supposition that the market will absorb a rise in corporate rates from 21% to Biden’s 28% or Warren’s 35% (I believe she said she’d reverse Trump’s cuts, but someone can fact check me on that) without throwing a fit, is incorrect. Such a move immediately makes corporate earnings worse. Just as the possibility of corporate rate cuts fueled the market, it will hurt markets to reverse the cuts. That’s not a political statement of course. If I were running things I’d at most move corporate rates to China’s 25% rate to remain competitive on a global basis. I would also increase the MINIMUM tax on corporate earnings. Despite the 21% rate, many large companies like Intel report sub 20% numbers. They write off bad investments and we pay for them. That should be allowed, but not after a company is a certain size. Investors should take the hit after a certain point in whatever “fair” metric is decided upon (like operating earnings of over 25 million dollars just to pick a number out of the air). Why should we subsidize stupid investments except for start-ups, which we always need to preserve? (Start-ups fuel innovation and society should share the risk of creativity at the start.)