A Market Timing Report based on the November 1, 2019 Close, published Saturday, November 2nd, 2019…
I deliver focused comments on market timing once a week. These are supplemented with daily “Tweets/StockTwits” (see links below) and comments in the “markettiming” room on StockTwits.
I provide quite a bit of intraweek commentary, and if you don’t see it, you will miss out on quite a bit of context, so please click on the social media links below and have a read… Thank you as always for being loyal readers and interacting on social media with your questions and comments!
1. SP500 Index Market Timing (S&P 500 Index®; SPY, SPX):
Earnings improved again this week vs. expectations (which often happens as companies try to surprise to the upside), just a bit more, although they are still predicted to show negative growth for the quarter vs. Q3 of 2018. Earnings estimates for upcoming quarters fell, with the fourth Quarter of 2019 turning negative for the first time, since the predictions started for that period (stats are below).
Earnings for Q1 and Q2 of 2020 also slipped, although they are supposed to grow 5.6% and 6.7%, respectively against the weak 2018 data, but growth is growth.
There was other big news this week. The Fed went to “Neutral” as I predicted they would. Things are just not bad enough to push them to cut a fourth time, until they see further worsening data. I’ll get into the interest rate outlook later.
Another big data point this week was Q3 GDP, which was 1.93% at the Seasonally Adjusted Annualized Rate level (SAAR, which is the “Headline Number”; they extrapolate one quarter forward for the year). You can see GDP peaked for Trump in the second quarter of 2018. The tax bill was signed into law by President Trump on December 22, 2017, which means that the cuts have not kept GDP from sliding. In part, that was because corporations were able to take repatriated funds and use it to buy back stock rather than INVEST in new businesses and new jobs. It was a stupid way to design the bill if the GOP’s intention was to stimulate the economy.

U.S. SAAR GDP Q3 Results Since Q4 2015
On an annualized basis, GDP also peaked in Q2 2018 at 3.2% and is now 2.0%. That is a Year/Year number, which smooths out the bumps. You can see the chart HERE. Click on the five year time frame. You’ll see that Y/Y GDP peaked under Obama in 2015, not under Trump.
“Tinkle Down Economics,” as I affectionately call the policy, failed under Reagan, G.W. Bush, and now, surprise, surprise, surprise, under Trump. Giving more money to the wealthy does not stimulate the economy enough to increase tax revenues to cover the cost. The deficit for 2019 is 26% above that for 2018 as I shared last week. Trump is driving up debt in a massive way through poorly directed tax cuts.
What the country needs is the widespread adoption of a strong profit sharing plan whereby loyal employees share in the profits just as shareholders do! I’ve written about the way my father treated his workers here before, and that is the model. You become wealthy (not gold and diamonds on the fixtures wealthy, but wealthy) AND your workers become wealthy. You make more, but they do well with you. Try it, you’ll like it! You’ll also probably have a better chance of ending up in the “Good Place.” 😉
Finally, job numbers were better than expected on Friday with big revisions of prior months as well. I covered that at StockTwits (see link below).
What is happening “Under the Hood” this week?
The “safe stuff” took a hit this week. Tech (XLK) has been the hands down leader off the Aug. 5th low followed by Financials (XLF), Industrials (XLI), and Utilities (XLU). Healthcare (XLV) was about market correlated, while behind were Consumer Staples (stuff you have to have; XLP), Real Estate (XLRE), Consumer Discretionary (stuff you like to have; XLY), Communications (XLC), and Materials (XLB) with Energy (XLE) coming in a distant last place.
I then looked at the rise off the Oct. 2nd low, and there is a somewhat different picture: The strongest sectors in the past month have been Financials, Tech, Healthcare and Industrials (they are very closely grouped with Financials and Tech just a hair above the other two). Safety continues to do poorly as was the case last week with XLU the worst. Better than worst from bottom up were XLRE and XLP, both safety plays. Then came XLY, and just under market correlated was XLE, which has been gaining strength and XLC and XLB which are almost exactly market correlated.
My stretch indicators say we could see another push up from here, but if the same pattern repeats from Feb., the gains will all be given back before the market resumes its climb.
Action Conclusions:
- Last week I said here that you could add equity exposure on a new market high, which occurred on Monday Oct. 28th. If you did buy, you are already up from there. Use a stop in my view. Sometimes the market will reverse off a marginal high, and the market is already stretched as just mentioned. I added some exposure at the last low, but still have cash to deploy on pullbacks.
- Safety has been “out” for a few weeks. It’s also had a huge multiple expansion. I am short XLP via puts. If interest rates continue to rise slowly or stay about flat, safety will continue to do badly.
- XLK has just broken to new highs. Having traded sideways for several months, the gains may not be over. Apple is still leading the way higher. If it reverses, watch your stops on new exposure. Tech has led prior bubbles to the highs, and it will likely do the same again. That’s where the growth and the margins are. QQQ is a tech correlated proxy although it is only about 40% tech the last time I looked.
- Note tech valuations are getting a bit stretched. MSFT was one example I have mentioned. I own some of it, but have trimmed my position to 28% of my Disney position. We all own MSFT in indexes too, don’t forget! Stretch in valuations does not mean the market cannot go higher. See sentiment below.
- We are not yet at the final market top of this Bull Market. Sentiment will help us see the top. It always has. Sentiment is one of the things no one can hide from us.
Let’s turn to the state of the market…
What would satisfy me that the Bulls are serious?
The Bull Market Health Score this week is Bulls 3.5/Bears 1.5 vs. Bulls 3.0/Bears 2.0 last week.
For each checklist item below, I give you the points scored as Bullish or Bearish.
1. New high? Bulls 1.0 Answer: New all time high. But stretched vs. trend. See the chart comments above the SPX chart.
2. V*IX trend favorable? Bulls 1.0 Answer: Yes. The VIX Game Score is Bulls 7/Bears 0 at a VIX of 12.30 (Friday close), which is below my “Bull Nirvana” number noted at the base of this report.
3. AD % Line in an Uptrend? (This is a proprietary stat; see base of report.): Bulls 1.0 point. Answer: Yes. The close was 16,866 vs. 16,825 last week. The only hesitation for further immediate gains is the lack of a new high above the 10-24-19 high.
4. Higher volume on Up Moves? Lower volume on Down moves? Bears 1.0 point. Answer: No. The down volume on Thursday was most impressive this week.
5. Is the “U.S. Index Matrix Signal,” as I call it, positive? Bulls 0.5 point. Answer : Neutral. Small caps and midcaps have to exceed the prior lower highs to confirm the further large cap move.
I looked at what the correlation is between my Bull Market Health Score and market performance here…(click the link to open the PDF; if you trust Microsoft’s WordPress, you can open it!) I’ve manipulated the numbers to get the two scales to match. There may be an easier way to do this, but in any case, the yellow line is the course of SPX, which is measured vs. its divergence from 3000, then is multiplied by 10. The Bull Market Health Score in blue is simply the score times 1000.
Bull Market Health Score Graph vs. SP500 Index Weekly Closes
You can see in the graph that the May low, which preceded the actual 6-03-19 low in the SPX was accompanied by a Score of 0. The first Score peak was at 3.0 and the next market decline, which came in August after Trump slammed China during the trade negotiations led to four Score’s of near zero or zero. The market had already bounced off a higher low on 8-29-19, but the Score was zero. If you waited for the next Score above zero (4.0) to show up on 9-06-19, the gain was 1.45% to the Sept top. The second Score of 4 in a row marked the Sept. high within a few points. One score of 4.0 on Oct. 11th did NOT mark a high. Of course, the limitation of the Score is in part due to the lack of day to day data to analyze. That would be something to look at.
More study is needed, but the Bull Market Health Score data do indicate that when the score is near zero, we should start looking for a bottom to show up (the market can still drop for a couple of weeks while the Score is low) and if it’s 3 or above, we should look for a top to show up, although even one Score of 4 does not necessarily mark a top. The score can be combined with other technical data perhaps and contribute to actionable entry/exit points.
Let’s check in on the context around the price action of the market by looking at the current Market Risks…
We have some new earnings data this week…
Earnings Risk/Opportunity: what is shown are the projections in the FactSet 3-15-19 report followed by the reports from 4-12-19 through 8-09-19 with a skip of two weeks until the 8-30-19 data resumes the weekly data sequence (details HERE)… The larger arrows “—>” indicate 3 weeks of of omitted data in order to compress the data. NOTE: 71% of SP500 Index companies have reported.
For Q2 2019, analysts are projecting earnings growth of 0.1% —> -1.3% -> —> -2.1% —> -2.6% -> -2.6% -> -3.0% -> -1.9% -> -2.6%-> -1.0% -> -0.7% -> -0.4% DONE
and revenue growth of 4.6% —> 4.3% —> 4.1% —> 3.8% -> 3.8% -> 3.7% -> 3.8% ->4.0% ->4.1% -> 4.1% -> 4.0% DONE
For Q3 2019, analysts are projecting earnings growth of 1.8% —> 0.8% —> 0.3% —> -0.5% —> -1.9% -> -2.2% -> -3.1% -> -3.5% -> -3.6% -> -3.7% -> -3.8% -> -3.7% -> -4.1% -> -4.6% -> -4.7% -> -3.7% -> -2.7%
and revenue growth of 4.4% —> 4.4% —> 4.2% —> 3.8% —> 3.2% -> 3.1% -> 3.0% -> 3.1% -> 2.9% -> 2.8% -> 2.8% -> 2.8% -> 2.8% -> 2.7% -> 2.6% -> 2.8% -> 3.1%
For Q4 2019, analysts are projecting earnings growth of 8.1% —> 7.5% —> 7.2% —> 6.3% —> 4.9% -> 4.5% -> 3.9% -> 3.5% -> 3.4% -> 3.2% -> 3.0% -> 2.9% ->2.6% -> 2.3% -> 1.5% -> 0.7% -> -0.4%
and revenue growth of 4.8% —> 4.8% —> 4.6% —> 4.3% —> 4.0%-> 4.0% -> 4.0% -> 4.0% -> 3.8% -> 3.7% -> 3.6% -> 3.6% -> 3.6% -> 3.5% -> 3.2% -> 3.0% -> 2.6%
For CY 2019, analysts are projecting earnings growth of 3.4% —> 3.2% —> 2.7% —> 1.7% -> 1.9% -> 1.5% -> 1.5% -> 1.4% -> 1.3% -> 1.3% -> 1.3% -> 1.2% -> 1.1% -> 0.7% -> 0.6% -> 0.3%
and revenue growth of 4.7% —> 4.7% —> 4.5% —> 4.4% -> 4.4% -> 4.3% -> 4.4% -> 4.3% -> 4.2% -> 4.1% -> 4.1% -> 4.1% -> 4.1% -> 4.0% -> 4.0% -> 4.0%
For Q1 2020, analysts are projecting earnings growth of 10.5% —> 9.8% —> 8.5% -> 8.2% -> 8.1% -> 7.9% -> 7.9% -> 7.8% -> 7.6% -> 7.3% -> 6.7% -> 6.0% -> 5.6%
and revenue growth of 6.2% —>5.8% —> 5.6% -> 5.7% -> 5.5% -> 5.5% -> 5.4% -> 5.4% -> 5.5% -> 5.3% -> 4.8% -> 4.7% -> 4.5%
For Q2 2020, analysts are projecting earnings growth of 13.3% —> 13.5% -> 12.0% ->12.6% -> 10.7 -> 9.9% -> 9.3% -> 9.2% -> 9.1% -> 9.0% -> 9.0% -> 8.7% -> 8.6% -> 7.7% -> 7.3% -> 6.7%
and revenue growth of 6.8% -> —> 6.6% -> 6.7% ->6.6% -> 6.5% -> 6.4% -> 6.5% -> 6.4% -> 6.4% -> 6.3% -> 6.3% -> 6.3% -> 5.9% -> 5.2% -> 5.2% -> 4.9%
For CY 2020, analysts are projecting earnings growth of 10.7% -> 10.6% -> 10.6% -> 10.6% -> 10.5% -> 10.6% -> 10.4% -> 9.9% -> 9.8%
and revenue growth of 5.6% -> 5.6% -> 5.6% -> 5.6% -> 5.7% -> 5.6% -> 5.3% -> 5.3% -> 5.3%
The earnings and revenue data was already discussed above!
Here’s a Brief Review of the Other Market Risks at Hand:
China Deal Risk: They have a consensus “on principles,” and say 60% of the deal could appear in the first agreement. We’ll have to wait and see if the market is going to like or be phased by the “Phase One Deal.”
Fed Rate Cut Risk: The Fed cut a third time and said it was done unless things get worse for the economy. Now the probability is 12.5% for a 4th cut in mid-December as assessed by CME Group. The risk was 22.1% last week.
As I’ve said previously: “THREE cuts is a mid-cycle adjustment. Four means they expect a recession.”
What about January? The odds of cut #4 or even #5 are 35.8% now vs 41.5% last week vs. 67% four weeks ago!
What about March? The odds are 45.7% vs. 46.3% last week vs. 75.1% four weeks ago for 4 or more cuts in total. Now 8.3% vs. 9.0% last week vs 10% four weeks ago vs 35.1% five weeks ago expect 5 or 6 cuts by then. In fact the 6 cut probability is still 0.5% (past 3 weeks). April? 52.7% vs. 50.1% last week vs. 79.7% four weeks ago expect there to be 4 or more cuts. A small minority, now 13.2% vs. 11.8% last week vs. 43.7% four weeks ago, expects the number of cuts to exceed four by April. June? 56.7% expect four or more cuts by then. July? 60.7% expect 4 cuts by then. What are the rest of the available “4 cut odds”? Sept. 2020? 65.2%. Nov. 2020? 69.3% Dec. 2020? 73.8%.
For now, that means over half of investors are still expecting a recession next year. The risk of recession is seen as rising as we move through 2020. They are ultimately worried about what I call a “Big Bear Market (click and scroll to definitions in blue).”
The Risk of a Neutral Fed: Oddly enough, but not surprisingly, the prior mantra of “Don’t fight the Fed” at least for the moment does not matter suddenly, now that the Fed has shifted to “Neutral” as I said they would. Trump wants more cuts to be sure he’ll be re-elected. Whether further rate cuts would do anything except goose the stock market higher is highly debatable.
The market is clearly front-running the improvement in the earnings/revenues data, even as the numbers for Q4 earnings have just turned negative for the first time this week.
My Investing Scenario as stated last week is still intact…
Current Scenario…
Things improve into year end (not so much! but they’ll ignore that, right?) and at the start of 2020 (economically, but also including the failure of Trump’s conviction after his successful impeachment along with some sort of China trade progress despite missing elements; a truce on escalation is in place), so the market rallies further. A final high is reached prior to the discounting of a recession, which brings on a ‘Big Bear Market.’ Got it? 😉 We may be moving into the final accent in the roller-coaster ride before you grab the bar tightly with both hands and drive all the blood out of them. 😉 Could there be some smaller bumps still? Of course there could, perhaps as Trump’s Senate trial approaches for example.
“Punchline: As I’ve argued on sentiment terms alone (though we don’t use just one factor), we have not reached the highest high we’ll see prior to the next recession and sizeable market decline.”
U.S. Iran War Risk: More stable after the leak of the “Iran Annihilation Plan HERE. No change this week. Some say there is a 50:50 risk of war with Iran. I don’t agree. I think they are dumb, but not that dumb. (not Iranians, the leaders there!) The dumb leaders should be pursuing freedom and economic improvement/success instead of terrorism and endless wars.
2020 Election Risk: Falling further. Why? Because Joe Biden is not raising much money, and in Iowa, Warren, Sanders and Buttigieg have take the lead by a narrow margin. I fully support gay right and marriage, because to me, that’s based in the Constitution. We all have freedom, or we are not a free nation. But I wondered if Buttigieg could succeed as a candidate in the general election. My conclusion? We could be surprised, as he was elected mayor in South Bend, Indiana. There are about 101,000 in South Bend and 319,000 in the metro area. It’s 60.5% white and 26.6% African American. (There are more whites and fewer blacks in the U.S. population as noted in a table HERE.) The median age is 33.3 years, which admittedly is younger than the national population at 38.1 yrs.
South Bend’s county (St. Joseph County) is split politically almost identically to our country. The Democrats have the edge, but not by much: “Hillary Clinton garnered about 47 percent of St. Joseph County’s vote on Tuesday, down from the 51 percent that Barack Obama posted here in 2012. Overall, Clinton beat Trump by only 200 votes in the county.” Ref. Mayor Pete Buttigieg won by 74% and 80% of the vote, respectively in 2011 and 2015. That’s impressive. He’s also a Harvard educated religious man who walks his talk, served in Afghanistan, and at age 37, he’s less likely to have a health issue get in his way than a number of the 70+ year old candidates. He speaks thoughtfully and coherently. He came out on top in the last debate. His performance in the first few states will either present an opportunity for him or cause his campaign to dwindle.
Other than Biden, all the serious Democrat candidates have tax policies that will tank corporate earnings and the market, at least for a while. And then we’d recover off the lows… Even Biden wants a corporate rate back up at 28%, which is too much in my view. Ours should match China’s at 25%, as a compromise.
Trump Impeachment Risk: Censure/Admonishment of Trump seems an unlikely path now. Trump will be impeached. Impeachment odds are easily above 95%. Conviction risk will only rise above 5% based on new evidence.
The GOP line is “it was not good what he did, but we don’t believe it’s enough to kick Trump out.” If anyone thinks there was no “quid pro quo” you’ve either not seen the Godfather, or lack any idea of what it was about. Mick Mulvaney even publicly admitted there was a “quid pro quo”! No one spells out “quid pro quos” when shady deals are made. They are always heavily implied just as in Trump’s case. His denial is a baldfaced lie. Trump lies just as Nixon and Clinton did.
Deficit/Debt Threat: Trump is now beating Obama at something! The size of his deficit! Read THIS. The deficit is up 26% to $964 Billion for fiscal 2019, the HIGHEST IN 7 YEARS!
I’ll leave this here as a monument to our monumental debt, which could threaten interest rates in the future. When rates rise, there will be “heck to pay.” The U.S. dollar remains at risk and having at least 5% gold exposure is a must in any portfolio. Some say higher, but owning stocks is also a hedge that over time would work out for solid companies, even in the face of very high inflation (not in the case of bankruptcies of course!).
Back to the charts…. See that the SP500 Index is now above that top yellow line. The last time the SP500 Index rose well above trend was going into the January 2018 Mini-Melt-up. Sentiment was off the roof. And then the market crashed into a violent correction in February. If the market keeps pushing above that top yellow line, there will be an eventual payback.
Now take a look at the SP500 chart. The green line is 2940.91, the
9-21-2018 High preceding the decline ending December 24th. The upper yellow line is now at about 3060, but rises slowly over time.
SP500 Large Cap Index (click chart to enlarge; SPX, SPY):
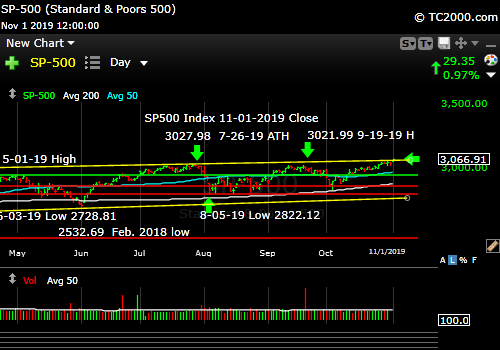
Over the top…by a little.
Now let’s check in on two “Canary Signals” we’ve been following:
“Intel-igent Market Timing Signal” (Intel; I*NTC; * there to throw off the crawlers!): Bullish. The close was 56.51 after a big breakout on earnings. This makes the Fed look correct about being in “Neutral” on rates. Two weeks ago: “Intel is above the prior key level of 50.50 at a 51.36 close, but a move above 53.50 failed previously, so a higher high than that is required for it to turn Bullish.” The June 4 high of 57.60 and the April high of 59.59 are the next tests.
Bank of America (BAC) Market Timing Signal: Bullish. The stock retrace tested the prior breakout above the July high and won… for now. The direction of rates will determine how far this rally goes.
Two weeks ago: “If the Fed is in fact lowering rates, it makes no sense to chase BAC. When they stop, and the economy is accelerating, it will be a buy. The Fed is starting to signal “one more and done,” which is what the market sees as a mid-cycle adjustment as occurred in 1995 and 1998 (max of 3 cuts). That would help stabilize the banks/financials (XLF).” The #Fed moved into neutral this week as predicted.
Keep up-to-date during the week at Twitter and StockTwits (links below) where a combined 34,144 investors are following the markets with me…
Follow Me on Twitter® Follow Me on StockTwits®. (real time messages are ONLY on StockTwits until Twitter reforms its policies, but we’ll have it as a backup system)
Join the Conversation in the StockTwits “MarketTiming” Room
Now let’s go on to review investor sentiment…
Survey Says!
Sentiment of individual investors (AAII.com) showed a Bull minus Bear percentage spread of +5.55% vs. +7.33% last week vs. +2.57% the week before! Hardly any movement in sentiment even at new market highs. THIS STILL HOLDS FROM LAST WEEK: “That is not that stretched to the Bullish side, so more upside is possible; however, I’d give the edge to the Bears here on sentiment, because the last time Bulls were at these levels was on July 17th and Sept. 18th, both very close to prior highs. Follow the market, up or down!” But try not to buy it when stretched as it is now. If you chase it, you must use a stop on new exposure in my view.
| Bulls | Neutrals | Bears |
| 33.98% | 37.59% | 28.43% |
| Thurs. 12 am CT close to poll | ||
2. U.S. Small Caps Market Timing (IWM):
Still rising… IWM is getting close to the top of the range, but it’s neutral for stocks in general as noted in the summary at the base of this report. IWM needs to break out above that aqua line. The small caps could easily rise to the high end of the range at that aqua line before pulling back. Above that line, the market would be expecting a full recovery of the economy’s growth trajectory.
Russell 2000 U.S. Small Cap Index (click chart to enlarge; IWM, RUT):

Moving to the prior high.
3. Gold Market Timing (GLD):
Things are shifting… We’ve gone from “recession risk” and “multiple cuts” as well as “don’t fight the Fed” to “Three cuts and done.” That raises the risk for the gold trade, because inflation is set to rise over the next few months. If the Fed lags inflation, gold wins, but if it front runs inflation, gold loses on a relative basis.
I’ve been warning you that…
“When inflation starts to rise again [and the Fed hikes rates] we MAY have to sell our trading positions in gold.”
By itself, the Fed declaring itself NEUTRAL would be negative for gold”
The Federal Reserve declared itself NEUTRAL and gold has yet to make a decision. Follow the decision!
Technicals: I said 3 weeks ago: “The G*LD trend will be negative below 139.35.” It tested 137.80 and then bounced. The close Friday was 142.56.
Summary still true: “Rate pressure on gold may not be done yet! Buy the lows, rather than chase bounces and use stops on current profits. As said, I keep a core GLD position at all times (do what works for you), but the trades will come and go. When things change, we change…” GLD must rise above the 10-25-19 high now. If it does, you may want to add to your long position. Use mental stops on your trading GLD position.
I’ve taken off some gold exposure because of the crosswinds on rates over the next 3-6 months.
The Gold ETF (click chart to enlarge the chart; GLD):

Above the triangle. More upside?
4. Interest Rate Market Timing (10 Year Treasury Yield; TNX, IEF, TLT):
I would still bet on somewhat higher rates over the short term with a “Neutral Fed.” I admit that since the market is still expecting the Federal Reserve to lean toward cutting, whether true or not, rates could just wobble around current levels for a while. If they rise, that would be negative for bonds/Treasuries, good for the dollar, and a negative for gold and gold stocks. That could also hurt interest rate sensitive investments like REITs and utilities, which have not been doing as well over the past month. (Gold could still work if inflation rises faster than the Fed reacts as said.)”
The initial reaction to the Fed statement was for rates to fall a bit more, although they bounced a bit on Friday. Why fall? Because the Fed is still behind the curve in lowering rates per the bond market. (not per me; I think rates are low enough. I don’t believe in negative real rates. They are a perversion of modern central banks.)
Downside for Rates: I’ll leave this here: “IF TNX skids further than it has, particularly to a new all time low, that means the bond market expects a U.S. recession, and a U.S. stock market crash (even if it happened slowly in a cascading fashion) could occur, particularly if there were a rapid ‘Negative Rate Shock’ as defined at the base of this report. It also imply the bond market felt the Fed was doing too little, lowering rates too slowly, and was risking economic slowing and deflation.”
Check out the “Market Signal Summary” below – after you review the following chart…
U.S. 10 Year Treasury Note Yield (click chart to enlarge; TNX, IEF, TYX, TLT, TBF):

Rates still have room to rise on a “Neutral Fed.”
Now let’s review three key market timing signals together….
Do not use these signals as a trading plan. They are rough guidelines. I currently share my BUYS and SELLS in as timely a way as possible on social media (links above).
MY MARKET SIGNAL AND TREND SUMMARY for a Further U.S. Stock Market Rally with Real GDP Growth (“Real” means above inflation):
Stock Signal YELLOW for a further U.S. stock market rally with a Bullish SP500 Index trend. The stock signal is based on small caps, as they often lead the market down. Small caps are moving up within a range, the top of which was established on Feb. 25th. Above there, the Bull will be back in full.
The V*IX (which relates to SPX volatility; * added to symbol to throw off the webcrawlers!) Game Score is scored as 7 points running from a VIX high of 17.89 (point 1 for the Bulls) down to 13.31 (Point 7 for the Bulls). The VIX Game Score is Bulls 7/Bears 0 at a VIX of 12.30 (Friday close). The close was in the mid-range of what I previously called the “bonus number.” (12.17-12.37)
The ‘Bull Nirvana Target’ is 13.31.” (That is target #7 for the Bulls.) We’re below that number!
Gold Signal YELLOW for a further U.S. stock market rally with a NEUTRAL Gold Trend. What gold does mostly as I’ve written HERE is follow real interest rates around the world (if you own “gold in dollar terms” you care about U.S. rates most of all). The rest of the world does matter however, including massive buying by central banks.
From before: “Remember GLD is being used as an indicator for the ECONOMY here.” If gold continues to rise, it means the market believes real rates will fall, which in the current context means the global economy is slowing. That will ultimately hurt U.S. stocks.
Rate Signal NEUTRAL for a further stock market rally with a long term BEARISH and short term Neutral 10 Year Yield Trend. (Remember: lower rates mean higher bond and Treasury prices) I said last week: “Rates could rise further on a neutral Fed this week.” In fact they have fallen a bit since the Weds Fed statement. The bond market believes the economy is headed toward a recession in 2020.
I’ll add this reminder from 9-20-2019’s issue cited above: “Remember, FOUR Fed cuts will NOT be a “mid-cycle adjustment” and would be taken badly by the market ironically, considering the market’s addiction to lower rates. ***A fourth cut means the Federal Reserve is seeing recession risk as significantly high.***”
Also for Reference: “Rates usually RISE slowly in a strong recovery and the stock market rally continues as they rise, as I’ve repeated multiple times on social media and here. Empirically though, rates that are “lower” (than 3.11%) and are NOT rising rapidly have allowed the market to rise.”
I said weeks ago, “Watch the oil price too. Higher oil tends to mean higher rates.” It closed at 56.23 vs. 56.66 last week. Still holds: If it rises above 58.82 and then 60.94, oil and oil stocks will be off to the races. 63.38 would be the next target. Since May, the price of oil almost appears to have been managed to stay between 50 and 59/barrel. I wonder why? 😉
Just a reminder: If TNX bounces too quickly and too high, this will give rise to Rate Shock III… As said before: “Watch the rate at which TNX climbs if the current trend reverses. If it shoots up very fast, stocks will correct.” In the Sept. 28th issue: “A rapid push higher in rates would mean trouble for stocks, as occurred in early 2018. That’s what I called ‘Rate Shock.'” The period of rising rates in early October I called #RateShockII.
Another Reminder: “The risk lately has been ‘Negative Rate Shocks.’ (Not negative rates in the U.S. yet! “Negative” refers to the direction of the shock.) First we had ‘Negative Rate Shock I’ in December 2018 (because rates FELL while the Fed raised the Fed Funds rate 0.25% in mid-December, in what was perceived as a policy error by critics), ‘Negative Rate Shock II’ in May, and ‘Negative Rate Shock III’ in August, which is on pause and awaiting the next pivot. The Stock Market Bulls had better hope that they don’t get more rate cuts past October.
Thank you for reading. Would you please leave your comments below where it says “Leave a Reply”… or ask a question or report a typo…
Pay it forward by sending the link to MarketTiming.Blog (that link will immediately connect them to this webpage) to a relative or friend. Thanks for doing that.
Be sure to visit the website for more general investing knowledge at:
Standard Disclaimer: It’s your money and your decision as to how to invest it.
I thank Worden Brothers for the charting system I use to post these charts. If you want to know more about the charting system I use every day, contact me. It makes it much easier to follow along with me if you can see the charts and manipulate them on your own computer. It’s a great investment to have an excellent charting system.
Note: I’ve updated my criteria for the equity signal for a further U.S. stock market rally to the following: GREEN = Bullish, YELLOW = Neutral, RED = Bearish. In other words, the colors tell you whether the signal supports the stock rally or not, while the Bullish, Neutral, and Bearish designations are about the trend.
A BEARISH trend signal does not mean we should not buy. A BULLISH trend signal does not mean you cannot sell some exposure. It depends on what is going on in the economy and how oversold/overbought the market is at a given point whether the Bearish signal is to be sold or bought, sold on the next bounce, etc. and whether a Bullish signal is to be bought or if profits should be taken. A NEUTRAL trend signal does not mean the end of the Bull or Bear. It means to wait and look for possible subsequent entry points within the existing trend, Bull or Bear, but preserve capital if the entry fails. Our strong intention is to buy low and sell high. By the way, I will keep showing the prior orange “Trigger lines” in the IWM and GLD charts for now as reference points only; they have historical value for us from the post-2016 election period.
Copyright © 2019 By Wall Street Sun and Storm Report, LLC All rights reserved.
