A Market Timing Report based on the November 8, 2019 Close, published Saturday, November 9th, 2019…
I deliver focused comments on market timing once a week. These are supplemented with daily “Tweets/StockTwits” (see links below) and comments in the “markettiming” room on StockTwits.
I provide quite a bit of intraweek commentary, and if you don’t see it, you will miss out on quite a bit of context, so please click on the social media links below and have a read… Thank you as always for being loyal readers and interacting on social media with your questions and comments!
1. SP500 Index Market Timing (S&P 500 Index®; SPY, SPX):
Now that 89% of companies have reported their results for Q3, the earnings growth rate improved to -2.4% this week from -2.7% per FactSet (data below). For the year, earnings will be up a measly 0.1% vs. last year. That’s called “flat” and with revenues up only 4% on obviously worse profit margins (that’s what eats away the earnings), and if the stock market value is ultimately determined by what companies can earn on what they sell, why is the stock market up 10.22% Year over Year (Y/Y)?
Earnings for Q1 and Q2 of 2020 also slipped again, but are 5.3% and 6.6%, respectively, for each quarter. Not so for Q4 of 2019 which started Oct. 1st. Earnings predictions turned more negative this week (see Earnings section below). Is the market going to look past yet another quarter of absent to negative earnings growth?
Q3 2019 (the quarter nearly done being reported) will be the third quarter in a row reported by FactSet of NEGATIVE earnings growth. Is there simply no place else to go but into stocks to find yield? And when does the whole thing collapse on itself? We know Trump has bought time with his tax cut stimulus that instead of generating higher tax revenue has increased the 2019 deficit 26% above the 2018 deficit! This is a game being played with our future as a nation. In the end, the world will call our bluff.
A bit later I’ll comment on why the U.S. market gains, if any are accrued from here on, could evaporate…
Speaking of the world Ex-U.S., now that the rest of the world is due to pick up in the coming quarters, money will be leaving the U.S. markets or at least not going entirely to them, and will be ending up in places like Europe, Japan, and even China. The move has already started. Some still see negative things happening for China, but indexes like FXI and KWEB tell a different story. I admit the trend of FXI is more up in a longer term sideways move until proven otherwise, but at least one higher high was established for FXI and two for KWEB. EWJ (Japan) has been trending up since early 2019. Slowly but surely. The trend there is stronger than for FXI.
Are you aware that since around July 19th, EWG has been tracking XLK (US Tech sector of SPX), and EWJ has been BEATING XLK? The dividend for EWG is just over DOUBLE the yield for XLK too (2.59% vs. 1.23%), so you could have made more money in German stocks since July than in U.S. tech. I bet you did not hear that this week on CNBC did you?
Germany’s economy has been in a slump, and continued strength in EWG will depend on improvement showing up in the next few quarters, but I have started an initial position that I will add to mostly on pullbacks within a continued up trend. If the signals change, I’ll be out and move the money elsewhere.
Currently as said on social media (see StockTwits link below), I’m over-invested in the U.S. and under-invested everywhere else in terms of “usual maximum exposure.” That has been a good choice to date, but as just said, things look like they are changing. Even with the recent small EWG add, I am only 11% exposed to foreign developed countries vs. my usual maximum exposure. Some of that is U.K. exposure. Although EWU is off the Brexit low of 2016, it has not established a clear up trend yet. There is only a short term up trend at the moment. The British need to get their act together as a nation and then we could see a decent recovery.
By the way, I don’t share raw exposure levels, because you need to think for yourself and tailor what you do to your situation. The most aggressive allocation would be 1/2 US and 1/2 Non-US, but many advisors suggest a greater weight in U.S. stocks. “It’s your money and your decision as to how to invest it,” as I like to say.
What is happening “Under the Hood” this week?
It was obvious, but many investors don’t follow anything but stocks. That’s a mistake. Interest rates broke out above the prior high for TNX (10 Year Treasury Yield) this week. And the breakout stuck on Friday. I need another day of confirmation and so apparently does the gold market, as gold stocks are on the brink of a breakdown of the prior trend. Yes, all this could reverse on a horrific Trump revelation etc., but we cannot invest based on potential minefields. No one would ever go to battle, would they, if they said “Captain, I’m not going across that field if there could be mines!”?
My major insight for the week (beyond my seeing the US stock market is stretched) may seem simplistic, but it explains the market and what it is doing. Interest rates are the main thing we should be watching to determine where to invest. GDP and earnings growth rates have been failing to impact the market trend for many months despite material slowing of both.
So what are the choices for rates?
1. Rates continue to rise. The Federal Reserve will eventually have to raise rates if the economy continues to improve vs. slow (as it has been doing lately and will be into year end 2019). That is OK as long as the growth is there, but it’s a big negative if it is not. Look at how the market reacted to a 0.25% hike in rates in mid-December 2018!
But hear this clearly and remember it: Slowly rising rates are the hallmark of an improving economy. At the same time, realize that over the span of this economic cycle while rates have been kept low for a long time, distortions have appeared that can threaten the continuation of the expansion, not to mention the rising costs of employing people when companies are running out of qualified candidates. That reduces profits and slows the growth of the economy. The Fed has to fight inflation at the end of a cycle and raises rates. Most new businesses depend on good economic growth to succeed, and low rates help a lot, while higher rates are an impediment.
2. Rates fall. IF the Federal Reserve does not lower rates and change their current Neutral stance should the economy slow materially from here, and should TNX fall substantially, the stock market will fall hard. Realize that lowering rates further from here may not even help, so a fourth cut could mean the end of the Bull market. Could. Maybe it’s the 5th cut that does it, but you understand the point. If the Fed has to cut rates materially from here, it means the risk of recession has risen dramatically in their mind. Since they seem to be erring on the side of NOT lowering rates too much, in my view, a 4th or 5th cut would mean the risk of recession will then be substantial.
3. Rates stay about the same – relatively low. Generally nothing stays completely flat, but if rates rise and fall gently and slowly within a range of the current 1.9ish%, the stock market should be OK with that. IF rates stop climbing, financials may not love that, but the Fed has been steepening the yield curve lately by buying lots of short term paper, which is helping them.
What are the other “Under the Hood” Revelations?
The “safe stuff” took a hit yet again this week. Tech (XLK) has been the leader off the Aug. 5th low, followed by the Financials (XLF) just ahead of the Industrials (XLI). Everything else ran behind the SP500 Index. Of note, XLE has moved out of last place, which was taken over by Real Estate (REITs; XLRE) and utilities (XLU).
The picture since Oct. 2nd has changed too this week. The strongest sectors in the past 5 weeks have been Financials followed by Tech and Industrials, and then barely better than SP500 Index were closely grouped XLV, XLB, and XLE. Safety continues to do poorly since Oct. 24th with XLU and XLRE running close together as the worst two sectors. Better than worst was XLP, but it was still weak, and XLY was better than XLP, but also weaker than the SPX. XLC (Communications) was about market correlated.
I closed those XLP puts for a gain of 26% vs. money at risk this past week. Booking profits on shorts and revisiting the trade often works better than simply riding a trade to the end. I was running out of time on those options too, so it was best to close them. Safety could come back into favor too, IF rates (TNX) slip and reverse course instead of making new highs from here.
Rising rates and a widening spread of interest rates helps the financials. On cue, they have outperformed. IF this trend does not continue, they won’t keep their current short term lead. Bears could in fact say this would be the perfect spot for them to fail. The 2-2-18 high was 30.33 and we’re at a Friday close of 29.84. Close enough. If you see them break out, it means the market feels the recovery can continue/will resume despite Q4 slowing of GDP.
Still true: My stretch indicators (“Super Stretched Stocks”) say we could see another push up from here, but if the same pattern repeats from Feb., the gains will all be given back before the market resumes its climb.
The “Badly Behaving Stocks” are rising in numbers off the recent low. That’s another sign this market may be due for a pause at least.
Action Conclusions:
- Even Jim Cramer, who seems to many to be the ultimate perma-Bull, because he is often chasing high valuation stocks higher (not bad until they blow up) was saying to take profits this week. If you are over-exposed to equities, this would be a time to rebalance by taking profits and distributing them to other pots. That way, you can add back to stocks should we get a pullback. Buy lower, sell higher – that is the method of lowering exposure when things are stretched to take advantage of pullbacks that I coined as “Passive Shorting.” (Google “Passive Shorting” and it should be at the top.)
- We are not yet at the final market top of this Bull Market. It’s not likely anyway, because sentiment is still not maxed out.
Let’s turn to the state of the market…
What would satisfy me that the Bulls are serious?
The Bull Market Health Score this week is Bulls 4.0/Bears 1.0 vs. Bulls 3.5/Bears 1.5 last week.
For each checklist item below, I give you the points scored as Bullish or Bearish.
1. New high? Bulls 1.0 Answer: New all time closing high. But stretched vs. trend.
2. V*IX trend favorable? Bulls 1.0 Answer: Yes. The VIX Game Score is Bulls 7/Bears 0 at a VIX of 12.07 (Friday close), which is below my “Bull Nirvana” number noted at the base of this report. The Bulls also took the “bonus” VIX point that I used to refer to in my score. The 2018 low was 10.17, so there is still room to fall. It was 8.56 in 2017, but earnings were better then and lots of growth was anticipated under the Trump tax cuts.
3. AD % Line in an Uptrend? (This is a proprietary stat; see base of report.): Bulls 1.0 point. Answer: Yes. The close was 16,883 vs. 16,866 last week.
4. Higher volume on Up Moves? Lower volume on Down moves? Bears 0.5 point. Answer: No. The bumps up in volume have been on down days lately. The Friday 0.26% gain came on decreased volume vs. the prior day. That said, the weekly volume has been rising for the past two weeks as the market has risen a bit.
5. Is the “U.S. Index Matrix Signal,” as I call it, positive? Bulls 0.5 point. Answer : Neutral. Small caps have not broken above the longer term range while mid caps have for 5 days – but not by much. The mid cap breakout could reverse itself next week. Could. A small cap breakout would mean the market upside is not done.
Let’s check in on the context around the price action of the market by looking at the current Market Risks…
We have some new earnings data this week…
Earnings Risk/Opportunity: what is shown are the projections in the FactSet 3-15-19 report followed by the reports from 4-12-19 through 8-09-19 with a skip of two weeks until the 8-30-19 data resumes the weekly data sequence (details HERE)… The larger arrows “—>” indicate 3 weeks of of omitted data in order to compress the data. NOTE: 89% of SP500 Index companies have reported.
For Q2 2019, analysts are projecting earnings growth of 0.1% —> -1.3% -> —> -2.1% —> -2.6% -> -2.6% -> -3.0% -> -1.9% -> -2.6%-> -1.0% -> -0.7% -> -0.4% DONE
and revenue growth of 4.6% —> 4.3% —> 4.1% —> 3.8% -> 3.8% -> 3.7% -> 3.8% ->4.0% ->4.1% -> 4.1% -> 4.0% DONE
For Q3 2019, analysts are projecting earnings growth of 1.8% —> 0.8% —> 0.3% —> -0.5% —> -1.9% -> -2.2% -> -3.1% -> -3.5% -> -3.6% -> -3.7% -> -3.8% -> -3.7% -> -4.1% -> -4.6% -> -4.7% -> -3.7% -> -2.7% -> -2.4%
and revenue growth of 4.4% —> 4.4% —> 4.2% —> 3.8% —> 3.2% -> 3.1% -> 3.0% -> 3.1% -> 2.9% -> 2.8% -> 2.8% -> 2.8% -> 2.8% -> 2.7% -> 2.6% -> 2.8% -> 3.1% -> 3.2%
For Q4 2019, analysts are projecting earnings growth of 8.1% —> 7.5% —> 7.2% —> 6.3% —> 4.9% -> 4.5% -> 3.9% -> 3.5% -> 3.4% -> 3.2% -> 3.0% -> 2.9% ->2.6% -> 2.3% -> 1.5% -> 0.7% -> -0.4% -> -1.1%
and revenue growth of 4.8% —> 4.8% —> 4.6% —> 4.3% —> 4.0%-> 4.0% -> 4.0% -> 4.0% -> 3.8% -> 3.7% -> 3.6% -> 3.6% -> 3.6% -> 3.5% -> 3.2% -> 3.0% -> 2.6% -> 2.6%
For CY 2019, analysts are projecting earnings growth of 3.4% —> 3.2% —> 2.7% —> 1.7% -> 1.9% -> 1.5% -> 1.5% -> 1.4% -> 1.3% -> 1.3% -> 1.3% -> 1.2% -> 1.1% -> 0.7% -> 0.6% -> 0.3% -> 0.1%
and revenue growth of 4.7% —> 4.7% —> 4.5% —> 4.4% -> 4.4% -> 4.3% -> 4.4% -> 4.3% -> 4.2% -> 4.1% -> 4.1% -> 4.1% -> 4.1% -> 4.0% -> 4.0% -> 4.0% -> 4.0%
For Q1 2020, analysts are projecting earnings growth of 10.5% —> 9.8% —> 8.5% -> 8.2% -> 8.1% -> 7.9% -> 7.9% -> 7.8% -> 7.6% -> 7.3% -> 6.7% -> 6.0% -> 5.6% -> 5.3%
and revenue growth of 6.2% —>5.8% —> 5.6% -> 5.7% -> 5.5% -> 5.5% -> 5.4% -> 5.4% -> 5.5% -> 5.3% -> 4.8% -> 4.7% -> 4.5% -> 4.5%
For Q2 2020, analysts are projecting earnings growth of 13.3% —> 13.5% -> 12.0% ->12.6% -> 10.7 -> 9.9% -> 9.3% -> 9.2% -> 9.1% -> 9.0% -> 9.0% -> 8.7% -> 8.6% -> 7.7% -> 7.3% -> 6.7% -> 6.6%
and revenue growth of 6.8% -> —> 6.6% -> 6.7% ->6.6% -> 6.5% -> 6.4% -> 6.5% -> 6.4% -> 6.4% -> 6.3% -> 6.3% -> 6.3% -> 5.9% -> 5.2% -> 5.2% -> 4.9% -> 5.0%
For CY 2020, analysts are projecting earnings growth of 10.7% -> 10.6% -> 10.6% -> 10.6% -> 10.5% -> 10.6% -> 10.4% -> 9.9% -> 9.8% -> 9.7%
and revenue growth of 5.6% -> 5.6% -> 5.6% -> 5.6% -> 5.7% -> 5.6% -> 5.3% -> 5.3% -> 5.3% -> 5.4%
The earnings and revenue data was already discussed above!
Here’s a Brief Review of the Other Market Risks at Hand:
China Deal Risk: No Change. The overall market has ignored it, while the companies effected by it have been held back. Even those are now recovering (including 5 G companies which are part of the positive narrative) as trade tensions dissipate. They have a consensus “on principles,” and say 60% of the deal could appear in the first agreement.
Fed Rate Cut Risk: The Fed cut a third time and said it was done unless things get worse for the economy. Now the probability is 3.7% for a 4th cut in mid-December as assessed by CME Group. The risk was 12.5% last week and 22.1% 2 weeks ago.
As I’ve said previously: “THREE cuts is a mid-cycle adjustment. Four means they expect a recession.”
What about January? The odds of cut #4 or even #5 are 14.3% vs. 35.8% last week vs 67% five weeks ago!
What about March? The odds are 23.8% vs. 45.7% last week vs. 75.1% five weeks ago for 4 or more cuts in total. Now 1.9% vs. 8.3% last week vs 10% five weeks ago vs 35.1% six weeks ago expect 5 cuts by then.
April? 28.8% vs 52.7% last week vs. 79.7% five weeks ago expect there to be 4 or more cuts. A small minority, now 3.4% vs. 13.2% last week vs. 43.7% five weeks ago, expects the number of cuts to exceed four by April. June? 32.8% vs. 56.7% last week expect four or more cuts by then. July? 38.7% vs. 60.7% expect 4 cuts by then. What are the rest of the available “4 cut odds”? Sept. 2020? 38.7% vs. 65.2% last week. Nov. 2020? 41.6% vs. 69.3% last week. Dec. 2020? 45.2% vs. 73.8% last week.
For now, that means a minority of investors believe that recession is not on the schedule for 2020. The risk of recession is seen as rising from now as we move through 2020, but does not rise above 50%. The minority is ultimately worried about what I call a “Big Bear Market (click and scroll to definitions in blue).”
The Risk of a Neutral Fed: Same. Oddly enough, but not surprisingly, the prior mantra of “Don’t fight the Fed” at least for the moment does not matter suddenly, now that the Fed has shifted to “Neutral” as I said they would. Trump wants more cuts to be sure he’ll be re-elected. Whether further rate cuts would do anything except goose the stock market higher is highly debatable.
New: The risk is likely going to be on the side of inflation, because the Fed does not want to make a mistake by hiking too early again and kill the recovery and thereby interfere with Trump’s re-election in an obvious way. That means inflation related assets (think oil) should do well in the coming 3-6 months or perhaps more. Gold will do well too if the Fed is slow (see below) to react, although gold is on the edge of a breakdown. It must rally from here.
My Investing Scenario as stated several weeks ago is still intact…
Current Scenario…
Things improve into year end (not so much as you’ve seen, but they’ll ignore that, right?) and at the start of 2020 (economically, but also including the failure of Trump’s conviction in Dec. or Jan. after his successful impeachment along with some sort of China trade progress despite missing elements), so the market rallies further. A final high is reached prior to the discounting of a recession, which brings on a ‘Big Bear Market.’ Got it? 😉 Could there be some smaller bumps still? Of course there could, perhaps as Trump’s Senate trial approaches for example.
U.S. Iran War Risk: No change this week. More stable after the leak of the “Iran Annihilation Plan HERE.
2020 Election Risk: Falling further. Why? Because the risk that a moderate fails to be nominated by the Democrats has risen. Why? Because Michael Bloomberg is going to enter the race it is said, and he’ll steal votes from Biden, who could then lose the nomination to a coalition formed by Sanders and Warren. There is no proof of it, but think about it. What does Bernie really want if he’s sincere? He wants his program enacted. He could run as Presidential candidate with Warren as VP in case he has a lethal 2nd heart attack.
Sanders and Warren together could win the nomination for Bernie and steer the Democratic Party into a liberal ditch. After all Warren is nothing but a wannabe Bernie, more or less. She’s been in the Senate for 6 years. Bernie has been in Congress since the early 1990’s when I met him on a meridian in South Burlington, VT when he was running for Congress (and Bernie saved my life as the story goes – I nearly left the conversation and walked into 50 MPH traffic; he grabbed my shoulder! Thanks Bern! ;)).
Trump will beat them though, (unless he gets himself into even more trouble!) because the 46% of Independents won’t want a socialist state established with a massive healthcare plan without choice they want to force down our throats. Yeah, Bern and I don’t agree on that. That’s exactly what we were talking about on that Saturday back in 1992! I realized this “Liberal Conquest Scenario” a while back. One will drop out…for the Presidential slot and the other will be the VP candidate. Maybe they can flip a coin? 😉 Don’t tell them though please, as they might actually win if the anti-Trump sentiment is too high.
Trump Impeachment Risk: No change. Censure/Admonishment of Trump seems an unlikely path now. Trump will be impeached. The Dems want the man labeled. “Impeached in the U.S.A.” And he probably deserves it, as Clinton did for his odious behavior and lying. Impeachment odds are easily above 95%. Conviction risk will only rise above 5% based on new evidence as I’ve said.
The GOP line is “it was not good what he did, but we don’t believe it’s enough to kick Trump out.” There WAS a quid-pro-quo, period, but they don’t want to kick Trump out for his antics, which may in fact have been unconstitutional. Subverting the will of Congress has been done before, so no biggie! Obama did it by sending blankets instead of the lethal aid that Congress approved is what the boot licking Rand Paul is saying. The way this is headed, Trump will NOT be convicted and he’ll use that in his commericials.
Deficit/Debt Threat: Trump is now beating Obama at something! The size of his deficit! Read THIS. The deficit is up 26% to $964 Billion for fiscal 2019, the HIGHEST IN 7 YEARS!
I’ll leave this here as a monument to our monumental debt, which could threaten interest rates in the future. When rates rise, there will be “heck to pay.” The U.S. dollar remains at risk and having at least 5% gold exposure is a must in any portfolio. Some say higher, but owning stocks is also a hedge that over time would work out for solid companies, even in the face of very high inflation (not in the case of bankruptcies of course!).
Back to the charts…. See that the SP500 Index is now above that top yellow line. AS BEFORE: The last time the SP500 Index rose well above trend was going into the January 2018 Mini-Melt-up. If the market keeps pushing above that top yellow line, there will be an eventual payback. Sentiment will be a guide.
Now take a look at the SP500 chart. The green line is 2940.91, the
9-21-2018 High preceding the decline ending December 24th. The upper yellow line is now at about 3058 at the Friday close.
SP500 Large Cap Index (click chart to enlarge; SPX, SPY):

Stretched.
Now let’s check in on two “Canary Signals” we’ve been following:
“Intel-igent Market Timing Signal” (Intel; I*NTC; * there to throw off the crawlers!): Bullish. The June 4 high of 57.60 has been exceeded, and the April high of 59.59 is the next test of a new all time high.
Bank of America (B*AC) Market Timing Signal: Bullish. There have been 3 closes above 32.77, the early 2018 high. This is a major breakout if it holds. It will only hold if rates keep climbing.
Keep up-to-date during the week at Twitter and StockTwits (links below) where a combined 34,144 investors are following the markets with me…
Follow Me on Twitter® Follow Me on StockTwits®. (real time messages are ONLY on StockTwits until Twitter reforms its policies, but we’ll have it as a backup system)
Join the Conversation in the StockTwits “MarketTiming” Room
Now let’s go on to review investor sentiment…
Survey Says!
Sentiment of individual investors (AAII.com) showed a Bull minus Bear percentage spread of +16.37% vs. +5.55% last week. Finally, the Bulls are recruiting believers, but they’ve also reached levels of prior pullbacks on the Bullish side (see social media link). This fits with the trend of SPX being stretched here and subject to a loss of further gains from here.
| Bulls | Neutrals | Bears |
| 40.30% | 35.77% | 23.93% |
| Thurs. 12 am CT close to poll | ||
2. U.S. Small Caps Market Timing (IWM):
Bad sign that IWM could not break out with the large caps continuing their climb or even match the midcap breakout. If you see a breakout, it will be a positive sign for at least another Bullish stretch before the next decline.
Russell 2000 U.S. Small Cap Index (click chart to enlarge; IWM, RUT):

Small caps not breaking out. If they do, it would be very positive.
3. Gold Market Timing (GLD):
No change. Gold has already slipped below support and the only reason I did not sell the rest of my trading position is because gold stocks did not break down.
SAME: Things are shifting… We’ve gone from “recession risk” and “multiple cuts” as well as “don’t fight the Fed” to “Three cuts and done.” That raises the risk for the gold trade, because inflation is set to rise over the next few months.
MAJOR POINT: IF the Fed lags inflation, gold wins, but if it front runs inflation, gold loses on a relative basis. My contention is that Federal Reserve bias will now be against raising rates prior to the election, so inflation will get a boost! Gold wins…but it must perform on the charts to prove it!
I’ve been warning you that…
“When inflation starts to rise again [and the Fed hikes rates] we MAY have to sell our trading positions in gold.”
By itself, the Fed declaring itself NEUTRAL would be negative for gold” It WAS!
Technicals: I said 3 weeks ago: “The G*LD trend will be negative below 139.35.” It tested 137.80 and then bounced. The close Friday was 137.39. If you sold the rest, I don’t blame you, but Monday will be a stronger “tell” IMO.
Still true: GLD must rise above the 10-25-19 high now. If it does, you may want to add to your long position. Use mental stops on your trading GLD position.
The Gold ETF (click chart to enlarge the chart; GLD): That top red line is 137.80.
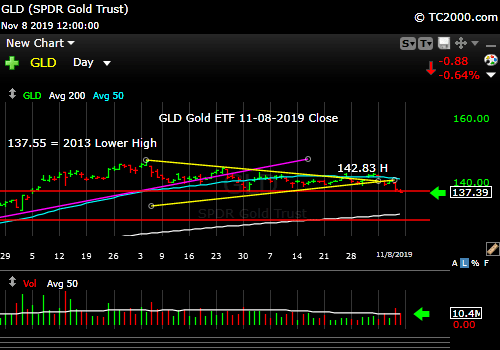
Gold is breaking down. Will gold stocks now follow and confirm the break?
4. Interest Rate Market Timing (10 Year Treasury Yield; TNX, IEF, TLT):
Last week:
“I would still bet on somewhat higher rates over the short term with a “Neutral Fed.”
This week we had a breakout in rates to a higher high over the 1.903% prior high. That turns the short term trend UP. Until it reverses, it’s up! When and if it reverses, I’ll reverse my stance.
Check out the “Market Signal Summary” below – after you review the following chart…
U.S. 10 Year Treasury Note Yield (click chart to enlarge; TNX, IEF, TYX, TLT, TBF): Rates broke out vs. the Sept. high this week. That is 2 closes above; one more would be nice. And no quick reversal!
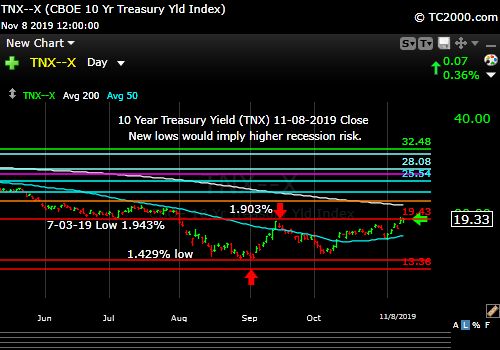
Rates breaking out.
Now let’s review three key market timing signals together….
Do not use these signals as a trading plan. They are rough guidelines. I currently share my BUYS and SELLS in as timely a way as possible on social media (links above).
MY MARKET SIGNAL AND TREND SUMMARY for a Further U.S. Stock Market Rally with Real GDP Growth (“Real” means above inflation):
Stock Signal YELLOW for a further U.S. stock market rally with a Bullish SP500 Index trend. The stock signal is based on small caps, as they often lead the market down. Small caps are moving up within a range, the top of which was established on Feb. 25th. Above there, the Bull will be back in full.
The V*IX (which relates to SPX volatility; * added to symbol to throw off the webcrawlers!) The VIX Game Score is scored as 7 points running from a VIX high of 17.89 (point 1 for the Bulls) down to 13.31 (Point 7 for the Bulls).
The VIX Game Score is Bulls 7/Bears 0 at a VIX of 12.07 (Friday close).
The ‘Bull Nirvana Target’ is 13.31.” (That is target #7 for the Bulls.) We’re below that number!
Gold Signal YELLOW for a further U.S. stock market rally with a NEUTRAL Gold Trend. One could argue that I should change the trend to Bearish this week, but I’m waiting for Monday to see if gold stocks confirm this move.
What gold does mostly as I’ve written HERE is follow real interest rates around the world (if you own “gold in dollar terms” you care about U.S. rates most of all). The rest of the world does matter however, including massive buying by central banks.
Remember, gold may be down but not yet out, because if the Fed lags inflation, gold will win.
From before: “Remember GLD is being used as an indicator for the ECONOMY here.” If gold continues to rise, it means the market believes real rates will fall, which in the current context means the global economy is slowing. That would ultimately hurt U.S. stocks.
Rate Signal NEUTRAL for a further stock market rally with a long term BEARISH and short term Bullish 10 Year Yield Trend. (Remember: higher rates mean lower bond and Treasury prices). That’s a change of the short term trend.
I’ll leave this reminder from 9-20-2019’s issue: “Remember, FOUR Fed cuts will NOT be a “mid-cycle adjustment” and would be taken badly by the market ironically, considering the market’s addiction to lower rates. ***A fourth cut means the Federal Reserve is seeing recession risk as significantly high.***”
Also for Reference: “Rates usually RISE slowly in a strong recovery and the stock market rally continues as they rise, as I’ve repeated multiple times on social media and here. Empirically though, rates that are “lower” (than 3.11%) and are NOT rising rapidly have allowed the market to rise.”
I said weeks ago, “Watch the oil price too. Higher oil tends to mean higher rates.” It closed at 57.24 vs. 56.23 last week. Still holds: If it rises above 58.82 and then 60.94, oil and oil stocks will be off to the races. 63.38 would be the next target. Since May, the price of oil almost appears to have been managed to stay between 50 and 59/barrel. I wonder why? 😉
Just a reminder: If TNX bounces too quickly and too high, this will give rise to Rate Shock III… As said before: “Watch the rate at which TNX climbs if the current trend reverses. If it shoots up very fast, stocks will correct.” In the Sept. 28th issue: “A rapid push higher in rates would mean trouble for stocks, as occurred in early 2018. That’s what I called ‘Rate Shock.'” The period of rising rates in early October I called #RateShockII.
Another Reminder: “The risk lately has been ‘Negative Rate Shocks.’ (Not negative rates in the U.S. yet! “Negative” refers to the direction of the shock.) First we had ‘Negative Rate Shock I’ in December 2018 (because rates FELL while the Fed raised the Fed Funds rate 0.25% in mid-December, in what was perceived as a policy error by critics), ‘Negative Rate Shock II’ in May, and ‘Negative Rate Shock III’ in August. The Stock Market Bulls had better hope that they don’t get more rate cuts past October.”
Thank you for reading. Would you please leave your comments below where it says “Leave a Reply”… or ask a question or report a typo…
Pay it forward by sending the link to MarketTiming.Blog (that link will immediately connect them to this webpage) to a relative or friend. Thanks for doing that.
Be sure to visit the website for more general investing knowledge at:
Standard Disclaimer: It’s your money and your decision as to how to invest it.
I thank Worden Brothers for the charting system I use to post these charts. If you want to know more about the charting system I use every day, contact me. It makes it much easier to follow along with me if you can see the charts and manipulate them on your own computer. It’s a great investment to have an excellent charting system.
Note: I’ve updated my criteria for the equity signal for a further U.S. stock market rally to the following: GREEN = Bullish, YELLOW = Neutral, RED = Bearish. In other words, the colors tell you whether the signal supports the stock rally or not, while the Bullish, Neutral, and Bearish designations are about the trend.
A BEARISH trend signal does not mean we should not buy. A BULLISH trend signal does not mean you cannot sell some exposure. It depends on what is going on in the economy and how oversold/overbought the market is at a given point whether the Bearish signal is to be sold or bought, sold on the next bounce, etc. and whether a Bullish signal is to be bought or if profits should be taken. A NEUTRAL trend signal does not mean the end of the Bull or Bear. It means to wait and look for possible subsequent entry points within the existing trend, Bull or Bear, but preserve capital if the entry fails. Our strong intention is to buy low and sell high. By the way, I will keep showing the prior orange “Trigger lines” in the IWM and GLD charts for now as reference points only; they have historical value for us from the post-2016 election period.
Copyright © 2019 By Wall Street Sun and Storm Report, LLC All rights reserved.

Thank you David.
You are very welcome Charles!