A Market Timing Report based on the November 15, 2019 Close, published Saturday, November 16th, 2019…
I deliver focused comments on market timing once a week. These are supplemented with daily “Tweets/StockTwits” (see links below) and comments in the “markettiming” room on StockTwits.
I provide quite a bit of intraweek commentary, and if you don’t see it, you will miss out on quite a bit of context, so please click on the social media links below and have a read… Thank you as always for being loyal readers and interacting on social media with your questions and comments!
1. SP500 Index Market Timing (S&P 500 Index®; SPY, SPX):
I’m guessing two thirds of my readers focused mostly on the stock market have fallen asleep in the lull of this Bull market. Have you noticed you attend to the market less when it is climbing steadily? No problem, when it’s going up! Why read about what will happen next when what is happening now is so enjoyable? It is enjoyable. If you are long, as I am (with some cash for the next pullback), you are also making great money from stocks. We are still reaping the rewards of ever expanding optimism that all is well, even when it isn’t, as in the China Trade Deal. It is set to be disappointing from the reports I’ve seen. A lot promised and little delivered.
And yet the market doesn’t care. The market also doesn’t care about any other number of risks I’ve been tracking with you for weeks. Nothing after all matters until it suddenly DOES MATTER. Then the VIX (volatility index) skyrockets and everyone says “Yeah, we should have seen that coming!” The President forced out the U.S. Ambassador who was fighting corruption in Ukraine by having the madman Rudi Giuliani smear her – not a problem! Heck, the market doesn’t even care about financial issues like the Fed going to Neutral, at least for now.
Wait until a sub 1% GDP number finally prints. Then, maybe someone on Wall Street will care. The last three pullbacks in the SP500 Index have been about 5.5-7.5%. Not a lot to be excited about in terms of larger swings. These moves are far smaller than what we saw back in December, when the total drop off the top was almost exactly 20%.
What is happening “Under the Hood” this week?
The “safe stuff” is still lagging though it rallied this week. Tech (XLK) is the leader off the Oct. 2nd low this week, followed by the Financials (XLF), Industrials (XLI) and Healthcare (XLV). Worst were utilities (XLU) and slightly better than worst was Real Estate (REITs; XLRE) .
The picture since Oct. 15th (1 month snapshot): The strongest sectors Industrials (XLI) and Healthcare (XLV) followed by Tech (XLK) and Financials (XLF). The worst were XLRE then XLU. Those two were the worst over both time frames.
Rates started to fall again this week, but were up a bit on Friday. WTI Oil closed near the top of the recent range at 57.76. I bought a bit more XLE for that reason and the tick up in inflation seen in the CPI this week. Core CPI Y/Y was reported at 2.3% which puts pressure on the Fed to stick to being Neutral on rates, vs. lowering them. CPI was 1.8% Y/Y.
Let’s turn to the state of the market…
What would satisfy me that the Bulls are serious?
The Bull Market Health Score this week is still Bulls 4.0/Bears 1.0 vs. Bulls 4.0/Bears 1.0 last week. The most recent data on the Score have shown that holding at this high score for a couple of weeks in a row led to a correction. Note my comments on what the market has to do next week to sustain the rally “or else.”
For each checklist item below, I give you the points scored as Bullish or Bearish.
1. New high? Bulls 1.0 Answer: New all time closing high. Still stretched vs. the prior trend.
2. V*IX trend favorable? Bulls 1.0 Answer: Yes. The VIX Game Score is Bulls 7/Bears 0 at a VIX of 12.05 (Friday close) vs. 12.07 the prior week, which is below my “Bull Nirvana” number noted at the base of this report. The Bulls also took the “bonus” VIX point that I used to refer to in my score. As Before: “The 2018 low was 10.17, so there is still room to fall. It was 8.56 in 2017, but earnings were better then and lots of growth was anticipated under the Trump tax cuts.” The VIX has to break 12.00 next week or else.
3. AD % Line in an Uptrend? (This is a proprietary stat; see base of report.): Bulls 0.5 point. Answer: No. The close was 16,888 vs. 16,883 last week. The signal has been consolidating while the market has been rising. It must make a new high next week or else.
4. Higher volume on Up Moves? Lower volume on Down moves? Bulls 1.0 point. Answer: Yes. It was not that impressive, but it was higher on Friday’s move. The more impressive volume of late has marked the bottoms of moves on red days. See the 8-23 and 10-02 spikes for example.
5. Is the “U.S. Index Matrix Signal,” as I call it, positive? Bulls 0.5 point. Answer : Neutral. Now it’s been a full TEN market days, and small caps have not broken above the longer term range while mid caps have been holding above that level for 10 days – but not by much. The mid cap breakout did not reverse, but it also did not continue up with the large caps. This cannot continue for long.
Still true: A small cap breakout would mean the market upside is not done. On the other hand, with small caps holding below the top of the range for TEN DAYS straight, I would not be shocked to see a pullback begin. Maybe that happens with the testimony next week of those who were actually on the Ukraine call with Trump and Zelensky. Just about anything significant among the existing risks or “other” could send this market into at least a few percent correction. More downside via the political realm would require an increased threat to Trump’s re-electability or to his survival in his current term.
Let’s check in on the context around the price action of the market by looking at the current Market Risks…
We have some new earnings data this week…
Earnings Risk/Opportunity: what is shown are the projections in the FactSet 3-15-19 report followed by the reports from 4-12-19 through 8-09-19 with a skip of two weeks until the 8-30-19 data resumes the weekly data sequence (details HERE)… The larger arrows “—>” indicate 3 weeks of of omitted data in order to compress the data. NOTE: 91% of SP500 Index companies have reported. That was just 2% more than last week.
Earnings growth for 2019 is now expected to be ZERO PERCENT. And the market is going up on that. This cannot be sustained without a resumption of global growth. The market can go up on “nothing” as we saw back in the late 1990’s, until it corrects or crashes 78% as the NASDAQ did in the early 2000’s. We are not at such an extreme today, but the market is in fact stretched. Today it’s going up on next to nothing AS AN INDEX.
Without U.S. earnings growth, investors will eventually be drawn to specific companies in the U.S. that are growing earnings and revenues vs. the index funds, as well as to foreign equity investments and also to yield wherever they can get it, both in and outside the U.S. to come up with a real return above inflation of more than zero! The SP500 Index could make very little progress in the meantime, despite the current advance. Investors are being squeezed into the stock market to chase returns they hope will hold up, but which in fact are based on ZERO earnings growth.
For Q2 2019, analysts are projecting earnings growth of 0.1% —> -1.3% -> —> -2.1% —> -2.6% -> -2.6% -> -3.0% -> -1.9% -> -2.6%-> -1.0% -> -0.7% -> -0.4% DONE
and revenue growth of 4.6% —> 4.3% —> 4.1% —> 3.8% -> 3.8% -> 3.7% -> 3.8% ->4.0% ->4.1% -> 4.1% -> 4.0% DONE
For Q3 2019, analysts are projecting earnings growth of 1.8% —> 0.8% —> 0.3% —> -0.5% —> -1.9% —> -3.6% -> -3.7% -> -3.8% -> -3.7% -> -4.1% -> -4.6% -> -4.7% -> -3.7% -> -2.7% -> -2.4% -> -2.3%
and revenue growth of 4.4% —> 4.4% —> 4.2% —> 3.8% —> 3.2% -> —> 2.9% -> 2.8% -> 2.8% -> 2.8% -> 2.8% -> 2.7% -> 2.6% -> 2.8% -> 3.1% -> 3.2% -> 3.1%
For Q4 2019, analysts are projecting earnings growth of 8.1% —> 7.5% —> 7.2% —> 6.3% —> 4.9% -> 4.5% -> 3.9% -> 3.5% -> 3.4% -> 3.2% -> 3.0% -> 2.9% ->2.6% -> 2.3% -> 1.5% -> 0.7% -> -0.4% -> -1.1% -> -1.4%
and revenue growth of 4.8% —> 4.8% —> 4.6% —> 4.3% —> 4.0%-> 4.0% -> 4.0% -> 4.0% -> 3.8% -> 3.7% -> 3.6% -> 3.6% -> 3.6% -> 3.5% -> 3.2% -> 3.0% -> 2.6% -> 2.6% -> 2.5%
For CY 2019, analysts are projecting earnings growth of 3.4% —> 3.2% —> 2.7% —> 1.7% —> 1.4% -> 1.3% -> 1.3% -> 1.3% -> 1.2% -> 1.1% -> 0.7% -> 0.6% -> 0.3% -> 0.1% -> 0.0%
and revenue growth of 4.7% —> 4.7% —> 4.5% —> 4.4% —> 4.3% -> 4.2% -> 4.1% -> 4.1% -> 4.1% -> 4.1% -> 4.0% -> 4.0% -> 4.0% -> 4.0% -> 3.9%
For Q1 2020, analysts are projecting earnings growth of 10.5% —> 9.8% —> 8.5% -> 8.2% -> 8.1% -> 7.9% -> 7.9% -> 7.8% -> 7.6% -> 7.3% -> 6.7% -> 6.0% -> 5.6% -> 5.3% -> 5.1%
and revenue growth of 6.2% —>5.8% —> 5.6% -> 5.7% -> 5.5% -> 5.5% -> 5.4% -> 5.4% -> 5.5% -> 5.3% -> 4.8% -> 4.7% -> 4.5% -> 4.5% -> 4.5%
For Q2 2020, analysts are projecting earnings growth of 13.3% —> 13.5% -> 12.0% ->12.6% -> 10.7 -> 9.9% -> 9.3% -> 9.2% -> 9.1% -> 9.0% -> 9.0% -> 8.7% -> 8.6% -> 7.7% -> 7.3% -> 6.7% -> 6.6% -> 6.4%
and revenue growth of 6.8% —> 6.6% -> 6.7% ->6.6% -> 6.5% -> 6.4% -> 6.5% -> 6.4% -> 6.4% -> 6.3% -> 6.3% -> 6.3% -> 5.9% -> 5.2% -> 5.2% -> 4.9% -> 5.0% -> 4.9%
For CY 2020, analysts are projecting earnings growth of 10.7% -> 10.6% -> 10.6% -> 10.6% -> 10.5% -> 10.6% -> 10.4% -> 9.9% -> 9.8% -> 9.7% -> 9.7%
and revenue growth of 5.6% -> 5.6% -> 5.6% -> 5.6% -> 5.7% -> 5.6% -> 5.3% -> 5.3% -> 5.3% -> 5.4% -> 5.5%
The earnings and revenue data was already discussed above!
Here’s a Brief Review of the Other Market Risks at Hand:
China Deal Risk: No Change. The overall market has ignored it. We are told a deal is imminent, and then it is not. The Chinese are gaming Trump, and he’s not folding, but he’s bending and says he will make a series of deals, including a first deal that may look light on results. Xi has the edge as “Lifetime Leader.”
Fed Rate Cut Risk: The Fed has cut three times and said it was done unless things get worse for the economy. Now the probability is 0.7% for a 4th cut in mid-December as assessed by CME Group. The risk was 3.7% last week and and 22.1% 3 weeks ago.
As I’ve said previously: “THREE cuts is a mid-cycle adjustment. Four cuts or more mean the Federal Reserve expects a recession.”
What about January? The odds of cut #4 or even #5 are 13.9% vs. 14.3% last week vs. 35.8% two weeks ago vs 67% six weeks ago!
What about March? The odds are 25.3% vs. 23.8% last week vs. 75.1% six weeks ago for 4 or more cuts in total.
April? 52.6% vs. 79.7% five weeks ago expect there to be 4 or more cuts. June became more interesting, because now the probability of a hike is 10.2% vs. zero last week. 43.6% vs 32.8% last week vs. 56.7% 2 weeks ago expect four or more cuts by then. July? 48.2% vs. 38.7% last week vs. 60.7% 2 weeks ago expect 4 cuts by then. What are the rest of the available “4 cut odds”? Sept. 2020? 53.2% vs. 38.7% last week vs. 65.2% two weeks ago. Nov. 2020? 57.3% vs. 41.6% 1 week ago vs. 69.3% 2 weeks ago. Dec. 2020? 61.7% vs. 45.2% last week vs. 73.8% 2 weeks ago.
Fed Hike Risk: What are the “Hike Risks” this week after June’s, which was noted above? July: 9.2% Sept.: 8.1% Nov. 7.2% Dec. 6.3%.
In sum, the risk of another rate CUT (recession risk goes up) is above 50% first in April, then again above 50% in Sept. through December with the odds increasing into 2020 year end. The risk of a HIKE ranges from 5-10% starting in June and continuing through year end 2020.
For now, that means a majority of investors believe that recession is on the schedule for 2020, or at least the conditions that will force the Federal Reserve to act to avoid recession or make it a more shallow one. That means they are ultimately worried about what I call a “Big Bear Market“ (click and scroll to definitions in blue).
The Risk of a Neutral Fed: The market is behaving as if it does not care about the Neutral Federal Reserve despite the fact that the President is pleading for more cuts as the market moves higher and higher. His pleading and harassment of Federal Reserve Chair Powell has more to do with his re-election than the need to cut rates. If you believe the Federal Reserves job is to run the economy and keep it from cycling to any degree, then the Fed is likely behind on rate cuts. I think that concept is a horrible idea, because it means excesses are never wrung out of the market until the entire system caves in as it did from 2007-2009. Creating debt as Trump is when the economy is doing well is also a horrible practice.
This is why I added to XLE this week (from last week): “The risk is likely going to be on the side of inflation, because the Fed does not want to make a mistake by hiking too early again and kill the recovery and thereby interfere with Trump’s re-election in an obvious way. That means inflation related assets (think oil) should do well in the coming 3-6 months or perhaps more. Gold will do well too if the Fed is slow (see below) to react...”
Takeaway Point: The Federal Reserve is not just “in Neutral,” it’s politically STUCK IN NEUTRAL!
My Investing Scenario as stated several weeks ago is still intact…
Current Scenario…
Things improve into year end (well not really, but they’ll ignore that, right?) and at the start of 2020 (economically, but also including the failure of Trump’s conviction in Dec. or Jan. after his successful impeachment along with some sort of China trade progress despite missing elements), so the market rallies further. A final high is reached prior to the discounting of a recession, which brings on a ‘Big Bear Market.’ Got it? 😉 Could there be some smaller bumps still? Of course there could, perhaps as Trump’s Senate trial approaches for example.
U.S. Iran War Risk: No change this week. More stable after the leak of the “Iran Annihilation Plan HERE.
2020 Election Risk: The level rose this week with the impeachment testimony. Why? Because the risk of Trump being tainted by impeachment is higher now that we see the professionalism of the foreign service members providing the Ukraine Call testimony. Trump cann0t be re-elected without more voters than his base and that’s about all that may be left after this is done. The calculus is NOT to convict Trump, although it’s theoretically possible. Their goal is to show how bad he is, so he cannot win. They don’t need a conviction at all.
Trump Impeachment Risk: No change. Trump will be impeached. Why? Because they have the evidence on him and the thoroughly dirty Giuliani, who once fought the sort of crimes he has been engaged in. Sad! Conviction is still not in sight, but that could change as the process continues. At the moment though the risk of conviction by the Senate, controlled by Republicans appears low.
If the process were to stop today, Trump would not be convicted despite the testimony this week. Oddly the Republicans only care about the Constitution when there is a Democrat in the White House. Plus they are very scared of Trump’s retribution particularly in Republican primaries. He’s the GOP party mob boss out to get them they think. Profiles in Courage? Nowhere in sight.
Deficit/Debt Threat: Trump is now beating Obama at something! The size of his deficit! Read THIS. The deficit is up 26% to $964 Billion for fiscal 2019, the HIGHEST IN 7 YEARS!
I’ll leave this here as a monument to our monumental debt, which could threaten interest rates in the future. When rates rise, there will be “heck to pay.” The U.S. dollar remains at risk and having at least 5% gold exposure is a reasonable hedge in any portfolio. Some say higher, but owning stocks is also a hedge that over time would work out for solid companies, even in the face of very high inflation (not in the case of bankruptcies of course!).
Back to the charts….
Now take a look at the SP500 chart. The green line is 2940.91, the
9-21-2018 High preceding the decline ending December 24th. The long upper yellow line is now at about 3059 at the Friday close (the extension is not shown, but that’s where it goes to). The two short upper yellow lines show a narrow range in a gentle up trend, rising ABOVE the prior upper trend line.
This means the market is recruiting the “late coming Bulls,” who are now convinced with the market at all time highs that they should own stocks. That’s when you start trimming exposure here and there, OR you can sell using mental stops with the intention of buying back exposure later – that’s the process that I coined as “Passive Shorting.” As I warned last week, if the market keeps pushing above that top yellow line (the longer one), there will be an eventual payback.
SP500 Large Cap Index (click chart to enlarge; SPX, SPY):

Rising above the prior trend line.
Now let’s check in on two “Canary Signals” we’ve been following:
“Intel-igent Market Timing Signal” (Intel; I*NTC; * there to throw off the crawlers!): Neutral. The stock is stuck below the April ATH. Why should it break out if the U.S. GDP is due to slide to below 1%? Think about that. The June 4 high of 57.60 has been exceeded, and the April high of 59.59 is the next test to achieve a new all time high.
Bank of America (B*AC) Market Timing Signal: Bullish but on pause. There have been 3 closes above 32.77, the early 2018 high. This is a major breakout if it holds. It will only hold if rates keep climbing. Rates did NOT keep climbing over the past week, and the stock could be stuck until they continue climbing. Sell a reversal at least on a close or sell on a close with higher volume IMO.
Keep up-to-date during the week at Twitter and StockTwits (links below) where a combined 34,144 investors are following the markets with me…
Follow Me on Twitter® Follow Me on StockTwits®. (real time messages are ONLY on StockTwits until Twitter reforms its policies, but we’ll have it as a backup system)
Join the Conversation in the StockTwits “MarketTiming” Room
Now let’s go on to review investor sentiment…
Survey Says!
Sentiment of individual investors (AAII.com) showed a Bull minus Bear percentage spread of +15.90% vs. +16.37%. Same as last week: “Finally, the Bulls are recruiting believers, but they’ve also reached levels of prior pullbacks on the Bullish side (see social media link). This fits with the trend of SPX being stretched here and subject to a loss of further gains from here.” What’s the catch? Bullish spreads could go much higher on a melt-up of the market into December (about double or more vs. the current spread).
| Bulls | Neutrals | Bears |
| 40.72% | 34.46% | 24.82% |
| Thurs. 12 am CT close to poll | ||
2. U.S. Small Caps Market Timing (IWM):
Same: Ten days without a breakout as noted above. “Bad sign that IWM could not break out with the large caps continuing their climb or even match the midcap breakout. If you see a breakout, it will be a positive sign for at least another Bullish stretch (for large and midcaps too) before the next decline.”
Russell 2000 U.S. Small Cap Index (click chart to enlarge; IWM, RUT):

Small caps just can’t seem to break out!
3. Gold Market Timing (GLD):
No change. Gold has already slipped below first support and the only reason I did not sell the rest of my trading position is because gold stocks did not break down.
SAME: Things are shifting… We’ve gone from “recession risk” and “multiple cuts” as well as “don’t fight the Fed” to “Three cuts and done.”
MAJOR POINT: IF the Fed lags inflation, gold wins, but if it front runs inflation, gold loses on a relative basis. My contention as said above is that Federal Reserve bias will now be against raising rates prior to the election, so inflation will get a boost! Gold wins…but it must perform on the charts to prove it!
Gold does not do well in a growing economy, because that is when stocks outperform. A further gold breakdown with rising rates would indicate confidence in the economy turning around. Remember this: Price represents the sum total consciousness about what is being priced in that moment! Many factors impact gold prices, but ultimately they all converge to create the current price. Follow the price and avoid following theories about why the price is what it is. When we can readily explain a price, it’s nice, because we tend to have more confidence in it.
And the catch with pricing? Sometimes the market is completely crazy and prices in much more or much less than it should. It’s then that we need to alternatively, be careful, or start buying! Last December the market was irrationally pricing stocks too low vs. reality, because it believed the Federal Reserve was on a course that was wrong.
Technicals: Gold is still holding on barely above that key top red line. If it breaks and GDX breaks, I’ll likely be lowering my exposure to gold.
The Gold ETF (click chart to enlarge; GLD): That top red line is 137.80.

Must hold the red line!
4. Interest Rate Market Timing (10 Year Treasury Yield; TNX, IEF, TLT):
As long as the Federal Reserve stays “Neutral,” rates will be rangebound barring a left field event, a.k.a. a “Black Swan event.” Last week I said that I wanted to see 3 closes above the prior TNX high of 1.903% to confirm the breakout, and yet TNX closed 3 times above and then failed! So much for such guidelines. They are just guidelines of course.
Still, the trend is up definitionally until the value drops below the 11-01 low. When the whiff of inflation is perceived in incoming data, rates will move up and when economic slowing numbers appear, rates will move back down.
Check out the “Market Signal Summary” below – after you review the following chart…
U.S. 10 Year Treasury Note Yield (click chart to enlarge; TNX, IEF, TYX, TLT, TBF):
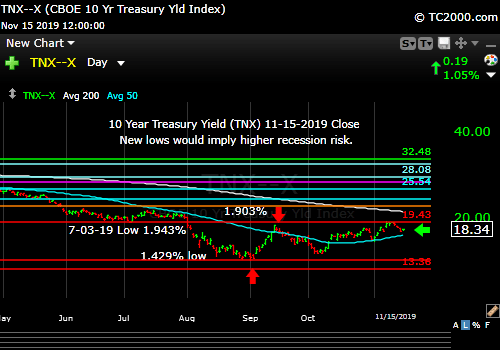
Rates failed a breakout, but the immediate trend is still up.
Now let’s review three key market timing signals together….
Do not use these signals as a trading plan. They are rough guidelines. I currently share my BUYS and SELLS in as timely a way as possible on social media (links above).
MY MARKET SIGNAL AND TREND SUMMARY for a Further U.S. Stock Market Rally with Real GDP Growth (“Real” means above inflation):
Stock Signal YELLOW for a further U.S. stock market rally with a Bullish SP500 Index trend. The stock signal is based on small caps, as they often lead the market down. SAME 11-15-19: Small caps are moving up within a range, the top of which was established on Feb. 25th. Above there, the Bull will be back in full.
The V*IX (which relates to SPX volatility; * added to symbol to throw off the webcrawlers!) The VIX Game Score is scored as 7 points running from a VIX high of 17.89 (point 1 for the Bulls) down to 13.31 (Point 7 for the Bulls).
The VIX Game Score is Bulls 7/Bears 0 at a VIX of 12.05 (Friday close).
The ‘Bull Nirvana Target’ is 13.31.” (That is target #7 for the Bulls.) We’re below that number!
Gold Signal YELLOW for a further U.S. stock market rally with a NEUTRAL Gold Trend.
What gold does mostly as I’ve written HERE is follow real interest rates around the world (if you own “gold in dollar terms” you care about U.S. rates most of all). The rest of the world does matter however, including massive buying by central banks.
Remember, gold may be down but not yet out, because if the Fed lags inflation, gold will win. Since I am predicting a “lagging Federal Reserve” into the 2020 Election, inflation will win, and gold and oil will win.
From before: “Remember GLD is being used as an indicator for the ECONOMY here.” If gold continues to rise, it means the market believes real rates will fall, which in the current context means the global economy is slowing. That would ultimately hurt U.S. stocks.
Rate Signal NEUTRAL for a further stock market rally with a long term BEARISH and short term Bullish 10 Year Yield Trend. (Remember: higher rates mean lower bond and Treasury prices).
I’ll leave this reminder from 9-20-2019’s issue: “Remember, FOUR Fed cuts will NOT be a “mid-cycle adjustment” and would be taken badly by the market ironically, considering the market’s addiction to lower rates. ***A fourth cut means the Federal Reserve is seeing recession risk as significantly high.***”
Also for Reference: “Rates usually RISE slowly in a strong recovery and the stock market rally continues as they rise, as I’ve repeated multiple times on social media and here. Empirically though, rates that are “lower” (than 3.11%) and are NOT rising rapidly have allowed the market to rise.”
I said weeks ago, “Watch the oil price too. Higher oil tends to mean higher rates.” It closed at 57.76 vs. 57.24 last week. Still holds: If it rises above 58.82 and then 60.94, oil and oil stocks will be off to the races. 63.38 would be the next target. Since May, the price of oil almost appears to have been managed to stay between 50 and 59/barrel. I wonder why? 😉
Just a reminder: If TNX bounces too quickly and too high, this will give rise to Rate Shock III… As said before: “Watch the rate at which TNX climbs if the current trend reverses. If it shoots up very fast, stocks will correct.” In the Sept. 28th issue: “A rapid push higher in rates would mean trouble for stocks, as occurred in early 2018. That’s what I called ‘Rate Shock.'” I called the period of rising rates in early October #RateShockII.
Another Reminder: “The risk lately has been ‘Negative Rate Shocks.’ (Not negative rates in the U.S. yet! “Negative” refers to the direction of the shock.) First we had ‘Negative Rate Shock I’ in December 2018 (because rates FELL while the Fed raised the Fed Funds rate 0.25% in mid-December, in what was perceived as a policy error by critics), ‘Negative Rate Shock II’ in May, and ‘Negative Rate Shock III’ in August. The Stock Market Bulls had better hope that they don’t get more rate cuts past October.
Thank you for reading. Would you please leave your comments below where it says “Leave a Reply”… or ask a question or report a typo…
Pay it forward by sending the link to MarketTiming.Blog (that link will immediately connect them to this webpage) to a relative or friend. Thanks for doing that.
Be sure to visit the website for more general investing knowledge at:
Standard Disclaimer: It’s your money and your decision as to how to invest it.
I thank Worden Brothers for the charting system I use to post these charts. If you want to know more about the charting system I use every day, contact me. It makes it much easier to follow along with me if you can see the charts and manipulate them on your own computer. It’s a great investment to have an excellent charting system.
Note: I’ve updated my criteria for the equity signal for a further U.S. stock market rally to the following: GREEN = Bullish, YELLOW = Neutral, RED = Bearish. In other words, the colors tell you whether the signal supports the stock rally or not, while the Bullish, Neutral, and Bearish designations are about the trend.
A BEARISH trend signal does not mean we should not buy. A BULLISH trend signal does not mean you cannot sell some exposure. It depends on what is going on in the economy and how oversold/overbought the market is at a given point whether the Bearish signal is to be sold or bought, sold on the next bounce, etc. and whether a Bullish signal is to be bought or if profits should be taken. A NEUTRAL trend signal does not mean the end of the Bull or Bear. It means to wait and look for possible subsequent entry points within the existing trend, Bull or Bear, but preserve capital if the entry fails. Our strong intention is to buy low and sell high. By the way, I will keep showing the prior orange “Trigger lines” in the IWM and GLD charts for now as reference points only; they have historical value for us from the post-2016 election period.
Copyright © 2019 By Wall Street Sun and Storm Report, LLC All rights reserved.
