A Market Timing Report based on the November 29, 2019 Close, published Saturday, November 30th, 2019…
I deliver focused comments on market timing once a week. These are supplemented with daily “Tweets/StockTwits” (see links below) and comments in the “markettiming” room on StockTwits.
I provide quite a bit of intraweek commentary, and if you don’t see it, you will miss out on quite a bit of context, so please click on the StockTwits link below and have a read… Thank you as always for being loyal readers and interacting on social media with your questions and comments!
1. SP500 Index Market Timing (S&P 500 Index®; SPY, SPX):
The comment by President Xi through the Chinese state media of “strong countermeasures” against the U.S. for interfering with the Hong Kong sovereignty issue/protests is an immediate market risk. Why? Because the market has been going above the prior trend based at least in part on a Phase One China Trade War resolution. How President Xi would dance around taking strong countermeasures and making a trade deal is very unclear, which puts mid-December tariff hikes in play for Trump, and those tariffs would add greatly to U.S. price inflation expectations and eventual higher inflation. The market would not like that at all. Remember that some big stocks like Intel (INTC) and even Apple (AAPL) have gone up a lot based on this resolution. The risk of a significant correction has risen.
“Trump signed a bill into law on Wednesday that requires the State Department to certify annually that Hong Kong has sufficient autonomy to retain special U.S. trading consideration, which helps Hong Kong’s economy.” (Ref. link above) In my view, Trump would not have signed the bills supporting Hong Kong’s sovereignty (and banning the sale of rubber bullets, tear gas to the Hong Kong police) if it were not for the fact that Congress would have overridden his veto and embarrassed him as a Communist sympathizer. The same has happened with Russia. He was forced into those sanctions too, despite any rhetoric to the contrary.
This was the week of the small cap breakout. If it is maintained, the entire market should continue higher. On the other hand, a reversal for the small caps would likely be lethal for the market’s further immediate rise. It would accelerate a bigger correction. Decisions, decisions…
Interest rates, which we’ve been tracking intently, have eased, but they are “down but not out.” Remember that if the data supports some lift to the economic picture, rates will rise, not fall. The Federal Reserve will likely take longer than before to hike rates upon seeing that lift, but will eventually hike rates again if the trend were to continue. Fed Chair Powell is data dependent, even if it takes him a while to perceive what the data is. Meanwhile savers have seen a drop in rates from around 2.3% in money markets back to 1.6ish%.
Let’s turn to the state of the market…
What would satisfy me that the Bulls are serious?
The Bull Market Health Score this week is Bulls 4.0/Bears 1.0 vs. Bulls 2.5/Bears 2.5 last week. It’s a 5 point scoring system .
For each checklist item below, I give you the points scored as Bullish or Bearish.
1. New high? Bulls 1.0 Answer: Yes. New high with slow rise within the channel demarcated by the two red lines in the chart below.
2. V*IX trend favorable? Bulls 0.5 Answer: Neutral. The VIX Game Score is Bulls 7/Bears 0 at a VIX of 12.62 (Friday close) vs. 12.34 the prior week, which is below my “Bull Nirvana” number, which is the 7th Score point. The Bulls broke 12.00 this week, and then that goal was given back. The market dropped 0.40% on Friday. The Bulls need to retake VIX 12.00 or there will be more downside. Two weeks ago I pointed to the potential for further VIX downside (good for Bulls).
3. AD % Line in an Uptrend? (This is a proprietary stat; see base of report.): Bulls 0.5 point. Answer: Neutral. The close was 16,909 vs. 16,848 last week, but after posting a new high, the number fell below the high from 14 days ago of 16,930.
4. Higher volume on Up Moves? Lower volume on Down moves? Bulls 1.0 point. Answer: Yes. It was up on the last breakout, so the Bulls score a point.
5. Is the “U.S. Index Matrix Signal,” as I call it, positive? (To be positive, small and mid caps must be doing as well as large caps) Bulls 1.0 point. Answer: Yes. The small caps finally broke out as the second chart shows. If this is reversed, watch out below.
As I showed you a few weeks ago, a Bull Market Health Score of 4 or higher can persist for a while, but indicates a degree of market stretch that can lead to a pullback. However, if we see Bulls breakouts in the numbers above, the Bull market move will be further verified (new high, VIX back below 12 (breakout to downside), higher AD%, big up volume, and happy U.S. Index Matrix).
Let’s check in on the context around the price action of the market by looking at the current Market Risks…
We have some new earnings data this week…
Earnings Risk/Opportunity: NO UPDATE this week due to the holiday at FactSet. What is shown are the projections in the FactSet 3-15-19 report followed by the reports from 4-12-19 through 8-09-19 with a skip of two weeks until the 8-30-19 data resumes the weekly data sequence (details HERE)… The larger arrows “—>” indicate 3 weeks of of omitted data in order to compress the data. NOTE: 96% of SP500 Index companies have reported. That was just 5% more than last week.
For Q2 2019, analysts are projecting earnings growth of 0.1% —> -1.3% -> —> -2.1% —> -2.6% -> -2.6% -> -3.0% -> -1.9% -> -2.6%-> -1.0% -> -0.7% -> -0.4% DONE
and revenue growth of 4.6% —> 4.3% —> 4.1% —> 3.8% -> 3.8% -> 3.7% -> 3.8% ->4.0% ->4.1% -> 4.1% -> 4.0% DONE
For Q3 2019, analysts are projecting earnings growth of 1.8% —> 0.8% —> 0.3% —> -0.5% —> -1.9% —> -3.6% -> -3.7% -> -3.8% -> -3.7% -> -4.1% -> -4.6% -> -4.7% -> -3.7% -> -2.7% -> -2.4% -> -2.3% -> -2.2%
and revenue growth of 4.4% —> 4.4% —> 4.2% —> 3.8% —> 3.2% -> —> 2.9% -> 2.8% -> 2.8% -> 2.8% -> 2.8% -> 2.7% -> 2.6% -> 2.8% -> 3.1% -> 3.2% -> 3.1% -> 3.1%
For Q4 2019, analysts are projecting earnings growth of 8.1% —> 7.5% —> 7.2% —> 6.3% —> 4.9% -> 4.5% -> 3.9% -> 3.5% -> 3.4% -> 3.2% -> 3.0% -> 2.9% ->2.6% -> 2.3% -> 1.5% -> 0.7% -> -0.4% -> -1.1% -> -1.4% -> -1.4%
and revenue growth of 4.8% —> 4.8% —> 4.6% —> 4.3% —> 4.0%-> 4.0% -> 4.0% -> 4.0% -> 3.8% -> 3.7% -> 3.6% -> 3.6% -> 3.6% -> 3.5% -> 3.2% -> 3.0% -> 2.6% -> 2.6% -> 2.5% -> 2.5%
For CY 2019, analysts are projecting earnings growth of 3.4% —> 3.2% —> 2.7% —> 1.7% —> 1.4% -> 1.3% -> 1.3% -> 1.3% -> 1.2% -> 1.1% -> 0.7% -> 0.6% -> 0.3% -> 0.1% -> 0.0% -> 0.1%
and revenue growth of 4.7% —> 4.7% —> 4.5% —> 4.4% —> 4.3% -> 4.2% -> 4.1% -> 4.1% -> 4.1% -> 4.1% -> 4.0% -> 4.0% -> 4.0% -> 4.0% -> 3.9% -> 3.8%
For Q1 2020, analysts are projecting earnings growth of 10.5% —> 9.8% —> 8.5% -> 8.2% -> 8.1% -> 7.9% -> 7.9% -> 7.8% -> 7.6% -> 7.3% -> 6.7% -> 6.0% -> 5.6% -> 5.3% -> 5.1% -> 5.3%
and revenue growth of 6.2% —>5.8% —> 5.6% -> 5.7% -> 5.5% -> 5.5% -> 5.4% -> 5.4% -> 5.5% -> 5.3% -> 4.8% -> 4.7% -> 4.5% -> 4.5% -> 4.5% -> 4.4%
For Q2 2020, analysts are projecting earnings growth of 13.3% —> 13.5% -> 12.0% ->12.6% -> 10.7 -> 9.9% -> 9.3% -> 9.2% -> 9.1% -> 9.0% -> 9.0% -> 8.7% -> 8.6% -> 7.7% -> 7.3% -> 6.7% -> 6.6% -> 6.4% -> 6.7%
and revenue growth of 6.8% —> 6.6% -> 6.7% ->6.6% -> 6.5% -> 6.4% -> 6.5% -> 6.4% -> 6.4% -> 6.3% -> 6.3% -> 6.3% -> 5.9% -> 5.2% -> 5.2% -> 4.9% -> 5.0% -> 4.9% -> 4.9%
For CY 2020, analysts are projecting earnings growth of 10.7% -> 10.6% -> 10.6% -> 10.6% -> 10.5% -> 10.6% -> 10.4% -> 9.9% -> 9.8% -> 9.7% -> 9.7% -> 9.9%
and revenue growth of 5.6% -> 5.6% -> 5.6% -> 5.6% -> 5.7% -> 5.6% -> 5.3% -> 5.3% -> 5.3% -> 5.4% -> 5.5% -> 5.5%
The earnings and revenue data was already discussed above!
Here’s a Brief Review of the Other Market Risks at Hand:
China Deal Risk: Noted above. Recapping briefly: Risk of failure elevated after the signing of two bills by Congress and President Trump to support the people of Hong Kong over their Mainland China oppressors. Xi threatened retaliation, which is not a good thing at this juncture of negotiations and ahead of the threatened December tariff hikes. The market would respond poorly to those new tariff levels.
Fed Rate Cut/Hike Risk: The Fed has cut three times and said it was done unless things get worse for the economy. Now the probability is 0% for a 4th cut in mid-December as assessed by CME Group. The risk was 22.1% 5 weeks ago. The risk of a rate HIKE is 4.4% now vs. 0% 2 weeks ago.
As I’ve said previously: “THREE cuts is a mid-cycle adjustment. Four cuts or more mean the Federal Reserve expects a recession.” A hike in rates in the near future would tank the U.S. stock market.
What about January? The odds of cut #4 is 8.5% vs. 12.4% last week vs. 35.8% three weeks ago vs 67% seven weeks ago! The odds of a HIKE in Jan. are 4.0% vs. 5.8% last week.
What about March? The odds are 16.2% vs. 23.3% last week vs. 75.1% seven weeks ago for 4 or more cuts in total. March hike? 3.7% vs. 5.0% last week.
April Cut? 26.5% vs. 34.8% last week vs. 52.6% 2 weeks ago vs. 79.7% 7 weeks ago expect there to be 4 or more cuts. April hike? 3.2% vs. 4.2% odds last week.
June cut? 36.6% vs. 43.5% last week vs. 56.7% 4 weeks ago expect four or more cuts by then. Probability of a hike is 2.7% vs. 3.6% last week vs. 10.2% 2 weeks ago vs. 0% 3 weeks ago.
July? 46.6% vs. 49.4% last week vs. 60.7% 3 weeks ago expect 4 cuts by then. A hike? 2.3% vs. 3.2% last week vs. 9.2% 2 weeks ago.
What are the rest of the available “4 cut odds”? Sept. 2020? 51.7% vs. 58.9% last week vs. 53.2% 2 weeks ago vs. 38.7% 3 weeks ago vs. 65.2% 4 weeks ago. Sept. 2020 Hike? 2.1% vs. 2.6% last week vs. 8.1% 2 weeks ago. Nov. 2020 cut: 56.5% vs. 62.9% last week vs. 57.3% 2 weeks ago vs. 41.6% 3 weeks ago vs. 69.3% 4 weeks ago. Nov. hike? 1.8% vs. 2.3% last week vs. 7.2% 2 weeks ago. Dec. 2020 Cut: 62.6% vs. 66.5% last week vs. 61.7% 2 weeks ago and 73.8% 4 weeks ago. Dec. hike? 1.6% vs. 2.1% last week vs 6.3% 2 weeks ago.
In sum, the risk of another rate CUT (recession risk goes up) is just above 50% first in Sept. 2020 unchanged from last week in terms of the date and continues through December with the odds increasing into 2020 year end. The risk of a HIKE is still very low all the way out to December 2020, so says Master Market!
SAME: For now, that means a majority of investors who place bets on the Fed/interest rates believe that recession is on the schedule by the Fall of 2020, or at least the conditions that will force the Federal Reserve to act to avoid recession or make it a more shallow one. That may in fact not happen, but if the China Trade War gets worse, it could. That means they are ultimately worried about what I call a “Big Bear Market“ (click and scroll to definitions in blue under “New Rules”).
The Risk of a Neutral Fed: Same. Ultimately the change by the Federal Reserve in going to “Neutral” was NOT positive for the U.S. equity market, but it ignored it. It won’t ignore it if economic slowing does not reverse itself going into 2020.
Takeaway Point SAME and still important: The Federal Reserve is not just “in Neutral,” it’s politically STUCK IN NEUTRAL! (or it will be perceived the Fed is political and anti-Trump – something you have not heard from the mainstream media – their narrative is that Powell is independent of Trump.) Remember this when you consider both gold and bonds as investments (see below).
U.S. Iran War Risk: Interestingly quiet. No change for weeks. More stable after the leak of the “Iran Annihilation Plan HERE. Funny how they simply seemed to shut up isn’t it? The media has mostly missed this connection. But that’s OK as we’ll “let sleeping dogs lie.”
2020 Election Risk: The entry of Bloomberg makes things more difficult for Joe Biden, although Bloomberg is known better to Democrats in power than to Americans in general. They’ve heard his name and seen his cable channel is about it. He’s #9 in the world in wealth per Forbes as of March. His wealth makes Trump’s look small. What he may lack is the charisma needed in a national race. Remember George W. Bush? Not the brightest star in the sky, but he could relate to people, unlike his brother, Jeb, who could speak intelligently in English but not in “Voterese.” Trump speaks a far right dialect of “Voterese,” which is his base. Bloomberg must quickly prove he can relate to the larger American electorate. Billionaire Tom Steyer is already falling in the polls and appears to have failed to ignite any real interest among Democrats.
My Call on Mike: Mike Bloomberg must be ahead of Harris by December 15th (in 5th place at least) and ahead of Buttigieg (in fourth place or better) by December 31st to appear viable. He is not taking donations, so he can’t meet the donation requirement for the debates and must meet the polling requirements. He’s at 2.5% behind Yang at 3.3% (in the latest poll, Bloomberg is at 3%) in national polls and slightly ahead of Amy Klobuchar.
The above discussion would make it seem that Biden should beat Bloomberg, but I looked at the social media feed under #Biden, and “it ain’t good.” His campaign is asleep on Twitter, instead of directing the conversation or at least influencing it. Why aren’t they? Because Biden is the “safe choice,” not the “inspiring choice” as Obama was as the first African American candidate who was both bright and could speak “Voterese” fluently. This nomination may still be Biden’s to lose, but he seems to be losing from the start with Buttigieg (who was attacked for being out of touch with African Americans this past week) leading in Iowa at least (a very white state demographically). At this time, my view is still that if Biden does not face off Trump, the Democrats will lose unless Mike Bloomberg can gain serious traction fast.
Mike Bloomberg would be an important voice in the debates to face off the anti-capitalism Democrats as a middle class boy who achieved the American Dream in a big way. I would like to see a more inclusive capitalism emerge as I’ve said here before, but not socialism. Increased profit sharing with employees is a must, or our system will be pushed to the far left during the next big crisis.
In the meantime, the ultra-liberal Warren is dropping hard in the polls as her plan to shove one healthcare choice down the throats of the American people appears doomed. Her response this week was apparently to say she’d phase in her forced plan slowly, which is sort of like being choked to death slowly. It takes longer, but you still end up dead! Bernie (who “wrote the damn bill”) is not doing that well either in large part for the same reason, although he appears to be picking up support from Warren’s decline along with Pete Buttigieg who has been rising in the polls since Oct. 14th with a recent big spurt up. He is rising as fast as Warren is falling, although he’s still in fourth place at a mean polling percentage of 11%, and his numbers have been going up and down with each successive poll.
Trump Impeachment Risk: Little change this week after falling after the hearings. Conviction Risk? Still near zero. The Constitution does not matter to the GOP any longer. It will matter again only if Biden is elected. Censure is still a possible out for the GOP, so they don’t appear they are trampling on the Constitution in supporting Trump. That’s what they look like as of today. What’s wrong is wrong. Every president should be held accountable. Clinton was appropriately chastised via impeachment. Trump deserves a trip to the figurative stocks as well (not those stocks, the other stocks! ; )).
Deficit/Debt Threat: No Change: Trump is now beating Obama at something! The size of his deficit! It’s bigly. Read THIS. The deficit is up 26% to $964 Billion for fiscal 2019, the HIGHEST IN 7 YEARS!
I’ll leave this here as a monument to our monumental debt, which could threaten interest rates in the future. When rates rise, there will be “heck to pay.” The U.S. dollar remains at risk and having at least 5% gold exposure is a reasonable hedge in any portfolio. Some say higher, but owning stocks is also a hedge that over time would work out for solid companies, even in the face of very high inflation (after the market came back from a deep swan dive!).
Current Scenario…(modified since prior issue!)
Despite the extra push up above trend we are seeing (the higher channel in the chart below), the prior pattern we saw earlier in 2019 could repeat itself (up slightly off a long consolidation and then down sharply into a mild to moderate correction [5-15%]). The China risk has increased this week, which is why stocks dropped in both China (to a greater degree) and in the US.
A final high will be reached prior to the discounting of a recession, which brings on a ‘Big Bear Market.’ Whether the market moves up a bit and cracks back, corrects immediately, OR rises now to a final (for the cycle) all time high, we are not yet at the all time high in my opinion.
Same Bottom Line: I am holding my current exposure for now and seeking markets outside the U.S. Why? Because I’m overexposed to the US market at this point in allocation terms (have been since Feb. 2018, when I traded nearly all my foreign exposure for U.S. exposure, all communicated on social media), and I would favor a correction from this level before the final all time cycle high is reached. Yes, global markets could fall too, so I’m moving in steps to “buy foreign.” If we don’t see a U.S. market drop, there are other markets to buy without chasing a market I am already overexposed to.
Back to the charts….
Now take a look at the SP500 chart. The green line is 2940.91, the
9-21-2018 High preceding the decline ending December 24th. The long upper yellow line is now at about 3062 at the Friday close. The two short upper red lines show a narrow range in a gentle up trend, rising ABOVE the prior upper trend line.
As I warned three weeks ago, if the market keeps pushing above that top yellow line (the longer one), there will be an eventual payback.
SP500 Large Cap Index (click chart to enlarge; SPX, SPY):

Still in the higher channel, above trend subject to correction.
Now let’s check in on two “Canary Signals” we’ve been following:
“Intel-igent Market Timing Signal” (Intel; I*NTC; * there to throw off the crawlers!): Neutral. SAME and China’s response to the U.S. Hong Kong bills was not helpful: “The stock is stuck below the April ATH. Why should it break out if the U.S. GDP is due to slide to below 1%? Think about that. The June 4 high of 57.60 has been exceeded, and the April high of 59.59 is the next test to achieve a new all time high.”
Bank of America (B*AC) Market Timing Signal: Bullish, but needs to push higher soon. This week there were FIVE closes above 33.05, which was the early 2018 high (I quoted a slightly lower number before as I apparently picked out a slightly lower high in that time frame), and then zero progress. Prior holds: “That’s a negative, but this is a major breakout if it holds. It will only hold if rates keep climbing. Sell a reversal at least on a close or sell on a close with higher volume IMO.”
Keep up-to-date during the week at Twitter and StockTwits (links below) where a combined 34,181 investors are following the markets with me…
Follow Me on Twitter® Follow Me on StockTwits®. (real time messages are ONLY on StockTwits until Twitter reforms its policies, but we’ll have it as a backup system)
Join the Conversation in the StockTwits “MarketTiming” Room
Now let’s go on to review investor sentiment…
Survey Says!
Sentiment of individual investors (AAII.com) showed a Bull minus Bear percentage spread of +3.36% vs. +5.21% last week. Even more so today: “Sentiment should be peaking if this is in fact a top. It is not a top. It could be a temporary top, but it’s not “The Top.” The move down from a spread of around 15% two weeks ago is not enough to dislodge the Bulls. Sentiment can wobble down and then back up without more than a dip of a few percent.
| Bulls | Neutrals | Bears |
| 33.64% | 36.09% | 30.28% |
| Thurs. 12 am CT close to poll | ||
2. U.S. Small Caps Market Timing (IWM):
We now have the breakout, but it must hold. If rates continue back down, it won’t likely hold. NOTE: That green arrow should be pointed to the price point ABOVE the red line… The arrow is pointing to the prior consolidation below the breakout.
Russell 2000 U.S. Small Cap Index (click chart to enlarge; IWM, RUT):

Breakout but must hold and move higher.
3. Gold Market Timing (GLD):
No change. In fact this week, GLD is barely back above that upper red line in the chart below!
SAME: Things are shifting… We’ve gone from “recession risk” and “multiple cuts” as well as “don’t fight the Fed” to “Three cuts and done.”
SAME MAJOR POINT: IF the Fed lags inflation, gold wins, but if it front runs inflation, gold loses on a relative basis. My contention as said above is that Federal Reserve bias will now be against raising rates prior to the election, so inflation will get a boost! Gold wins…but it must perform on the charts to prove it!
SAME Technicals: Gold is just below that key top red line, and slightly above the 2013 lower high. If it breaks and GDX breaks, I’ll likely be lowering my exposure to gold. Holding above that 2013 lower high on the chart…for now.
The Gold ETF (click chart to enlarge; GLD): That top red line is 137.80. The market “has my number” as I say. It tested below, but the gold Bears got nowhere with it. At least so far… When the market changes, we change.
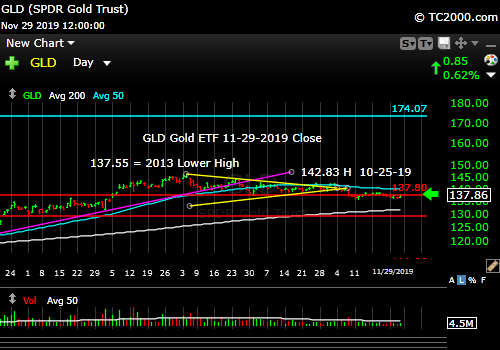
Barely above that top red line.
4. Interest Rate Market Timing (10 Year Treasury Yield; TNX, IEF, TLT):
Rates have been in a holding pattern all week. Follow the bouncing ball up or down.
SAME: As long as the Federal Reserve stays “Neutral,” rates will be rangebound barring a left field event, a.k.a. a “Black Swan event.” Lower rates imply the Fed medicine is not working yet/ever. I believe it’s a waste of time to lower rates except as a temporary goosing of the economy, and it has a negative impact on savers and on inflation (raises inflation due to down dollar). The modern Federal Reserve has taken on the job of managing the economy, which has eventual consequences we will have to pay in real dollars. They hurt the poor by taking away their interest on savings. What they are really doing is helping to levitate the stock market by making rates so low, companies borrow money to buy their stock back. It is perverse, and there will be payback.
Check out the “Market Signal Summary” below – after you review the following chart…
U.S. 10 Year Treasury Note Yield (click chart to enlarge; TNX, IEF, TYX, TLT, TBF):
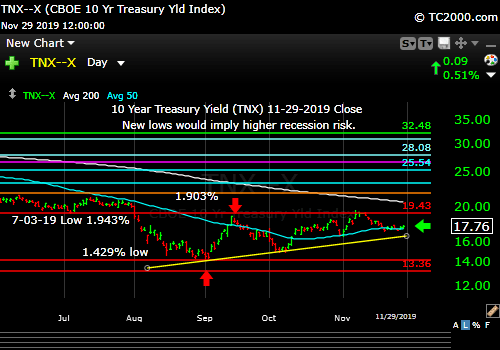
Five days of “sideways” meaning consolidation.
Now let’s review three key market timing signals together….
Do not use these signals as a trading plan. They are rough guidelines. I currently share my BUYS and SELLS in as timely a way as possible on social media (links above).
MY MARKET SIGNAL AND TREND SUMMARY for a Further U.S. Stock Market Rally with Real GDP Growth (“Real” means above inflation):
Stock Signal GREEN for a further U.S. stock market rally with a longer term Bullish and short term Bullish SP500 Index trend. The stock signal is based on small caps, as they often lead the market down. The small caps have now broken out and that breakout MUST be preserved and extended.
Gold Signal YELLOW for a further U.S. stock market rally longer term Bullish Trend and a short term NEUTRAL Gold Trend. The current pattern is a warning sign. The longer term Bullish trend will evaporate if it breaks below the current level by much at all.
What gold does mostly as I’ve written HERE is follow real interest rates around the world (if you own “gold in dollar terms” you care about U.S. rates most of all). The rest of the world does matter however, including massive buying by central banks.
Remember, gold may be down but not yet out, because if the Fed lags inflation, gold will win. Since I am predicting a “lagging Federal Reserve” into the 2020 Election, inflation will win, and gold and oil will win.
GUIDE: “Remember GLD is being used as an indicator for the ECONOMY here.” If gold continues to rise, it means the market believes real rates will fall, which in the current context means the global economy is slowing. That would ultimately hurt U.S. stocks.
Rate Signal YELLOW for a further stock market rally with a longer term BEARISH and short term Bullish 10 Year Yield Trend. (Remember: higher rates mean lower bond and Treasury prices). Whether the short term trend should be called Neutral vs. Bullish is arguable at this time, but it’s not Bearish yet. There is actually an even longer term view that says rates have been in a neutral trading pattern since 2011, but the above two views are more practical on a trading/intermediate term investing basis.
I’ll leave this reminder from 9-20-2019’s issue: “Remember, FOUR Fed cuts will NOT be a “mid-cycle adjustment” and would be taken badly by the market ironically, considering the market’s addiction to lower rates. A fourth cut means the Federal Reserve is seeing recession risk as significantly high.”
Also for Reference: “Rates usually RISE slowly in a strong recovery and the stock market rally continues as they rise, as I’ve repeated multiple times on social media and here. Empirically though, rates that are “lower” (than 3.11%) and are NOT rising rapidly have allowed the market to rise.”
I said weeks ago, “Watch the oil price too. Higher oil tends to mean higher rates.” It closed at 58.11 vs. 57.77 last week. Still holds: If it rises above 58.82 and then 60.94, oil and oil stocks will be off to the races. 63.38 would be the next target. Since May, the price of oil almost appears to have been managed to stay between 50 and 59/barrel. I wonder why? 😉
Just a reminder: If TNX bounces too quickly and too high, this will give rise to Rate Shock III… As said before: “Watch the rate at which TNX climbs if the current trend reverses. If it shoots up very fast, stocks will correct.” In the Sept. 28th issue: “A rapid push higher in rates would mean trouble for stocks, as occurred in early 2018. That’s what I called ‘Rate Shock.'” I called the period of rising rates in early October #RateShockII.
Another Reminder: “The risk lately has been ‘Falling Rate Shocks.’ (I changed the term from “Negative Rate Shocks” because there are in fact negative rates in a lot of countries now. First we had ‘Falling Rate Shock I’ in December 2018 (because rates FELL while the Fed raised the Fed Funds rate 0.25% in mid-December, in what was perceived as a policy error by critics), ‘Falling Rate Shock II’ in May 2019, and ‘Falling Rate Shock III’ in August 2019. The Stock Market Bulls had better hope that they don’t get more rate cuts past October.
Thank you for reading. Would you please leave your comments below where it says “Leave a Reply”… or ask a question or report a typo…
Pay it forward by sending the link to MarketTiming.Blog (that link will immediately connect them to this webpage) to a relative or friend. Thanks for doing that.
Be sure to visit the website for more general investing knowledge at:
Standard Disclaimer: It’s your money and your decision as to how to invest it.
I thank Worden Brothers for the charting system I use to post these charts. If you want to know more about the charting system I use every day, contact me. It makes it much easier to follow along with me if you can see the charts and manipulate them on your own computer. It’s a great investment to have an excellent charting system.
Note: I’ve updated my criteria for the equity signal for a further U.S. stock market rally to the following: GREEN = Bullish, YELLOW = Neutral, RED = Bearish. In other words, the colors tell you whether the signal supports the stock rally or not, while the Bullish, Neutral, and Bearish designations are about the trend.
A BEARISH trend signal does not mean we should not buy. A BULLISH trend signal does not mean you cannot sell some exposure. It depends on what is going on in the economy and how oversold/overbought the market is at a given point whether the Bearish signal is to be sold or bought, sold on the next bounce, etc. and whether a Bullish signal is to be bought or if profits should be taken. A NEUTRAL trend signal does not mean the end of the Bull or Bear. It means to wait and look for possible subsequent entry points within the existing trend, Bull or Bear, but preserve capital if the entry fails. Our strong intention is to buy low and sell high. By the way, I will keep showing the prior orange “Trigger lines” in the IWM and GLD charts for now as reference points only; they have historical value for us from the post-2016 election period.
Copyright © 2019 By Wall Street Sun and Storm Report, LLC All rights reserved.

Thanks
Sure Charles!