A Market Timing Report based on the December 06, 2019 Close, published Saturday, December 7th, 2019…
I deliver focused comments on market timing once a week. These are supplemented with daily “Tweets/StockTwits” (see links below) and comments in the “markettiming” room on StockTwits.
I provide quite a bit of intraweek commentary, and if you don’t see it, you will miss out on quite a bit of context, so please click on the StockTwits link below and have a read… Thank you as always for being loyal readers and interacting on social media with your questions and comments!
1. SP500 Index Market Timing (S&P 500 Index®; SPY, SPX):
The week began with a dip as my Bull Market Health Score suggested it might. But that dip did not turn into a correction. A “dip” is defined in my “New Rules” HERE. The drop was -3.81% from the high on 11-29-19. But later in the week as the China trade deal seemed to be still in negotiation, we got a very strong employment report of 266,000 new jobs with upward revisions that drove the 3 month average job creation to 205,000 per the Bureau of Labor Statistics, which handily beat the glum +67,000 number in the often NON-correleated ADP Employment Report on Wednesday.
For those of us who remember what it was like in the melt-up years in the late 1990’s before the cascading market crash of the NASDAQ in the early 2000’s (78% drop!) there are a few things very much and some not so much in common between the two periods:
1. We have a lot of web based “software as a service” companies commanding nosebleed valuations, although they are fewer in number vs. back then. The business models are not as ridiculous by any means. And valuation is a tricky thing to trade. A miss can shave 10-20% off a stock like that in a day. A surprise can add the same in a day. If you can sleep with that in your portfolio, good, but make sure you balance those sorts of stocks out with steady growers.
If risky (high beta vs. SPX) stocks are 10% of your portfolio, you can lose 50% and still only give up 5% of your net worth to see that rise to 20% or more (if not, it’s not worth it!). You would obviously trim back as you went along to keep your risk level constant, and I would (and do) take out 100% profits when I have them, and then ride the gravy with a more generous stop.
2. The economy is strong and jobs reports are coming in very positive. I remember back then how the Bears were looking for the first sign of weakness they could use to make their gains and how the Bulls could not be convinced there was ANY risk in what they owned. I helped many people at that time of much higher valuations save their retirement accounts and their kids’ college accounts from decimation (testimonials at sunandstorminvesting.com).
3. A President is being impeached. The case details were worse for Bill Clinton however, because they had the obstruction of justice charge fleshed out. When Bill Clinton was impeached in 1998 the Republicans controlled both Houses of Congress. In the Senate trial vote on “February 12, Clinton was acquitted on both counts as neither received the necessary two-thirds majority vote of the senators present for conviction and removal from office – in this instance 67. On Article One [lying to a grand jury and witness tampering], 45 senators voted to convict while 55 voted for acquittal. On Article Two, 50 senators voted to convict while 50 voted for acquittal [67 required to convict on any one count]. Consequently, Clinton remained in office for the balance of his second term.” Ref. Note that the first count was about his lying to a grand jury about having sex with Monica Lewinsky, but the closer vote for him (still 17 votes short of conviction) was the second count of obstruction of justice. This is what it contained (same Ref.)…
“Article II charged Clinton with attempting to obstruct justice in the Jones case by:[28]
- encouraging Lewinsky to file a false affidavit
- encouraging Lewinsky to give false testimony if and when she was called to testify
- concealing gifts he had given to Lewinsky that had been subpoenaed
- attempting to secure a job for Lewinsky to influence her testimony
- permitting his lawyer to make false statements characterizing Lewinsky’s affidavit
- attempting to tamper with the possible testimony of his secretary Betty Currie
- making false and misleading statements to potential grand jury witnesses”
This is where Trump is most vulnerable, but that case has not been made convincingly without interviews of key witnesses like Trump’s former White House Counsel Don McGhan II, as well as NSA Chief Bolton, Sec. of State Pompeo, and Acting Chief of Staff Mick Mulvaney. Trump is not as vulnerable in my view on the notion that the “ask” on the Bidens was enough, or even that holding up the military aid is enough to remove him. On the “ask,” the Republicans are attempting to say it was OK for Trump to tie the Biden investigation announcement by Ukrainian President Zelensky to the quid pro quo of the release of military aid and a White House meeting which would bolster Zelensky’s standing vs the Russians (and there WAS a quid pro quo per multiple witnesses including both Trump’s Chief of Staff Mulvaney as well as EU Ambassador Sondland). The Republicans are saying that asking for a SPECIFIC investigation is the same as asking Pres. Zelensky to investigate corruption in general, which it is clearly not but…
One could say that regardless of the specificity of the President’s targeted request, he had “the right” as President to ask for the investigation if there was reasonable doubt about what went on between Biden, the Ukrainian government, and his son Hunter, who did receive a ridiculous amount of money from a corrupt Ukrainian gas company, the business of which he knew little about. That sort of money transfer to people connected to those in power, however, was not and is not now illegal. It SHOULD be made illegal (there should ideally be a relationship between value added and the payments for those hired who have/have had a meaningful political connection “families of government officials, elected or otherwise and those officials themselves), but it isn’t and wasn’t illegal for Hunter Biden to be paid the huge sums, so the premise that Trump had probable or good cause to ask Zelensky to specifically investigate the Bidens is absurd.
That said, and I would censure Trump for his behavior, because it COULD be argued that Trump was trying to influence the election, and I personally believe and intuit directly he was attempting that, but one can argue as the Republicans are that the “ask” alone is not enough to remove a president from office. I believe that effort will fail. If there were a pattern of this, beyond publicly telling Russian and China to investigate his opponents, then the Democrats would have a strong case of widespread and repeated abuse of power. At this point, they don’t have enough evidence in my view.
In sum, the House will impeach and the Senate will acquit Trump and we’ll move on to the 2020 Election barring further evidence. If the Democrats insist on the Senate trial, which now seems likely, Trump could be less damaged than if he were censured in my view. Acquittal implies “Trump didn’t really do anything awful.” Be clear – what he did WAS awful. If Obama had done the same, the GOP would have rushed to force him out. Censure is serious and says Congress agrees that what the President did was awful and should not be repeated, or he would suffer removal from office. P.S. Giuliani is still in very big trouble.
Last week I said, “This was the week of the small cap breakout. If it is maintained, the entire market should continue higher.” On the other hand, a reversal for the small caps would likely be lethal for the market’s further immediate rise. It would accelerate a bigger correction. Decisions, decisions…”
The market seems to have made a decision and all we need next week is another high higher in ALL CAPS than the 11-29-19 high, and the market rally should continue. Small, mid, and large caps must come along for that ride, but small caps would benefit most as they are higher beta and are down more off their prior high.
Remember the SP500 Index is still running somewhat on borrowed time as the stretch in the market has for several weeks been similar to what happened to the market in Jan. 2018. That ended badly in Feb. 2018 as you recall.
What about the Fed rate cuts? I’ve seen some writing about how they are going to be helping now because their impact works on a lag. Here are the dates (Ref.):
| Jul 31 | 2.25% | Fed lowered rate despite steady growth |
| Sep 18 | 2.0% | Fed was concerned about slowing growth. |
| Oct 30 | 1.75% | Slow global growth and muted inflation. |
If it is true that they worked on a lag, why have interest rates been rising since the Sept. 3, 2019 low, and how long is that lag really? The Fed says it’s 6-9 months. I think the market has taken care of much of that lag already. The 10 Year US Treasury Yield (TNX) was 2.061% on July 30, 2019 with a Fed Funds rate of 2.25% the next day. That drop in TNX was on the EXPECTATION the Fed would lower rates eventually.
On January 4, 2019 Powell started hinting that the Fed would not hike further and in fact the economy was vulnerable to further slowing as noted HERE. The bounce off the Dec. 24th closing low was dramatic and it continued until the first significant dip in early March that ended on 3-08-2019. “Don’t fight the Fed,” an often repeated mantra generally is the truth. When it comes to negative interest rates in the EU, I think the mantra has failed them. Going negative still resulted in growth slowing in Germany to near zero. (Things MAY be improving a bit now, but it’s all very tentative.)
What has been happening since the Sept. 3, 2019 interest rate low is more than a snap-back off a stretch lower; it is also a reaction to what is coming. I laid this out over the past couple of weeks. The Federal Reserve is now boxed in, barring extreme changes in the incoming data to being a “Fed Stuck In Neutral.”
The Federal Reserve is politically on hold, because any tightening would be attacked viciously by Trump as an attempt to throw the election, just as a former Fed governor has suggested that they do (He was a fool to suggest it! It’s not the Fed’s job to be political.). They won’t act in that way deliberately, because it risks the survival of the institution of the Fed. Why do you think they raised rates on Dec.19, 2018 as the market was already falling? They were focused on inflation, not full employment. They felt the economy was already at full employment when it hit 5% unemployment and now we’re back at 3.5%, the Sept. 2019 low. But they will be forced to allow inflation to rise a bit more than they would have previously.
What does this mean?
1. Rates will continue to rise given the growing economy vs. a “Fed Stuck In Neutral,” hurting bond investors and driving more money into stocks IF rates rise slowly. Rate shocks are a big negative, as I summarize at the base of this report.
2. That will help gold and the value of other “stuff,” like commodities and oil as long as the economy does not in fact pick up real steam from here. If it did, gold would fall as real rates fall (see my summary on how gold pricing works HERE). The reason gold has not broken down badly (but it’s weak as you’ll see below) I believe is because the market realizes the Fed is stuck. When the Fed can raise rates as the economy grows, it keeps real rates positive which gold dislikes, and possibly even keeps real rates rising, which gold hates. That’s why gold could do OK despite the economy picking up (if it does!). But beware after the 2020 Election and also follow the inflation numbers, because the Fed has a mandate to do its job. It can allow some excess inflation vs. what it would have allowed in Dec. 2018, but there is a limit.
Let’s turn to the state of the market…
What would satisfy me that the Bulls are serious?
The Bull Market Health Score this week is Bulls 3.5/Bears 1.5 vs. Bulls 4.0/Bears 1.0 last week. It’s a 5 point scoring system .
For each checklist item below, I give you the points scored as Bullish or Bearish.
1. New high? Bulls 1.0 Answer: Yes. I’m giving it a yes here, because the price is back in the prior higher channel (red lines at top in the chart below).
2. V*IX trend favorable? Bulls 0.5 Answer: Neutral. The VIX Game Score is Bulls 6/Bears 1 at a VIX of 13.62 (Friday close) vs. 12.62 the prior week, which is above my “Bull Nirvana” number, the 7th VIX Game Score point. The Bulls need to retake that 7th point next week and then take a run on 12.00ish.
3. AD % Line in an Uptrend? (This is a proprietary stat; see base of report.): Bulls 0.5 point. Answer: Neutral. The close was 16,937 vs. 16,909 last week. Another new high is needed to turn the full point over to the Bulls. It’s not unreasonable for that number to be below the prior high as the market is below its prior high.
4. Higher volume on Up Moves? Lower volume on Down moves? Bulls 0.5 point. Answer: Neutral. The move up on Weds was with some increase in volume, but not impressively so. The move on Fri. was big, but the volume did not match it.
5. Is the “U.S. Index Matrix Signal,” as I call it, positive? (To be positive, small and mid caps must be doing as well as large caps) Bulls 1.0 point. Answer: Yes. The small caps initially lost and then regained the breakout I’ve been following with you.
Let’s check in on the context around the price action of the market by looking at the current Market Risks…
We have some new earnings data this week on Q4 2019…
Earnings Risk/Opportunity: What is shown are the projections in the FactSet 3-15-19 report followed by the reports from 4-12-19 through 8-09-19 with a skip of two weeks until the 8-30-19 data resumes the weekly data sequence followed by a skip for the week of 11-29-19 (details HERE)… The larger arrows “—>” indicate 3 weeks of of omitted data in order to compress the data.
For Q2 2019, analysts are projecting earnings growth of 0.1% —> -1.3% -> —> -2.1% —> -2.6% -> -2.6% -> -3.0% -> -1.9% -> -2.6%-> -1.0% -> -0.7% -> -0.4% DONE
and revenue growth of 4.6% —> 4.3% —> 4.1% —> 3.8% -> 3.8% -> 3.7% -> 3.8% ->4.0% ->4.1% -> 4.1% -> 4.0% DONE
For Q3 2019, analysts are projecting earnings growth of 1.8% —> 0.8% —> 0.3% —> -0.5% —> -1.9% —> -3.6% -> -3.7% -> -3.8% -> -3.7% -> -4.1% -> -4.6% -> -4.7% -> -3.7% -> -2.7% -> -2.4% -> -2.3% -> -2.2% DONE (FactSet did not say whether the numbers changed vs. their prior report on 11-22-19. Final number may not be accurate)
and revenue growth of 4.4% —> 4.4% —> 4.2% —> 3.8% —> 3.2% -> —> 2.9% -> 2.8% -> 2.8% -> 2.8% -> 2.8% -> 2.7% -> 2.6% -> 2.8% -> 3.1% -> 3.2% -> 3.1% -> 3.1% DONE (FactSet did not say whether the numbers changed vs. their prior report on 11-22-19. Final number may not be accurate)
For Q4 2019, analysts are projecting earnings growth of 8.1% —> 7.5% —> 7.2% —> 6.3% —> 4.9% -> 4.5% -> 3.9% -> 3.5% -> 3.4% -> 3.2% -> 3.0% -> 2.9% ->2.6% -> 2.3% -> 1.5% -> 0.7% -> -0.4% -> -1.1% -> -1.4% -> -1.4% -> -1.5%
and revenue growth of 4.8% —> 4.8% —> 4.6% —> 4.3% —> 4.0%-> 4.0% -> 4.0% -> 4.0% -> 3.8% -> 3.7% -> 3.6% -> 3.6% -> 3.6% -> 3.5% -> 3.2% -> 3.0% -> 2.6% -> 2.6% -> 2.5% -> 2.5% -> 2.6%
For CY 2019, analysts are projecting earnings growth of 3.4% —> 3.2% —> 2.7% —> 1.7% —> 1.4% -> 1.3% -> 1.3% -> 1.3% -> 1.2% -> 1.1% -> 0.7% -> 0.6% -> 0.3% -> 0.1% -> 0.0% -> 0.1% -> 0.2%
and revenue growth of 4.7% —> 4.7% —> 4.5% —> 4.4% —> 4.3% -> 4.2% -> 4.1% -> 4.1% -> 4.1% -> 4.1% -> 4.0% -> 4.0% -> 4.0% -> 4.0% -> 3.9% -> 3.8% -> 3.8%
For Q1 2020, analysts are projecting earnings growth of 10.5% —> 9.8% —> 8.5% -> 8.2% -> 8.1% -> 7.9% -> 7.9% -> 7.8% -> 7.6% -> 7.3% -> 6.7% -> 6.0% -> 5.6% -> 5.3% -> 5.1% -> 5.3% -> 5.2%
and revenue growth of 6.2% —>5.8% —> 5.6% -> 5.7% -> 5.5% -> 5.5% -> 5.4% -> 5.4% -> 5.5% -> 5.3% -> 4.8% -> 4.7% -> 4.5% -> 4.5% -> 4.5% -> 4.4% -> 4.4%
For Q2 2020, analysts are projecting earnings growth of 13.3% —> 13.5% -> 12.0% ->12.6% -> 10.7 -> 9.9% -> 9.3% -> 9.2% -> 9.1% -> 9.0% -> 9.0% -> 8.7% -> 8.6% -> 7.7% -> 7.3% -> 6.7% -> 6.6% -> 6.4% -> 6.7% -> 6.7%
and revenue growth of 6.8% —> 6.6% -> 6.7% ->6.6% -> 6.5% -> 6.4% -> 6.5% -> 6.4% -> 6.4% -> 6.3% -> 6.3% -> 6.3% -> 5.9% -> 5.2% -> 5.2% -> 4.9% -> 5.0% -> 4.9% -> 4.9% -> 4.9%
For CY 2020, analysts are projecting earnings growth of 10.7% -> 10.6% -> 10.6% -> 10.6% -> 10.5% -> 10.6% -> 10.4% -> 9.9% -> 9.8% -> 9.7% -> 9.7% -> 9.9% -> 9.8%
and revenue growth of 5.6% -> 5.6% -> 5.6% -> 5.6% -> 5.7% -> 5.6% -> 5.3% -> 5.3% -> 5.3% -> 5.4% -> 5.5% -> 5.5% -> 5.5%
In summary, Q4 will be the 4th negative quarter of earnings growth in a row similar to what happened in 2015-2016. Back then the pullback was from the 5-2015 top to the 2-2016 low 15.2%, just above my boundary between correction and Mini Bear Market (see the link above to my “New Rules.” This time? The worst corrections have been around -5-8% or so, the worst being in May at -7.63%. The August decline on Trump’s comments about the China deal being delayed was -6.80%. Those are mild corrections in my ranking of pullbacks. They are very common in Bull markets.
Why the corrections this time are so much milder likely has to do with the more favorable tax environment under Trump. It’s not magic. Fiscal stimulus pulls demand ahead. The consumer has been supporting this market for a reason – the consumer has more cash available post-tax cuts. We pay for it later. That’s what history tells us. Families that use credit cards to fund vacations have a great time, until the time comes to pay for them. Then not so much fun is had. Same idea.
Here’s a Brief Review of the Other Market Risks at Hand:
China Deal Risk: There is some noise on both sides, but I favor the Peter Boockvar scenario he outlined with Rick Santelli this week @CNBC. He said the Chinese have to make a decent deal now, because the two sides probably won’t negotiate anything else prior to the election. They’d have to wait until 2021, which is why the Chinese want some tariffs lifted NOW. The threats on Hong Kong are just threats I believe, because Xi cannot risk not making a deal with Trump now. If Xi reacts to those bills, he’s taking his eye off the ball.
Fed Rate Cut/Hike Risk:
NOTE: The CME Group Data on their website Friday was in error as I had suspected they were. The Sept. through Dec. 2020 numbers have been corrected below using data from Monday, Dec. 9, 2019 at around 9:48 am.
There has been a continued increase in perceived risk of another RATE CUT by September 2020. The odds are about 50:50 (just under) for the next Fed rate cut to occur July 29th, 2020.
The Fed has cut three times and said it was done unless things get worse for the economy. As I’ve said previously: “THREE cuts is a mid-cycle adjustment. Four cuts or more mean the Federal Reserve expects a recession.” A hike in rates in the near future would tank the U.S. stock market.
Now the probability is 0% for a 4th cut in mid-December as assessed by CME Group. The risk was 22.1% 6 weeks ago. The risk of a rate HIKE is 0.7% vs. 4.4% 3 weeks ago.
What about January? The odds of cut #4 is 8.8% vs. 8.5% last week vs. 12.4% 2 weeks ago vs. 35.8% 4 weeks ago vs 67% 8 weeks ago! The odds of a HIKE in Jan. are 0.7% vs. 4.0% last week vs. 5.8% 2 weeks ago.
What about March? The odds are 20.8% this week vs. 16.2% last week vs. 23.3% 2 weeks ago vs. 75.1% 8 weeks ago for 4 or more cuts in total. March hike? 0.6% vs. 3.7% last week vs. 5.0% 2 weeks ago.
April Cut? 30.1% vs. 26.5% last week vs. 34.8% 2 weeks ago vs. 52.6% 3 weeks ago vs. 79.7% 8 weeks ago expect there to be 4 or more cuts. April hike? 0.5% vs. 3.2% last week vs. 4.2% odds 2 weeks ago.
June cut? 40.0% vs. 36.6% last week vs. 43.5% 2 weeks ago vs. 56.7% 5 weeks ago expect four or more cuts by then. Probability of a hike is 0.4% vs. 2.7% last week vs. 3.6% 2 weeks ago vs. 10.2% 3 weeks ago vs. 0% 4 weeks ago.
July? 47.9% vs. 46.6% last week vs. 49.4% 2 weeks ago vs. 60.7% 4 weeks ago expect 4 cuts by then. A hike? 0.4% vs. 2.3% last week vs. 3.2% 2 weeks ago vs. 9.2% 3 weeks ago.
What are the rest of the available “4 (or more) cut odds”? Sept. 2020? 56.2% vs. 51.7% last week vs. 58.9% 2 weeks ago vs. 53.2% 3 weeks ago vs. 38.7% 4 weeks ago vs. 65.2% 5 weeks ago. Sept. 2020 Hike? 0.0% vs. 2.1% last week vs. 2.6% 2 weeks ago vs. 8.1% 3 weeks ago. Nov. 2020 cut: 59.2% vs. 56.5% last week vs. 62.9% 2 weeks ago vs. 57.3% 3 weeks ago vs. 41.6% 4 weeks ago vs. 69.3% 5 weeks ago. Nov. hike? 0.0% vs. 1.8% last week vs. 2.3% 2 weeks ago vs. 7.2% 3 weeks ago. Dec. 2020 Cut: 64.7% vs. 62.6% last week vs. 66.5% 2 weeks ago vs. 61.7% 3 weeks ago and 73.8% 5 weeks ago. Dec. hike? 0.0% vs. 1.6% last week vs 6.3% 2 weeks ago.
At least among those in the interest rate futures markets, the perceived odds of a recession or at least Fed action by September continuing into December 2020 will be required to prevent a recession or make it more shallow is slightly higher than it was last week.
Either way it means the risk of a recession even if shallow in extent and duration, is possible only 9-10 months off. Markets react early to events in the future, some say by 6 months or more.
I pointed out the increased odds of that by Sept. 2020 just last week. The stock market is NOT discounting a recession at this point. Not at all.
The Risk of a Neutral Fed: There is risk of inflation on the one hand and more slowing on the other. Prior: “Ultimately the change by the Federal Reserve in going to “Neutral” was NOT positive for the U.S. equity market, but it ignored it. It won’t ignore it if economic slowing does not reverse itself going into 2020.”
U.S. Iran War Risk: SAME. Interestingly quiet. No change for weeks. More stable after the leak of the “Iran Annihilation Plan HERE. Funny how they simply seemed to shut up isn’t it? The media has mostly missed this connection. But that’s OK as we’ll “let sleeping dogs lie.”
2020 Election Risk: See last week’s post. The entry of Bloomberg makes things more difficult for Joe Biden, but he’s still the favorite to win the Dem nomination by far now. Losing in Iowa and New Hampshire won’t look good though.
Still, everyone else including Buttigieg is too weak at this point to win the nomination. Things can change. A serious Sanders challenge could shake the markets. His health is in big question still. He looks old and his body was acting like it wanted to die recently, which won’t encourage voters except his strongest supporters. He also “wrote the damn bill” that intends to shove One Payer Healthcare down your throat. Whether good or bad, Americans LOVE choice and competition.
Warren has been wounded by Buttigieg as extreme and I believe controlling (shove it down your throat healthcare vs. a public option, just as Bernie supports), while Harris is out (quite deservedly so for what was essentially her racist attack on Biden on, you guessed it, racism! She was inauthentic in the debates, and Americans smelled it a mile away. I’m not saying she’s a bad person at her core. I’m saying she acted badly.).
Having heard a more recent interview of Biden, I believe he can win. He has to avoid confrontations to some extent, but then again as I’ll get to in one second, it could help him with a lot of voters. I discussed Bloomberg last week. He’d have to come out of his shell to win. He won’t likely suddenly transform his personality. America wants a fist fight in 2020: Trump vs. Biden. Bloomberg sticks to statistics. Biden says he’d like to take Trump behind the shed and have at him. Not the highest energy approach for sure, but that’s what America wants at this time. May God help us!
Trump Impeachment Risk: Little change this week after falling after the hearings. Impeachment Risk: 100% now. The Democrats have cornered themselves into a “fail-safe flight to the finish” (look up the movie!). Conviction Risk? Still near zero. The Constitution does not matter to the GOP.
Deficit/Debt Threat: No Change: Trump is now beating Obama at something! The size of his deficit! It’s bigly. Read THIS. The deficit is up 26% to $964 Billion for fiscal 2019, the HIGHEST IN 7 YEARS!
I’ll leave this here as a monument to our monumental debt, which could threaten interest rates in the future. When rates rise, there will be “heck to pay.” The U.S. dollar remains at risk and having at least 5% of your non-real estate net worth in gold exposure is a reasonable hedge in any portfolio. Some say higher, but owning stocks is also a hedge that over time would work out for solid companies, even in the face of very high inflation (after the market came back from a deep swan dive!).
Current Scenario…
Despite the extra push up above trend we are seeing (the higher channel in the chart below), the prior pattern we saw earlier in 2019 could repeat itself. A further melt-up and then a substantial correction, which could be months away and may be poll dependent. If Biden fails to gain traction for example, Trump might be considered a shoe in for a second term vs. anyone left on the Dem field. Democrats may want to consider how much they attack Biden over the next few months, because they are then working for Trump IMO. I’ve studied these candidates enough to understand how this election can turn into a disaster for Democrats, at least at the level of the Presidency.
A final high will be reached prior to the discounting of a recession, which brings on a ‘Big Bear Market.’ Whether the market moves up a bit more and drops, corrects immediately, OR rises now to a final (for the cycle) all time high, we are not yet at the all time high in my opinion. There is more upside to come, if not now, then later, before the final high.
Conclusion for This Section: Given the stretched status of large caps, I will likely only add small cap exposure or specific stock exposure in the U.S. and/or ETF exposure OUTSIDE the U.S. from here on out until the overbought state of the U.S. market corrects itself. Follow social media this coming week to see what I add. I am still overexposed to the U.S. in equities and have been since Feb. 2018 when I correctly pivoted out of foreign stocks into U.S. stocks at and near the Feb. 2018 low.
Back to the charts….
Now take a look at the SP500 chart. The long upper yellow line is now at about 3068 at the Friday close. The two short upper red lines show a narrow range in a gentle up trend, rising ABOVE the prior upper trend line.
As I warned three weeks ago, if the market keeps pushing above that top long yellow line, there will be eventual payback.
SP500 Large Cap Index (click chart to enlarge; SPX, SPY):

Another new high?
Now let’s check in on two “Canary Signals” we’ve been following:
“Intel-igent Market Timing Signal” (Intel; I*NTC; * there to throw off the crawlers!): Neutral. SAME: “The stock is stuck below the April ATH. Why should it break out if the U.S. GDP is due to slide to below 1%? The June 4 high of 57.60 has been exceeded, and the April high of 59.59 is the next test to achieve a new all time high.” The NY Fed says GDP for Q4 will be 0.58% and the Atlanta Fed using the exact same numbers says 2.0%. Take your pick! Following my canaries may be more productive than following GDP predictions as the latter are usually way off!
Bank of America (B*AC) Market Timing Signal: STILL TRUE -> Bullish, but needs to push higher soon. It looked like it was breaking down on Tues., but is back above the 33.05 breakout. “It will only hold the breakout if, rates keep climbing. Sell a reversal at least on a close or sell on a close with a reversal on higher volume IMO.”
Keep up-to-date during the week at Twitter and StockTwits (links below) where a combined 34,181 investors are following the markets with me…
Follow Me on Twitter® Follow Me on StockTwits®. (real time messages are ONLY on StockTwits until Twitter reforms its policies, but we’ll have it as a backup system)
Join the Conversation in the StockTwits “MarketTiming” Room
Now let’s go on to review investor sentiment…
Survey Says!
Sentiment of individual investors (AAII.com) showed a Bull minus Bear percentage spread of +2.59% vs. +3.36% last week.
Here is what I said last week: “Even more so today: Sentiment should be peaking if this is in fact a top. It is not a top. It could be a temporary top, but it’s not ‘The Top.’ The move down from a spread of around 15% [three] weeks ago is not enough to dislodge the Bulls. Sentiment can wobble down and then back up without more than a dip of a few percent.” The market did in fact wobble down and back up. Sentiment is nowhere near a top.
| Bulls | Neutrals | Bears |
| 31.72% | 39.16% | 29.13% |
| Thurs. 12 am CT close to poll | ||
2. U.S. Small Caps Market Timing (IWM):
We now have the breakout, but it must hold. If rates turn back down, it won’t likely hold. It’s a buy, particularly if IWM continues higher Monday to a new recent high.
Russell 2000 U.S. Small Cap Index (click chart to enlarge; IWM, RUT):

Breakout is recovered.
3. Gold Market Timing (GLD):
No change. In fact this week, GLD is barely BELOW that upper red line in the chart below, and a new low was not reached!
SAME: Things are shifting… We’ve gone from “recession risk” and “multiple cuts” as well as “don’t fight the Fed” to “Three cuts and done.”
SAME MAJOR POINT: IF the Fed lags inflation, gold wins, but if it front runs inflation, gold loses on a relative basis. Follow the chart though, not the noise from talking heads.
This week it’s even more likely the Fed will CUT again before it hikes (again, if the CME numbers are correct).
SAME Technicals: If it breaks lower and GDX breaks, I’ll likely be lowering my exposure to gold. Holding above that 2013 lower high on the chart…for now.
The Gold ETF (click chart to enlarge; GLD): That top red line is 137.80. The market “has my number” as I say. When the market changes, we change.
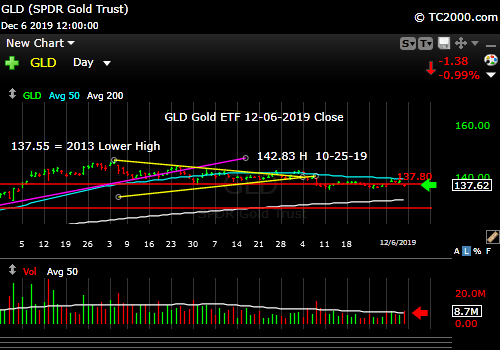
Gold on the edge…
4. Interest Rate Market Timing (10 Year Treasury Yield; TNX, IEF, TLT):
Rates are in an ascending triangle on an intermediate term basis. That is Bullish. They did not continue breaking down. I added some corporate bond exposure Friday (average effective maturity of just over 10 years), because rates had reached an overbought level. But I’ll add slowly.
SAME: As long as the Federal Reserve stays “Neutral,” rates will be rangebound barring a left field event, a.k.a. a “Black Swan event.” Lower rates would imply the Fed medicine is not working yet/ever or that more is needed. I believe it’s a waste of time to lower rates except as a temporary goosing of the economy, when things are truly bad, and lower rates have negative impacts on savers and on price inflation (raises inflation due to down dollar).
Check out the “Market Signal Summary” below – after you review the following chart…
U.S. 10 Year Treasury Note Yield (click chart to enlarge; TNX, IEF, TYX, TLT, TBF):

Trend still up in rates.
Now let’s review three key market timing signals together….
Do not use these signals as a trading plan. They are rough guidelines. I currently share my BUYS and SELLS in as timely a way as possible on social media (links above).
MY MARKET SIGNAL AND TREND SUMMARY for a Further U.S. Stock Market Rally with Real GDP Growth (“Real” means above inflation):
Stock Signal GREEN for a further U.S. stock market rally with a longer term Bullish and short term Bullish SP500 Index trend. The stock signal is based on small caps, as they often lead the market down. The small caps have now broken out and that breakout MUST be preserved and extended.
Gold Signal YELLOW for a further U.S. stock market rally longer term Bullish Trend and a short term NEUTRAL Gold Trend. The current pattern is a warning sign. The longer term Bullish trend will evaporate if it breaks below the current level by much at all. This still looks like a correction vs. a breakdown until it does not!
What gold does mostly as I’ve written HERE is follow real interest rates around the world (if you own “gold in dollar terms” you care about U.S. rates most of all). The rest of the world does matter however, including massive buying by central banks.
Remember, gold may be down but not yet out, because if the Fed lags inflation, gold will win. Since I am predicting a “Federal Reserve Stuck In Neutral” into the 2020 Election, inflation will win, and gold and oil will win.
GUIDE: “Remember GLD is being used as an indicator for the ECONOMY here.” If gold continues to rise, it means the market believes real rates will fall, which in the current context means the global economy is slowing. That would ultimately hurt U.S. stocks.
Rate Signal GREEN for a further stock market rally with a longer term BEARISH and short term Bullish 10 Year Yield Trend. (Remember: higher rates mean lower bond and Treasury prices). Whether the short term trend should be called Neutral vs. Bullish is arguable at this time, but it’s not Bearish yet. There is actually an even longer term view that says rates have been in a neutral trading pattern since 2011, but the above two views are more practical on a trading/intermediate term investing basis.
I’ll leave this reminder from 9-20-2019’s issue: “Remember, FOUR Fed cuts will NOT be a “mid-cycle adjustment” and would be taken badly by the market ironically, considering the market’s addiction to lower rates. A fourth cut means the Federal Reserve is seeing recession risk as significantly high.”
Also for Reference: “Rates usually RISE slowly in a strong recovery and the stock market rally continues as they rise, as I’ve repeated multiple times on social media and here. Empirically though, rates that are “lower” (than 3.11%) and are NOT rising rapidly have allowed the market to rise.”
I said weeks ago, “Watch the oil price too. Higher oil tends to mean higher rates.” It closed at 59.20 vs. 58.11 last week. Still holds: If it rises above 58.82 (YES) and then 60.94 (NOT YET), oil and oil stocks will be off to the races. 63.38 would be the next target. Since May, the price of oil almost appears to have been managed to stay between 50 and 59/barrel. I wonder why? 😉 OPEC says it will cut more production than expected as of Friday, but we’ll follow the charts!
Just a reminder: If TNX bounces too quickly and too high, this will give rise to Rate Shock III… As said before: “Watch the rate at which TNX climbs if the current trend reverses. If it shoots up very fast, stocks will correct.” In the Sept. 28th issue: “A rapid push higher in rates would mean trouble for stocks, as occurred in early 2018. That’s what I called ‘Rate Shock.'” I called the period of rising rates in early October #RateShockII.
Another Reminder On Falling Rates: “The risk lately has been ‘Falling Rate Shocks.’ (I changed the term from “Negative Rate Shocks” because there are in fact negative rates in a lot of countries now. First we had ‘Falling Rate Shock I’ in December 2018 (because rates FELL while the Fed raised the Fed Funds rate 0.25% in mid-December, in what was perceived as a policy error by critics), ‘Falling Rate Shock II’ in May 2019, and ‘Falling Rate Shock III’ in August 2019. The Stock Market Bulls had better hope that they don’t get more rate cuts past October.
Thank you for reading. Would you please leave your comments below where it says “Leave a Reply”… or ask a question or report a typo…
Pay it forward by sending the link to MarketTiming.Blog (that link will immediately connect them to this webpage) to a relative or friend. Thanks for doing that.
Be sure to visit the website for more general investing knowledge at:
Standard Disclaimer: It’s your money and your decision as to how to invest it.
I thank Worden Brothers for the charting system I use to post these charts. If you want to know more about the charting system I use every day, contact me. It makes it much easier to follow along with me if you can see the charts and manipulate them on your own computer. It’s a great investment to have an excellent charting system.
Note: I’ve updated my criteria for the equity signal for a further U.S. stock market rally to the following: GREEN = Bullish, YELLOW = Neutral, RED = Bearish. In other words, the colors tell you whether the signal supports the stock rally or not, while the Bullish, Neutral, and Bearish designations are about the trend.
A BEARISH trend signal does not mean we should not buy. A BULLISH trend signal does not mean you cannot sell some exposure. It depends on what is going on in the economy and how oversold/overbought the market is at a given point whether the Bearish signal is to be sold or bought, sold on the next bounce, etc. and whether a Bullish signal is to be bought or if profits should be taken. A NEUTRAL trend signal does not mean the end of the Bull or Bear. It means to wait and look for possible subsequent entry points within the existing trend, Bull or Bear, but preserve capital if the entry fails. Our strong intention is to buy low and sell high. By the way, I will keep showing the prior orange “Trigger lines” in the IWM and GLD charts for now as reference points only; they have historical value for us from the post-2016 election period.
Copyright © 2019 By Wall Street Sun and Storm Report, LLC All rights reserved.
