A Market Timing Report based on the June 18, 2021 close…
What’s the Market Timing Set-up Now?
The economy is recovering thanks in large part to the success of the pharmaceutical industry in creating highly effective vaccines in record time. Trump does get credit for helping to speed things up, which is ironically the reason why some say they won’t take it. Both the Former President and First Lady were vaccinated, but his followers don’t seem to care.
Liberal voters are also among the anti-vaxers going back even before Trump: “In 2015, the Pew Research Center conducted a survey of 2 thousand adults which concluded about 12 percent of liberals and 10 percent of conservatives believed that childhood vaccines are unsafe.” (Ref. here) The total of the two groups is 22%. Of course the one thing they agree on is negative for society as a whole and for the economy potentially.
Why does this matter? It matters because the continuation of the pandemic among the anti-vaxer population will not only cause further morbidity (Long-COVID Disease, the kind that lasts for many months) even among younger people who are infected as well as killing older people with weaker immune systems, especially those who have medical issues.
Anti-vaxers will continue to kill off other anti-vaxers, but also expose the rest of us who are vaccinated to new mutants that arise in their infected bodies. That has the potential to start an entirely new pandemic all over again.
However, take a breath, because the variants have not escaped the vaccines, due to the human body’s killer T-cell response, which kills off virally infected cells, even though antibody titers are lower in response to some variants.
Still, the variants are more infectious among the unvaccinated. That means that the sizable unvaxed population will continue to create more genetic variants of the SARS-CoV-2 virus (the viral cause of COVID-19 disease).
COVID-19 still entails a finite risk to our economy. Eventually a variant could arise and evade the vaccines. It has not happened yet, but the longer the delay of ridding or at least dramatically reducing the amount of virus in circulation, the more likely that will be. That’s why getting the vaccine is really a patriot duty unless a patient has an allergy to vaccines or some other special and rare issue.
We send soldiers off to war to be killed to protect the homeland. If no one served our country, because everyone thought “something might happen to me,” how in the world could we ever defend ourselves? There is one alternative to vaccination that is acceptable. The unvaxed would need to wear an N-95 mask any time they are around others (and not some piece of cloth or second rate blue surgical mask either; the N-95 mask is the only mask worth wearing if you are going to bother to wear one IMO. Both Trump’s and Biden’s administrations failed to produce N-95 masks in sufficient quantities. Did the double cloth masks and the blue surgical masks help? Yes, but N-95s would have prevented more infections and deaths.).
The persistence of COVID-19 and the lack of vaccination outside the U.S. is also a threat for the same reasons I cited above.
On the plus side, it also provides a longer time period in which the recovery will occur, so it will effectively drag out the recovery period and the stock market returns that go with it.
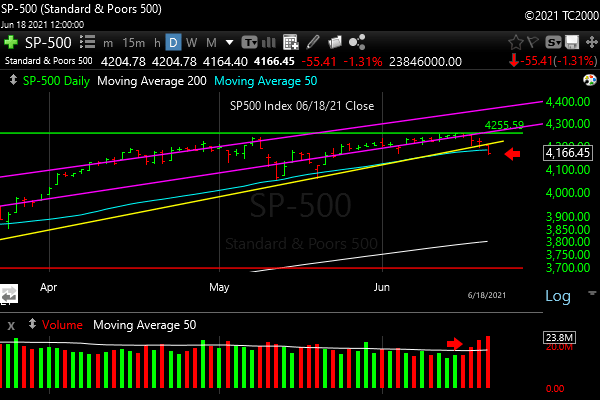
1. SP500 Index Market Timing (S&P 500 Index®; SPY, SPX):
Price is at least testing below both the lower channel line (magenta) and the longer term trend line (yellow line; shown at higher magnification below)…

Shorter term trend lines broken.
You can see the SP500 Index price is just below the 50 day moving average, and it has broken both the tighter trend established after the election as well as the trend line connecting the pre-election and March lows. Note the rising volume with the selling. That’s a negative.
One can still argue this is a test below the 50 day moving average. Early this week, the market must rally, or this will turn into a significant correction (link to my definitions of dip/rally etc. at the link referred to below).
In the March pullback, there was just one close below the 50 day mav and then the market bounced. Any more weakness will lead to another leg down.
Higher magnification!
Keep up-to-date and read my comments on the current setup during the week at Twitter and StockTwits (links below) where a combined 35,452 investors are following the markets with me…
Follow Me on Twitter® Follow Me on StockTwits®. (real time messages are on StockTwits as always and back on Twitter)
Join the Conversation in the StockTwits “MarketTiming” Room (I’ll publish comments in the room periodically.)
Now let’s review investor sentiment…
Survey Says!
Sentiment of individual investors (AAII.com) showed a Bull minus Bear percentage spread of +14.9%, which was on the Fed statement day. That’s a relatively low reading of Bullishness, but tells us little, as it’s not at an extreme in either direction. I would say that it’s highly unlikely that we’ve seen a top, as sentiment normally maxes out at market tops. There is still too much of a wall of worry to climb for the rally to be over, even if we see a deeper correction this month, mid-summer, or fall.
| Bulls | Neutrals | Bears |
| 41.1% | 32.7% | 26.2 |
| Thurs. 12 am CT close to poll | ||
In terms of Dow history this century there have often been dips in the month of June (rank 10; 3rd worst month). September (rank 12) has also typically been negative (the #1 worst month). January (rank 11) is the 2nd worst month for the Dow this century, and February (9) is slightly negative as well (4th worst month). That said the strongest months for the Dow in order from top down are April (1), November (2), July (3), October (4), December (5), and March (6). August (8) is barely above flat, and May (7) is barely below flat.
The average Dow drops are all less than 1% for the negative months, but that’s because we’re considering the average results here. Obviously you can still be up nicely for a longer period such as a year and still be down several percent in a given month. July and October exceed 1% average returns and April and November exceed 2% average returns. In the end the market goes up over time because the indexes contain companies that are successful in creating higher value for their businesses, because bad businesses are kicked out, and because of inflation. Earnings rise in part due to inflation. Stock prices follow earnings.
Now let’s look at the small caps, gold, and interest rates…
2. U.S. Small Caps Market Timing – Russell 2000 U.S. Small Cap Index (click chart to enlarge; IWM, RUT)
Small caps are trading down from a lower high, coming off a significant series of tops. That keeps them in consolidation. A breach of that lower yellow line would raise concern for lower lows and a much deeper correction or mini-Bear market. This downturn needs to end within 3 days or so or small caps will sustain more damage. Potential “levels” to consider as I call them include the 200 day moving average or the Sept. 2018 high, which would be a 24.7% mini-Bear market as I define them. I doubt we are headed into anything more than a correction for several reasons I will summarize at the end.
I call “levels” what others call “targets,” a term which really means nothing. A level only becomes a target once proven to be significant. Just look at how many times the 50 day mav has been broken in the chart below. It was NOT predictive of a bigger downturn in small caps.
I assess what other people call “targets” in real time to determine whether they are tradable and/or investable or not. That assessment is not always correct, but it’s generally better than just blindly buying. Because of the real time nature of this process, it’s best to follow me on social media (links above) to stay connected…
I let my followers know when I make buy AND sell decisions. You’ll see many on social media who buy stocks constantly and never sell. How can that be? That is not reality. Otherwise they are giving up huge profits during certain periods as stocks and markets crash. You can use my stated actions to inform your own investment decisions, even if you don’t change your allocations as often as I do. I hold many investments long term, but some I trade more aggressively to preserve profits and capital.
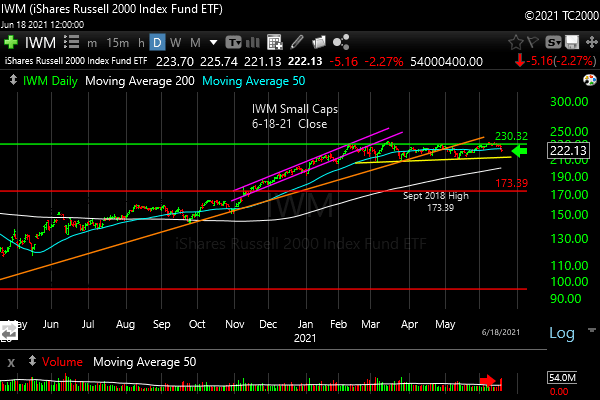
Coming down from a lower high of the recent trading range.
3. Gold Market Timing (click chart to enlarge; GLD): Gold is being crushed again based on the impression many market participants have (right or wrong) that short term rates will rise again as the Fed ratchets down their balance sheet as well as ratchets up interest rates by 2023 vs. the previously guess they would do that in 2024. Of course, they have no idea when they’ll do any of that. It depends on the economy as well as fiscal and tax policy. Many argue inflation will come back down from current levels due to the fact that there will be no more stimulus payments. The free money deals are over.
Regardless of what we think will/won’t happen at the Fed, gold traders clearly had a “net belief that “The Fed will contain inflation sooner than we thought.” Gold is protection against inflation, so it fell.
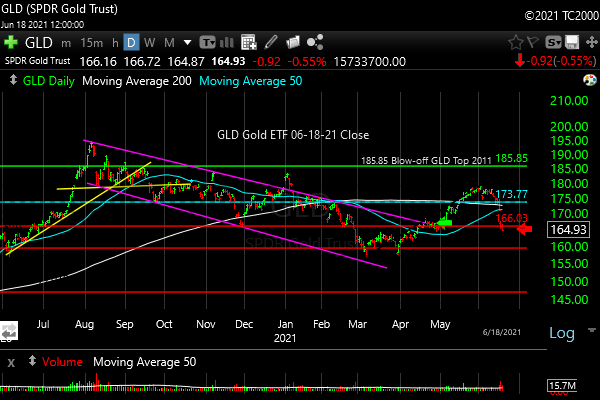
Gold hit by expectations of interest rate hikes sooner than previously expected.
Check out the “Market Signal Summary” below – after you review the following chart…
4. Interest Rate Market Timing (10 Year Treasury Yield; click chart to enlarge; TNX, IEF, TLT): The 10 Year Yield close was at the 6-11-21 low of 1.450% one week ago. A close below there would re-assert the recent downtrend. Further downside would cause more trouble for the reopening sectors of XLB, XLE, XLF, XLI, and XLRE. Those are the sectors that depend on the continued success of the U.S. and global reopening process. A reversal back above the 1.471% low of May 7th, could lead to a resumption of the uptrend in rates and help those four sectors tremendously.
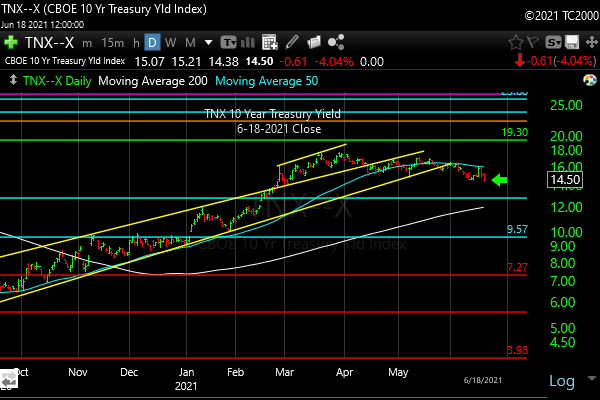
The 10 Year Treasury Yield closed at the 6-11-21 low. It is leaning into a downtrend, unless things change next week.
How Much More Downside Is There?
Regardless of the immediate outcome for rates just discussed, I believe this move down will be contained as a dip to a buyable modest correction (see my definitions under “New Rules” in the October 26, 2018 issue HERE). Why?
1. The Fed is not yet lowering the size of their balance sheet OR raising rates. They are just using words to goose the markets, a trick called “jawboning.” The market is not going to sell off steeply IMO at a time when reopening is still on ongoing process.
2. The drag on reopening will lengthen the rally of the stock market. Slower reopening abroad will help our multinationals as well as the economies and stock markets of the slow to recover countries.
3. Sentiment has not peaked yet. Sentiment invariably gets fully giddy at big tops, and the meme stock mania is a fairly localized sideshow. Overvalued tech stocks have taken their beating already. Despite that, the SP500 Index went UP! Older, wiser investors have far more money invested in, and still to be invested in, this market.
4. Valuations ARE high, but they often go higher than anyone expects before the bell rings on Wall Street.
5. Rates have eased and are low enough to support the economy. That takes some pressure off of higher valuation tech stocks for now. That’s why they have been recovering a bit.
I remain at just under 100% of my usual maximum exposure for a Bull market for those reasons.
I believe the Fed will lag behind on inflation, and the 10 Year Treasury will resume its rally as the economy continues to recover and expand. From what level is the question, but instead of obsessing on answering the unanswerable, we can simply follow the lead of various market indexes…
Now let’s review three key market timing signals together….
Do not use these signals as a trading plan. They are rough guidelines. I currently share my actual BUYS and SELLS in as timely a way as possible on social media (links above).
MY MARKET SIGNAL AND TREND SUMMARY for a Further U.S. Stock Market Rally with Real GDP Growth (“Real” means above inflation):
Stock Signal NEUTRAL for a further U.S. stock market rally with a short term Neutral and longer term Bullish SP500 Index trend. The immediate trend break is the issue here (same as in March!). The small caps determine the stock signal in this section of the report. If they are strong/weak, generally the SPX is strong/weak too.
Gold Signal GREEN for a further U.S. stock market rally. The Gold Trend is short term Bearish and longer term Bearish. Economic glitches that arise will help gold. Unconstrained fiscal spending will help as well over time, but not while the economy is recovering at a reasonable pace and real rates (the yield in excess of inflation) are rising.
Kept for Reference: “Gold can RISE with stocks when real rates are FALLING, and the dollar is falling. Gold HAD recently been falling with rising real rates, despite US dollar weakness, because the stock market is made more attractive by the combination of 1. Rising real rates (a direct threat to gold which pays nothing; banks and other companies make more money with rising rates) and 2. Economic recovery with higher corporate earnings (stocks pay dividends, rise in value as they grow, and buy back stock; gold pays nothing).
However, gold fell hard this past week because the Fed is hinting at hiking short rates, which is never good for gold, because gold has no real return.
In liquidity crunches (which the Fed is supposed to prevent) gold can drop with everything else but the US dollar.”
What gold does mostly as I’ve written HERE is follow real interest rates around the world (if you own “gold in dollar terms” you care about U.S. rates most of all). The rest of the world does matter however, including massive buying by central banks.
GUIDE: “Remember GLD is being used as an indicator for the ECONOMY here.” If gold continues to rise again, it means the market believes real rates are going to fall or stay negative for a period of time. Investors tend to stay out of gold particularly when stocks are doing well as they provide a higher real return.
Rate Signal: Bearish for a further U.S. stock market rally. Rates are back to falling in the near term. The 10 Year Yield trend is short term Bearish, and intermediate term NEUTRAL to Bearish. (Remember: higher rates mean lower bond and Treasury prices and vice versa). We want slowly rising rates in a recovering economy. That’s what happens. What we don’t want is rapidly rising OR falling rates, both of which I call “Rate Shocks.”
Thank you for reading. Would you please leave your comments below where it says “Leave a reply”… or ask a question if you like…
Pay it forward by sending the link to MarketTiming.Blog (that link will immediately connect them to this webpage) to a relative or friend. Thanks for doing that.
Be sure to visit the website for more general investing knowledge at:
Standard Disclaimer: It’s your money and your decision as to how to invest it.
I thank Worden Brothers for the charting system I use to post these charts. If you want to know more about the charting system I use every day, contact me for any questions, or click HERE. Please use that link when you sign up as I am an affiliate (I don’t make much, but it may help to pay for some of my website expenses). It makes it much easier to follow along with me if you can see the charts and manipulate them on your own computer. It’s a great investment to have an excellent charting system.
Note: I’ve updated my criteria for the equity signal for a further U.S. stock market rally to the following: GREEN = Bullish, YELLOW = Neutral, RED = Bearish. In other words, the colors tell you whether the signal supports the stock rally or not, while the Bullish, Neutral, and Bearish designations are about the trend.
A BEARISH trend signal does not mean we should not buy. A BULLISH trend signal does not mean you cannot sell some exposure. It depends on what is going on in the economy and how oversold/overbought the market is at a given point whether the Bearish signal is to be sold or bought, sold on the next bounce, etc. and whether a Bullish signal is to be bought or if profits should be taken. A NEUTRAL trend signal does not mean the end of the Bull or Bear. It means to wait and look for possible subsequent entry points within the existing trend, Bull or Bear, but preserve capital if the entry fails. Our strong intention is to buy low and sell high. By the way, I will keep showing the prior orange “Trigger lines” in the IWM and GLD charts for now as reference points only; they have historical value for us from the post-2016 election period.
Copyright © 2021 By Wall Street Sun and Storm Report, LLC All rights reserved.

Very good market analysis
Thank you Charles!