A Market Timing Report based on the October 01, 2021 close…
What’s the Market Timing Set-up Now?
We are getting through COVID-19 one way or another. The easy way is vaccination. The hard way is resisting vaccination based on anti-scientific views and comments by video bloggers who get far too much attention. But this group of unvaccinated people turns out to be a bit more complicated than the media generally discusses.
Who are the unvaccinated who continue to place the U.S. economy at risk? There are 70 million of them, more than the population of the United Kingdom by 1.7 million, but there is a catch to that number. Some of them have been “naturally vaccinated” by SARS-CoV-2, and although some data seems to support the idea that vaccine immunity is better, I do not believe natural immunity has been fully studied. There should be such studies as antibody testing in most labs is a crude, yes or no, and no routine testing is done to look at T-cell immunity.
Around 44 M Americans have been infected (possibly 2-3 times that number due to asymptomatic infections, particularly in younger patients), although there are not good stats I was able to find on how many of the infected are among the vaccinated. Those who had a bad case of the virus were likely subsequently vaccinated to avoid getting back into the same situation.
Those who have not been infected or vaccinated are of course fully capable of keeping some level of pandemic going for many months, albeit at a lower and lower level as they become infected.
There should be trials of the vaccine among previously infected people to resolve the issue of natural immunity. Investigators need to look at rates of reinfection, hospitalization and death in the naturally immune vs. infection plus one shot of mRNA vaccine vs. infection plus two shots of mRNA vaccine. (I only recommend the mRNA vaccines as no DNA is involved, so no DNA enters the nuclei of any of the patient’s cells. If you’ve had a JNJ vaccine I would not worry about it. The potential risks are likely very small.)
It may well be that just one dose of an mRNA vaccine would be enough to give the previously infected a high level of protection. Dr. Fauci has commented that that is the case from early data. Are they going to be required to have two shots when they may only need one? It should be studied.
The following applies to the uninfected and unvaccinated. I covered this in the last issue, but it bears repeating. “In 2015, the Pew Research Center conducted a survey of 2 thousand adults which concluded about 12 percent of liberals and 10 percent of conservatives believed that childhood vaccines are unsafe.” (Ref. here) The total of the two groups is 22%, which is about equal to the group who are still resisting vaccination.
Their resistance really won’t likely matter (it does matter spiritually, but not practically), however painful it is for their families to see a number of them hospitalized and/or die. The Delta Variant is 2-3 times as infectious as the original version of the SARS-CoV-2 virus that causes COVID-19. It will find the vaccine holdouts and naturally vaccinate them if they aren’t vaccinated. That means the pandemic, barring a strain that is too resistant to the current vaccines, will burn itself out over time.
The emergence of a vaccine-evasive variant remains a risk to our economy, which is why we need to be exporting billions of doses of vaccine to the rest of the world. Get vaccinated or get infected and suffer the consequences of being unvaccinated. That’s the choice, unless you plan on being a hermit for the next 2-3 years.
COVID-19 still entails a finite risk to our economy. It is disrupting supply chains around the globe and driving global inflation. You can see it if you shop. Multiple items normally stocked on supermarket shelves are entirely absent at this point as waves of infection have rolled over various regions of the country and shut down or slowed production.
This still holds: On the plus side, it also provides a longer time period in which the recovery will occur, so it will effectively drag out the recovery period and the stock market returns that go with it. That is why I bought this last correction as documented on my social media feeds (see links just below).
My last post mentioned the following seasonal patterns for the Dow. The worst month of the year is September, which has once again been the case.
However, the strongest months for the Dow in order from top down are April (1), November (2), July (3), October (4), December (5), and March (6). August (8) is barely above flat, and May (7) is barely below flat.
October, November, and December then are all in the top 5 months of the year, which is where we’ll be for the next 3 months. That means we have seasonality on our side.
Follow Me on Twitter® Follow Me on StockTwits®. (real time messages are on StockTwits as always and back on Twitter)
Keep up-to-date and read my comments on the current setup during the week at Twitter and StockTwits (links below) where a combined 35,452 investors are following the markets with me…
1. SP500 Index Market Timing (S&P 500 Index®; SPY, SPX):
The SP500 Index has tested below the lower channel line (magenta) in what amounts to a correction by my definitions, but the SP500 Index held the lower low set on Sept. 20th, at least as of the Oct. 1st close. The close on 9-30-21 was minus 5.25% off the top, which just makes it into my “Correction” category of slips. If you don’t know them, they are HERE ( on that page, scroll to “New Rules” in blue type)
Click the chart to see the details…

Has it bottomed?
Now let’s review investor sentiment…
Survey Says!
Sentiment of individual investors (AAII.com) showed a Bull minus Bear percentage spread of -12.6%, which is not at an extreme of negativity. This is the most negative it’s been since almost exactly one year ago on Sept. 30th, when it was at -16.8% declining from -21.1% the previous week. Although there is room for it to go lower, it doesn’t have to do so. There is also room for it to the upside. Extremes of sentiment are the most helpful. We are not at an extreme.
| Bulls | Neutrals | Bears |
| 28.13% | 31.1% | 40.7% |
| Thurs. 12 am CT close to poll | ||
Now let’s look at the small caps, gold, and interest rates…
2. U.S. Small Caps Market Timing – Russell 2000 U.S. Small Cap Index (click chart to enlarge; IWM, RUT)
Small caps are trading in the middle of the range established starting with the February high. It’s a weekly chart to make that point. They’ve been consolidating (going sideways) since then, while testing investors patience. Buying the low end of the trading range and selling the high end turned out to be the way to make money on them.
I expect GDP to strengthen more than expected as we unwind both the impact of COVID-19 as well as the shortages that the virus produced. That gives us both inventory build and revenue growth, both adding to GDP growth. A significant part of the existing inflation is COVID-19 related, so it may dissipate over time, while some may be stickier.

Small caps are in a trading range. Trade the range and any break UP or DOWN.
What we have is economic (GDP) growth with inflation, which is an optimal time to own stocks as long as inflation does not become excessive. It may currently seem excessive vs. what it has been of late, but it’s not extraordinarily high vs. history.
And the combination of growth and inflation accelerating is one of the wrong times to own an excess of gold (beyond “insurance gold” as I call it).
So let’s get to gold…
3. Gold Market Timing (click chart to enlarge; GLD): I only had to change a few words of this – mainly, the dates! Gold is being crushed again based on the impression many market participants have (right or wrong) that short term rates will rise again as the Fed ratchets down their balance sheet as well as ratchets up interest rates by 2022 (changed from 2023) vs. the previous guess they would do that in 2023 (changed from 2024). They will taper the balance sheet as soon as the next meeting. Rate increases will be data dependent as well, and will depend not only on the economy, but also upon fiscal and tax policy.
Many argue inflation will come back down from current levels due to the fact that there will be no more stimulus payments to individuals. But President Biden has plans to inject lots of money via infrastructure and social programs that are being negotiated. Both bills will be passed, although the number for the social infrastructure Build Back Better package is under negotiation. The bills must be passed by the Democrats, or they’ll lose credibility.
Regardless of what we think will/won’t happen at the Fed, gold traders clearly have had a net belief that “The Fed will contain inflation sooner than we thought.” Gold is protection against inflation, so it fell.
However, watch the Sept. 21st close of 166.04. A GLD move above there, which is the close prior to the Fed FOMC statement on Sept. 22nd, would be positive. Gold bounced on Sept. 30th and consolidated on Oct. 1st to close at 164.84.
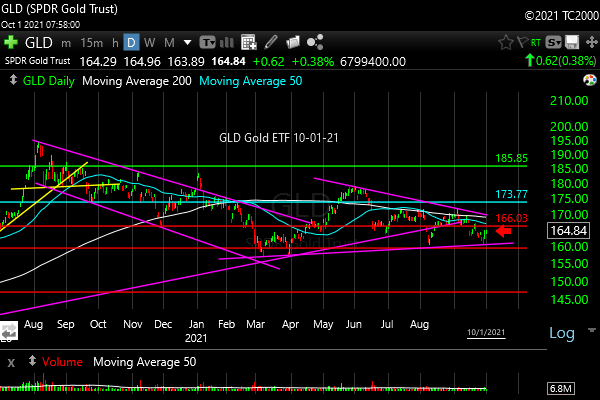
Weak in the face of a strengthening economy and rising interest rates.
Check out the “Market Signal Summary” below – after you review the following chart…
4. Interest Rate Market Timing (10 Year Treasury Yield; click chart to enlarge; TNX, IEF, TLT): See caption. You see the yellow line that stopped the recent rise in rates? If it goes up through there, you’ll know what the market thinks about inflation being under control. Higher rates would mean increasing inflation concerns.

Interest rates will rise. The only questions are how much and how fast.
What Downside Risks Are There?
1. This Changed: The Federal Reserve will start as early as the next meeting to taper the size of their balance sheet, but the Treasury and mortgage backed security buying is not going to be done for a while. Then and likely only then, will they raise the Fed Funds rate.
2. Still on: The drag on reopening will lengthen the rally of the stock market. A slower reopening abroad will help our multinationals show increasing sales over time, as will the economies and stock markets of the slower to recover countries.
3. Check: Sentiment has not peaked yet. It will before this is over. There is plenty of cash sitting and making nothing with increasing inflation. Those investors are losing buying power as they sit in too much cash.
4. Check: Valuations ARE high, but they often go higher than anyone expects before the bell rings on Wall Street.
I remain at just over 100% of my usual maximum exposure for a Bull market for those reasons. NOTE: I change my exposure when things change, led first and foremost by stock market signals. Don’t be surprised if I drop my exposure from 100% to 80% or less, in one day at some point. (I don’t share my raw exposure to stocks for a reason. Your allocation should depend on your net worth, your age, and your need for cash in the next 4 years among other things. Find the number that suits you…)
I believe the Fed will lag behind on inflation, and the 10 Year Treasury will rise further, but how much higher and how fast remain questions…
Now let’s review three key market timing signals together….
Do not use these signals as a trading plan. They are rough guidelines. I currently share my actual BUYS and SELLS in as timely a way as possible on social media (links above).
MY MARKET SIGNAL AND TREND SUMMARY for a Further U.S. Stock Market Rally with Real GDP Growth (“Real” means above inflation):
Stock Signal NEUTRAL for a further U.S. stock market rally with a short term Neutral and longer term Bullish SP500 Index trend. The small caps determine the stock signal in this section of the report. They are in a trading range and have been for months.
Gold Signal GREEN for a further U.S. stock market rally. The Gold Trend is short term NEUTRAL and longer term Bearish. Economic glitches that arise will help gold. Unconstrained fiscal spending will help as well over time, but not while the economy is recovering at a reasonable pace and real rates (the yield in excess of inflation) are rising. Real yields on the U.S. 10 Year Note are now negative though they are rising… Click on “Daily Treasury Real Yield Rates” HERE. They were -1.08 in August and were -0.89 on 10-08-21. They are becoming less negative, which is negative for gold that likes falling real yields…
Kept for Reference: “Gold can RISE with stocks when real rates are FALLING, and the dollar is falling. The dollar has been stronger of late, due to the Fed’s planned pivot, but it may start to weaken again as fiscal spending continues.
These are thing gold doesn’t like: 1. Rising real rates (bonds/Treasuries become a threat to gold which pays nothing; banks and other companies make more money with rising rates) and 2. Economic recovery with higher corporate earnings. Earnings drive stock prices higher. Stocks pay dividends that compete with bonds, and companies use cash to buy back stock, which drives up stock prices, while gold pays nothing.
In liquidity crunches (which the Fed is supposed to prevent) gold can drop with everything else but the US dollar.”
What gold does mostly as I’ve written HERE is follow real interest rates around the world (if you own “gold in dollar terms” you care about U.S. rates most of all). The rest of the world does matter however, including massive buying by central banks. Real interest rates have been rising around the globe. Bad for gold.
GUIDE: “Remember GLD is being used as an indicator for the ECONOMY here.” If gold continues to rise again, it means the market believes real rates are going to fall or stay negative for a period of time.
Rate Signal: Bullish for a further U.S. stock market rally. Rates are back to rising in the near term. The 10 Year Yield trend is short term Bullish, and intermediate term NEUTRAL to Bullish depending on the time frame considered. (Remember: higher rates mean lower bond and Treasury prices and vice versa). We want slowly rising rates in a recovering economy. That’s what happens. What we don’t want is rapidly rising OR falling rates, both of which I call “Rate Shocks.”
Thank you for reading. Would you please leave your comments below where it says “Leave a reply”… or ask a question if you like…
Pay it forward by sending the link to MarketTiming.Blog (that link will immediately connect them to this webpage) to a relative or friend. Thanks for doing that.
Be sure to visit the website for more general investing knowledge at:
Standard Disclaimer: It’s your money and your decision as to how to invest it.
I thank Worden Brothers for the charting system I use to post these charts. If you want to know more about the charting system I use every day, contact me for any questions, or click HERE. Please use that link when you sign up as I am an affiliate (I don’t make much, but it may help to pay for some of my website expenses). It makes it much easier to follow along with me if you can see the charts and manipulate them on your own computer. It’s a great investment to have an excellent charting system.
Note: I’ve updated my criteria for the equity signal for a further U.S. stock market rally to the following: GREEN = Bullish, YELLOW = Neutral, RED = Bearish. In other words, the colors tell you whether the signal supports the stock rally or not, while the Bullish, Neutral, and Bearish designations are about the trend.
A BEARISH trend signal does not mean we should not buy. A BULLISH trend signal does not mean you cannot sell some exposure. It depends on what is going on in the economy and how oversold/overbought the market is at a given point whether the Bearish signal is to be sold or bought, sold on the next bounce, etc. and whether a Bullish signal is to be bought or if profits should be taken. A NEUTRAL trend signal does not mean the end of the Bull or Bear. It means to wait and look for possible subsequent entry points within the existing trend, Bull or Bear, but preserve capital if the entry fails. Our strong intention is to buy low and sell high. By the way, I will keep showing the prior orange “Trigger lines” in the IWM and GLD charts for now as reference points only; they have historical value for us from the post-2016 election period.
Copyright © 2021 By Wall Street Sun and Storm Report, LLC All rights reserved.

Thank you David.
You are very welcome Charles!