A Market Timing Report based on the January 21, 2022 close…
3-25-2022 UPDATE
This morning, the SP500 Index challenged the market timing reversal I posted about on 3-22-22. A “Reversal of the Reversal” will not or would not be taken lightly by the market if it occurs. I am talking about a reversal of SP500 Index below it’s December low. It went UP through there the other day and should it reverse, it would be a bad prognostic sign.
Earlier today SPX got to about 6 pts from the reversal level. SPX could even go to the Feb. high from here and reverse and still be within the bounds of an early Bear Market.
At this point we are talking about the risk of a “Mini Bear Market,” by my “New Rules” definitions (see Oct. 26, 2018 issue for the rules; directory is to the right), because recession is not in the picture at this time. Some big firms say the risk of recession is increasing, which would mean even greater losses depending on the degree of GDP slowing.
The next wave down, if the Bulls do lose this fight, is the big one…the “Big Red Wave.” That would wipe out all the gains going back to the day after the 2020 Presidential Election.
My prior “Big Red Wave” warning of this kind was covered by Market Watch in 2018. We reached 88.2% of the way toward the 3rd Wave target in December 2018. Regardless of whether SPX reaches the precise number, it’s a long way down.
In brief, the 3rd Wave Down in this case for the SP500 Index appears in this sequence…
First Wave down was from the SP500 Index all time high (ATH) of 4,818.62 to 4,222.62, the Jan. 24th low.
2nd Wave up occurring as a doublet: The first of these was a bounce to a high of 4595.31 on 2-02-2022. That wave fell back to 4114.65, the Feb. 24th low and gave rise to the 2nd Wave 2 Up that rose to 4,543.06 as of the Friday, 3-25-2022 close. To see this, you do have to look past some noise in between these points. The Wave 2 lows are not perfectly aligned.
The next wave, if the prior pattern in fact breaks lower, would be the largest wave of the Fibonacci series, the 3rd Wave Down, which assuming the current Up wave ends at the same level as the prior wave of the doublet, would bring the SP500 Index to about 3,461. That, as said above, falls within the price range of the day after the 2020 Election, 11-04-2020.
We’ll deal with the 4th Wave Up and 5th wave Down at another time, if this one pans out.
Where is that Feb. high, if SPX moves up just a bit more? It’s only 4.64% off the ATH of the SP500 Index. That’s practically a re-topping of the market!
This is not to predict where the market will go. No one can tell you that. Many have guesses. What I’m indicating is that if the market breaks here or a bit higher, the downside could be considerable, and you may not want to keep the same exposure level you’ve had on the way down.
I will post my exposure level on social media today (links below). It’s down significantly already from my prior exposure when things were clearly Bullish, but I’ll take it even lower if I see the signals I mentioned, and I may trade out of some exposure on the way up with the risk of missing out on some upside.
That carries some “opportunity risk” as I call it, so only make those moves if you intend to buy back exposure after selling it, should you be proven wrong. Notice I said “should you.” Taking 100% responsibility for all our investing and trading decisions is the only path to real success. If you do that, you’ll just keep getting better and better. Use the information you gather to make up your own mind and then take the corresponding actions. That’s the adult version of this game..
In the meantime, please stay in touch via StockTwits and Twitter…
2-25-2022 Market Timing Update
What will Happen with Inflation Going Forward? Is the Tech Stock Wreckage Due to Inflation and Rising Rates Over for Now?
The answer I believe is NO. You will have to be in stocks representing what I am calling #UnqualifiedGrowth IF you choose to buy growth.
We need to use market timing of our stock selection to navigate inflation and be careful about what stocks we buy as inflation continues.
The inflation consensus among people who know what they are talking about (multiple sources) is that inflation has peaked and is likely to come down over time. But it’s likely to remain elevated, despite falling to around a CPI of 3.9% Y/Y by Q3. That’s still well above the Fed target and some say it will remain higher than 4%.
So inflation is stickin’ around. That’s what they mean by “sticky inflation.” It’s continuous high inflation vs. the less than 2% headline CPI we were used to.
==> That means the Fed will be raising rates to some extent even if it slows growth somewhat, because they have to per their mandate as long as the economy does not start to slow too much and as long as unemployment remains low.
==> That means “short rates” will still be rising slowly but steadily (e.g. 2 Year Treasury Notes) but steadily as the Fed actually begins raising rates. That will bring down growth a bit or a lot depending on how fast the Fed hikes, which will cause long rates to fall (e.g. 10 year Treasuries, the yield for which is represented by TNX).
==> That means that any growth stock that has no earnings with even a whiff of revenue slowing will be punished even further as rates rise. Yes, some stocks that are at -30% vs. their prior all time highs (ATHs) will drop to -50%. Those at -50% can drop to -75%.
==> It also means stocks with higher valuations depending on growth will be watched closely. If they miss and their earnings and revenue become questionable in their growth, their prices will also be slashed as well.
==> It also means Value stocks may enjoy a period of outperformance as rates rise. None of the high valuation tech stocks for example should be in the value indexes.
==> Low debt is better as rates rise, so larger companies with better balance sheets will do better. Those are generally larger companies (higher mid to large to mega caps).
CONCLUSION: Larger (large mid to mega) Value stocks and #UnqualifiedGrowth Stocks will outperform the SP500 Index as the Fed raises rates slowly. Lower valuation higher growth stocks will do better than the more expensive ones obviously. When I add to these position, you’ll see it first on social media (links below), and you’ll see me label the trades as “Large Value” or “#UnqualifiedGrowth.”
There are never any guarantees, but this will be my near term to intermediate term internal guidance on picking both stocks and index exposure… Thanks for reading. Click “Like” below if you benefited. Thanks!
…Back to the January Issue….
What’s the Market Timing Set-up Now?
Back in October 2021, I wrote, “We are getting through COVID-19 one way or another. The easy way is vaccination.” The other way is natural infection, and as I predicted before the press caught on, the Omicron variant may help us create a lull of some length in the pandemic much faster than would have otherwise occurred, by infecting nearly all of the unvaccinated people.
Sadly, with many still unvaccinated, the 7-day moving average (mav) of deaths is up to 1,924. Despite that, the 7-day mav of daily new cases peaked in the U.S. on Jan. 14th per the data at Worldometer.com. Hospitalizations and deaths will peak a bit later. This is not unlike the pattern back in Jan. 2021, when the peak occurred on Jan. 11th. This is Bullish for the U.S. economy as warmer temperatures start to occur in a wave from south to north.
How are earnings going for the SP500 Index companies? FactSet reported on 1-18-2022 “Of the 20 S&P 500 companies that have reported actual earnings for Q4 2021 to date, 76% have reported actual EPS above the mean EPS estimate. In aggregate, actual earnings reported by these 20 companies have exceeded estimated earnings by 7.5%. Therefore, at this very early stage of the Q4 earnings season…the magnitude of the positive surprises are trending closer to the five-year average. Since December 31, the earnings growth rate for the S&P 500 [Q4] has increased by 0.4 percentage points (to 21.8% from 21.4%).” Read more HERE.
You’ll also note there that in Year Over Year earnings growth results going forward in 2022, the setup is completely different from last year, when the comparisons were easy due to the earnings recession at the start of the pandemic. Earnings growth was actually NEGATIVE for three quarters in a row from Q1 to Q3 2020. See the graph at the prior link.
U.S. companies are now reporting Q4 calendar earnings, all with easy comparisons. Starting with the next quarter, there will be tough comparisons in Q1 and even tougher comparisons in Q2, which could pressure the equity markets. That will particularly be the case if the Omicron impact on numerous SP500 companies lowers earnings and revenue results for Q1. As said, the Q2 comparison will be even tougher and that is even without any “Omicron slowing” added on. Make sure you are checking regularly for updates on the earnings of the companies you own.
Now let’s consider the technicals of the large caps…
Follow Me on Twitter® Follow Me on StockTwits®. (real time messages are on StockTwits as always and back on Twitter)
Keep up-to-date and read my comments on the current setup during the week at Twitter and StockTwits (links below) where a combined 35,452 investors are following the markets with me…
1. SP500 Index Market Timing (S&P 500 Index®; SPY, SPX):
Back in October, the SP500 Index had already tested below the lower channel line (magenta) in what amounted to a correction by my “New Rules” summarized previously on this blog. If you don’t know my market naming “Rules,” they are HERE (scroll to “New Rules” in blue type). The SP500 Index is solidly back in correction mode at -8.73% as of Friday’s close.
I follow a Market Indicator Panel™ of 20 indicators that flashed some warnings signs on Friday. Two of my indicators stood out as flagging not only the COVID Crash in March 2020, but also the lesser crash in December 2018. There are some caveats to interpreting any signals including those two, however. First, the Bull Stock signal implicated has not reached the level of the Oct. 2020 pre-election low, nor has it reached the extreme level seen at the Jan. 2018 low, and yet it has broken definitively to new recent lows. “Could get worse, but already flashing red” is the summary for that indicator.
The second warning signal is from a Bear Stock indicator, but it’s a marginal one, barely above the recent extremes. Are these signals early warnings or simply too sensitive? They could be confirmed on Monday by having a number of my other indicators chime in with similar crash readings. Two other signals of the 10 are flashing red, but they both gave false positive signals back in the Sept. 2020 correction that lasted several days before reversing, so I can’t use those for confirmation…yet.
What else don’t I like that I’m observing? The midcaps represented by the ETF IJH broke the May 2021 low in a big way on Friday. Will the July low provide support (chart not shown, but you can dial it up on Yahoo Finance etc.)? Perhaps, but it’s not substantial, as it was only one down day below the prior consolidation band. IF we see an UPSIDE reversal back up into the consolidation of midcap US stocks back above that May low, that could indicate the end of the selling.
Another crash signal we got on Friday was the 3rd day small caps have been below the low of their entire consolidation going back to Feb. 2021. Small caps are now just above their 12-31-2020 close of 196.06 at 196.99. That is a loss of 19.42% off the ATH (all time high). They are in a Mini Bear Market all of their own. Remember my terms technically apply only to large caps. In relative terms, when the SP500 Index was down 35% during the COVID Crash, small and midcaps were both down about 45%.
Note that this is the SECOND trend break for the SP500 Index. The first was the lower magenta line. The second is the rising yellow line…
The Two Choices are clear: The market indexes must stop falling very soon, possibly by Monday up to Wednesday, which is Fed day, or the large cap correction will join the small cap crash.
Do not act out of fear; act out of understanding and in steps unless you must immediately protect certain assets such as college funds, money you will need over the nearer term…
Click the chart to see the details…
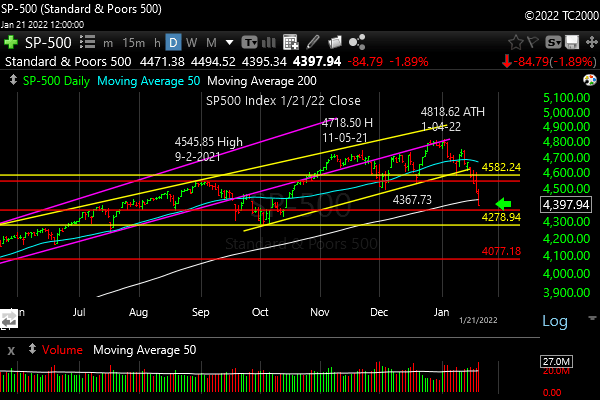
Correction or beginning of a crash?
You can see a couple of levels of interest on the chart above – the August low is closest, and then the October low, which was reached for the QQQ on Friday (just over a point away). (Ignore the lowest red line.) Often key levels pull the market to them in rapid selling periods like these. That’s why I suspect the October low is the first best chance for SPX to catch a bounce. The August level is of interest, because another system of analysis, Fibonacci levels, arrives at at similar conclusion as noted HERE. Even Fibonacci levels are “just levels.” Some work, some don’t!
“Levels” is a term I use very specifically to indicate that I don’t believe in ANY predetermined “targets,” because what I do at them is determined by what I see if/when we get to them. They are just POSSIBLE places to buy or sell for that matter. I’ll let you know on the social media feeds (links above), when I am a buyer.
Now let’s review investor sentiment…
Survey Says!
Sentiment of individual investors (AAII.com) showed a Bull minus Bear percentage spread of -25.7%, which is sizable, but not at an extreme of negativity. The Bearish percent number is the most negative it’s been since the Dec. 1, 2021 low, when Bears were at 42.4%, but the Bull – Bear % spread was a more optimistic -15.7%.
Although there is room for it to go lower, it doesn’t have to do so. There is also room for it to the upside.
The poll for this week ends the day of the Fed meeting on Weds. That is a big risk for the markets IN BOTH DIRECTIONS, because if the stock market is still crashing by then, the Fed through Powell may provide some dovish talk to reverse the recent selling to some extent. Or if he/they provide no reassurance, the markets could crash. There has been talk of up to 5 rate hikes this year, and doing that at a time when earnings will be slowing down on a Y/Y basis, would be overdoing it, most likely. If the Fed doesn’t indicate they may go slower than 4-5 hikes this year, stocks may pay for it.
Whatever I do PRIOR to the Fed statement and press conference, I won’t complete until AFTER, because the Fed news could push the U.S. stock market in either direction. If I get a buy signal before the meeting, I’ll only do part of the buying. For a sell signal, I’ll only do part of the additional selling. I’ve documented my equity exposure reduction on social media. I’ll be updating it this evening…
| Bulls | Neutrals | Bears |
| 21.0% | 32.3% | 46.7% |
| Thurs. 12 am CT close to poll | ||
Now let’s look at the small caps, gold, and interest rates…
2. U.S. Small Caps Market Timing – Russell 2000 U.S. Small Cap Index (click chart to enlarge; IWM, RUT)
Small caps are crashing on high volume. I own close to zero small cap or mid cap exposure with a couple of individual stock exceptions. So much for “following the Wall Street diversification rules.” Diversity in owning crashes is not my cup of tea.
The volume spike on Friday was partially due to options expiration, but it was impressive. It was the most volume recorded for a single day going back to 2017 at least, and more than the peak selling volume in the COVID Crash of 2020. That sends us a message about the seriousness of this selling in my view.
I wrote above about the small cap “3rd day below” a key level, which is part of the trader’s handbook. You sometimes wait up to 3 days to confirm a market move. Friday was day 3 of a bad breakdown for small caps.
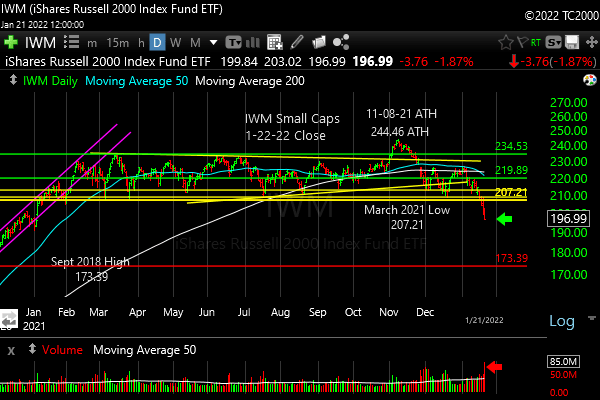
Small caps are crashing.
Let’s get to gold…
3. Gold Market Timing (click chart to enlarge; GLD):
Gold was caught up in the Friday “Sell Everything” pattern. Trade in the direction of the move above the triangle if we see it, but try to buy pullbacks even if you add to your long position on a breakout. But don’t chase it too far to the upside. Buying the dips is a better idea, but without a breakout above that top magenta line, I’ll wait. The recent action is promising, but I’ll wait to see the Bulls eyes up close…
The risk to gold is actually that the Fed moves in a concerted way to control inflation. Rates have been going up while the Fed fell behind. That raises real rates and hurts gold in general. I am concerned now that they cannot pivot away from pursing inflation as their prime goal. They failed to control it, and they are being correctly blamed. They should have raised rates when things were improving in Q3, but the pandemic and wanting employment to return to the prior levels was their focus. So inflation started winning. Rates still rose with inflation, which hurt gold as gold hates rising real rates.
Again, I’ll wait for the breakout…
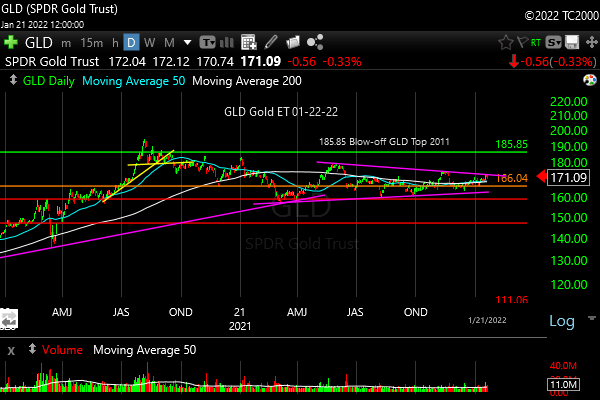
Gold is coming off the top of the triangle. It was dragged into a “sell everything” pattern on Friday.
Check out the “Market Signal Summary” below – after you review the following chart…
4. Interest Rate Market Timing (10 Year Treasury Yield; click chart to enlarge; TNX, IEF, TLT):
Rates may have topped at that 1.765% line. Inflation should ease as the economic growth slows a bit. Not an economy killing slowing, just a relative slowing. No recession in earnings growth or GDP, but Y/Y slowing in the percentage of growth. When the Fed raises rates into that, there will be even more slowing and inflation will ease. Bottlenecks go away if COVID turns from pandemic to endemic. Even less inflation. Fed rates up, long rates down…unless they stop short!

Rates have peaked for now perhaps.
Let’s Check back on my previous list of risks…
What Downside Risks Are There?
1. They are tapering now. “The Federal Reserve will start as early as the next meeting to taper the size of their balance sheet, but the Treasury and mortgage backed security buying is not going to be done for a while. Then and likely only then, will they raise the Fed Funds rate.”
Some believe they’ll raise rates before the taper has ended. Some say this Weds. After this week, I would not be so sure of that. March is still a given for one 0.25% rate hike. 0.50% only if inflation is not coming down by then.
2. Still on again: “Still on: The drag on reopening will lengthen the rally of the stock market. A slower reopening abroad will help our multinationals show increasing sales over time, as will the economies and stock markets of the slower to recover countries.” This is why having some money in European stocks may be a good idea, at least once this selling period is over. That may apply to some emerging markets as well.
3. Sentiment I covered above: “Check: Sentiment has not peaked yet. It will before this is over. There is plenty of cash sitting and making nothing with increasing inflation. Those investors are losing buying power as they sit in too much cash.”
I still don’t believe the Bull market is over, so the max drawdown I’m looking for is a “Mini Bear Market.” It’s an interruption of of a Bull vs. a “Big Bear Market,” such as the COVID Crash. That one was shorter in time than the market reaction was deep, because the economy was turned off like a hose under a car tire. See my “New Rules” if you don’t know what the percentage range is for various dips to corrections to Bears.
4. Last time I said, “Check: Valuations ARE high, but they often go higher than anyone expects before the bell rings on Wall Street.”
That’s done. Buy quality earnings and revenue growth, not high Price/Sales companies. Cathie Woods’ ARKK etc. have been slaughtered. ARKK is down about 50% (last I looked and it dove on Friday once again).
A time will come when ARKK will be so oversold it is again a buy of course, so follow that one down… Buy in steps if you buy early! It could go lower than low…
I post my exposure level on social media and will post the update tonight. In October I said, “I remain at just over 100% of my usual maximum exposure for a Bull market for those reasons.
NOTE: I change my exposure when things change, led first and foremost by stock market signals.
Don’t be surprised if I drop my exposure from 100% to 80% or less, in one day at some point. I don’t share my raw exposure to stocks for a reason. Your allocation should depend on your net worth, your age, and your need for cash in the next 4 years among other things. Find the number that suits you.
I had about 107.00% of my max. Bull exposure near the market top (I go over 100% of my max using cash, NOT leverage). Now my exposure is lower!
My Fed prediction. The Fed did lag. I said, “I believe the Fed will lag behind on inflation, and the 10 Year Treasury will rise further, but how much higher and how fast remain questions…”
The 10 Year rose a lot to above that 1.765% level, and is now just below it.
Now let’s review three key market timing signals together….
Do not use these signals as a trading plan. They are rough guidelines. I currently share my actual BUYS and SELLS in as timely a way as possible on social media (links above).
MY MARKET SIGNAL AND TREND SUMMARY for a Further U.S. Stock Market Rally with Real GDP Growth (“Real” means above inflation):
Stock Signal Bearish for a further U.S. stock market rally with a short term Bearish and longer term Bearish SP500 Index trend. The small caps determine the stock signal in this section of the report.
My longer term view of SPX could change if it holds the Oct. low and bounces.
Gold Signal NEUTRAL for a further U.S. stock market rally. The Gold Trend is short term NEUTRAL and longer term NEUTRAL. If real rates rise as the Fed acts, gold will be hurt, but in the short term, the Fed is hiking into economic slowing Y/Y, so that means rising short rates can LOWER long rates, which could help gold by depressing long term real rates.
Kept for Reference: “Gold can RISE with stocks when real rates are FALLING, and the dollar is falling. The dollar has been stronger of late, due to the Fed’s planned pivot. Gold could rise WITH the dollar if the economy slows and real long rates fall.
These are thing gold doesn’t like: 1. Rising real rates (bonds/Treasuries become a threat to gold which pays nothing; banks and other companies make more money with rising rates) and 2. Economic recovery with higher corporate earnings. Earnings drive stock prices higher. Stocks pay dividends that compete with bonds, and companies use cash to buy back stock, which drives up stock prices, while gold pays nothing.
In liquidity crunches (which the Fed is supposed to prevent) gold can drop with everything else but the US dollar.” As it did on Friday, the 21st of Jan.
What gold does mostly as I’ve written HERE is follow real interest rates around the world (if you own “gold in dollar terms” you care about U.S. rates most of all). The rest of the world does matter however, including massive buying by central banks. Real interest rates have been rising around the globe. Bad for gold.
GUIDE: “Remember GLD is being used as an indicator for the ECONOMY here.” If gold continues to rise again, it means the market believes real rates are going to fall or stay negative for a period of time.
Rate Signal: Bullish for a further U.S. stock market rally, but ONLY if rates continue up SLOWLY. The 10 Year Yield trend is short term Bullish, and intermediate term Bullish, again, as long as rates have NOT topped, which they may have done!
(Remember: higher rates mean lower bond and Treasury prices and vice versa). We want slowly rising rates in a recovering economy. That’s what happens normally. The Fed raises rates slowly as the economy continues to grow until it doesn’t. What we don’t want is rapidly rising OR rapidly falling rates, both of which I call “Rate Shocks.”
Thank you for reading. Would you please leave your comments below where it says “Leave a reply”… or ask a question if you like…
Pay it forward by sending the link to MarketTiming.Blog (that link will immediately connect them to this webpage) to a relative or friend. Thanks for doing that.
Be sure to visit the website for more general investing knowledge at:
Standard Disclaimer: It’s your money and your decision as to how to invest it.
I thank Worden Brothers for the charting system I use to post these charts. If you want to know more about the charting system I use every day, contact me for any questions, or click HERE. Please use that link when you sign up as I am an affiliate (I don’t make much, but it may help to pay for some of my website expenses). It makes it much easier to follow along with me if you can see the charts and manipulate them on your own computer. It’s a great investment to have an excellent charting system.
Note: I’ve updated my criteria for the equity signal for a further U.S. stock market rally to the following: GREEN = Bullish, YELLOW = Neutral, RED = Bearish. In other words, the colors tell you whether the signal supports the stock rally or not, while the Bullish, Neutral, and Bearish designations are about the trend.
A BEARISH trend signal does not mean we should not buy. A BULLISH trend signal does not mean you cannot sell some exposure. It depends on what is going on in the economy and how oversold/overbought the market is at a given point whether the Bearish signal is to be sold or bought, sold on the next bounce, etc. and whether a Bullish signal is to be bought or if profits should be taken. A NEUTRAL trend signal does not mean the end of the Bull or Bear. It means to wait and look for possible subsequent entry points within the existing trend, Bull or Bear, but preserve capital if the entry fails. Our strong intention is to buy low and sell high. By the way, I will keep showing the prior orange “Trigger lines” in the IWM and GLD charts for now as reference points only; they have historical value for us from the post-2016 election period.
Copyright © 2022 By Wall Street Sun and Storm Report, LLC All rights reserved.
